The main tag of GoldPrice Articles.
You can use the search box below to find what you need.
[wd_asp id=1]
The main tag of GoldPrice Articles.
You can use the search box below to find what you need.
[wd_asp id=1]
Important DisclaimersThe content provided on the website includes general news and publications, our personal analysis and opinions, and contents provided by third parties, which are intended for educational and research purposes only. It does not constitute, and should not be read as, any recommendation or advice to take any action whatsoever, including to make any investment or buy any product. When making any financial decision, you should perform your own due diligence checks, apply your own discretion and consult your competent advisors. The content of the website is not personally directed to you, and we does not take into account your financial situation or needs.The information contained in this website is not necessarily provided in real-time nor is it necessarily accurate. Prices provided herein may be provided by market makers and not by exchanges.Any trading or other financial decision you make shall be at your full responsibility, and you must not rely on any information provided through the website. FX Empire does not provide any warranty regarding any of the information contained in the website, and shall bear no responsibility for any trading losses you might incur as a result of using any information contained in the website.The website may include advertisements and other promotional contents, and FX Empire may receive compensation from third parties in connection with the content. FX Empire does not endorse any third party or recommends using any third party’s services, and does not assume responsibility for your use of any such third party’s website or services.FX Empire and its employees, officers, subsidiaries and associates, are not liable nor shall they be held liable for any loss or damage resulting from your use of the website or reliance on the information provided on this website.Risk DisclaimersThis website includes information about cryptocurrencies, contracts for difference (CFDs) and other financial instruments, and about brokers, exchanges and other entities trading in such instruments. Both cryptocurrencies and CFDs are complex instruments and come with a high risk of losing money. You should carefully consider whether you understand how these instruments work and whether you can afford to take the high risk of losing your money.FX Empire encourages you to perform your own research before making any investment decision, and to avoid investing in any financial instrument which you do not fully understand how it works and what are the risks involved.
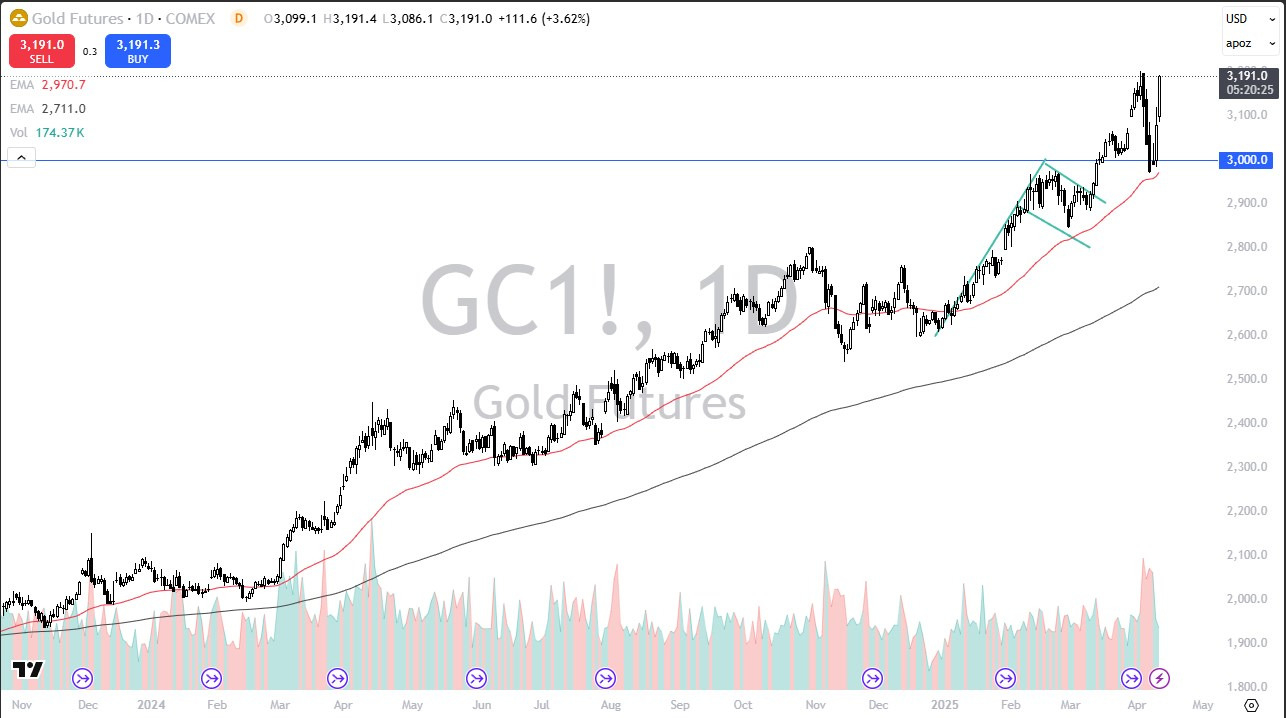
Most of what you’ve seen recently has been forced liquidation by hedge funds who were trying to cover losses in other markets. Remember, they have a leveraged book. So if they find themselves in serious trouble, for example, with the NASDAQ 100 or maybe something along the lines of levered Tesla or Nvidia positions, and sooner or later, they are forced to pay more margin and typically, what they’ll do is they will sell a market that’s done very well to collect some of those profits and send them to their prime dealer. The $3,000 level has offered support. The 50-day EMA as well, just below, has offered support and at this point in time, it looks like we are ready to go screaming higher again.

I don’t expect this type of momentum to continue, but I do think that the uptrend is most certainly going to be looking at the bullish flag underneath, we had a measured move of $3,300 and there’s nothing on the chart that suggests that we can’t get there. In fact, I do think we will probably go higher than that. Gold is screaming higher for a multitude of reasons, not just the fact that there’s a lot of financial stress out there, the simple fact that there’s a lot of geopolitical problems, and of course it looks like the global economy may slow down in various places. So, all this leads for a continuation of the trend that we’ve seen for the better part of a year and a half now.
Ready to trade today’s Gold forecast? Here are the best Gold brokers to choose from.
Despite macro headwinds, LNG exports held strong. Net flows to US export terminals reached 16.3 Bcf/d on Friday, up 9.1% week-over-week. This remains a key area of support for prices. Traders are also watching US storage levels, which BloombergNEF projects will be 10% below the five-year average by summer—keeping bullish positioning alive even as near-term drivers remain mixed.
EIA data showed a +57 Bcf injection for the week ended April 4, broadly in line with expectations but well above the five-year average of +17 Bcf for this period. Storage remains 2.1% below the five-year norm and 19.8% under last year, signaling tight underlying supply. Still, the size of the injection gave the market little reason to rally.
Dry gas production held at 106.2 Bcf/d, up 4.7% y/y, while demand reached 76.7 Bcf/d, up 11.4% y/y. Electricity output rose 4.05% y/y, suggesting firm baseline power burn, but not yet summer-driven demand.
Weather outlooks are neutral to slightly bearish. The Commodity Weather Group sees above-normal temps in the West and seasonal conditions elsewhere from April 16–20—limiting late-season heating demand. Baker Hughes reported an increase of one rig, bringing the gas rig count to 97, still historically low but off recent lows.
With trade tension clouding demand outlooks and weather offering no near-term support, nat-gas looks vulnerable to further downside. LNG flows and tight storage remain bullish anchors, but unless a weather or export catalyst emerges, price action may continue to drift lower in the near term.
More Information in our Economic Calendar.
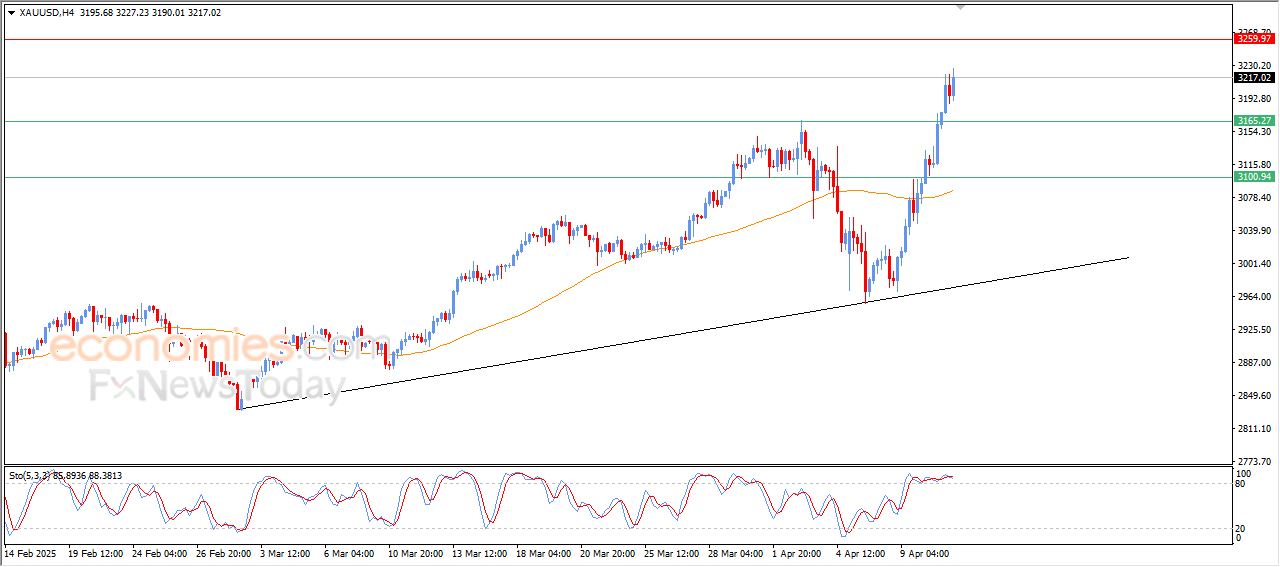
The price of gold (GOLD) has moved higher strongly in its recent intraday trading, supported by positive signals from relative strength indicators (RSI), reaching our first target to test the current resistance level of $3,053. This comes amid the dominance of the main upward trend, with trading occurring near the trend line.
To get our more detailed analysis and 100% accurate signals provided by Best Trading Signal, subscribe to Economies.com VIP Club through the link below!
Just two weeks ago, copper prices were climbing fast due to the US stockpiling ahead of new tariffs. Traders warned that new US tariffs on copper could squeeze global supply. But things turned around quickly. But now, the copper rally has reversed into a full-blown crash.
This is a direct outcome of President Donald Trump’s trade war, aka “Trump Tariffs,” that is shaking the global market. Investors now fear that the new tariffs will slow down demand for copper worldwide.
Bloomberg reported, on Friday, April 4, copper prices dropped sharply, along with stock markets. The fall continued till Monday. In the London Metal Exchange, copper prices sank as much as 7.7% before bouncing back slightly to $8,735 a ton.

Earlier, we saw how traders rushed to send copper to the US before tariffs hit, driving premiums as high as $500 a ton. Big players like Mercuria and Trafigura even predicted prices could reach $12,000 a ton. But things changed rapidly when Trump shortened the tariff timeline, giving buyers very few days in hand.
Because of this, copper is piling up outside the US. Global buyers have more to choose from, but many aren’t interested. With demand dropping due to tariffs, the extra supply doesn’t help.
Chile, the world’s biggest copper producer, is preparing to lower its copper price estimate for 2025. It’s a telltale sign of growing global economic concerns.
According to the Wall Street Journal, Chile’s copper agency, Cochilco, held its 2025 price forecast at $4.25 per pound in February. This came after it raised the estimate from $3.85 back in May 2024.
It also kept the 2026 forecast at $4.25. Cochilco expects copper prices to stay above $4.00 per pound for the next ten years.
The final figure will be announced by the end of April. However, Juan Ignacio Guzman, head of Chilean mineral consulting firm GEM, said,
“If the trade war triggers a recession, prices could tumble to as low as $3 a pound — or about $6,600 a ton.”

Chile, which produced 24% of the world’s copper last year, is now feeling the pressure.
In a separate report from the Shanghai Metals Market, we discovered that,
Earlier this year, in January and February, Chile’s copper production dropped compared to the previous month. Exports to China also declined during that period.
The Bloomberg report highlighted that the worst might not be over. Max Layton, global head of commodities research at Citigroup Inc., warned that the global trade shake-up could lead to a historic market correction. Citi now expects copper prices outside the US to average $8,500 this quarter — but they also say the risk of further drops is high.
BNP Paribas SA strategist David Wilson, who had warned prices could collapse, now sees the downtrend continuing in the short term. Goldman Sachs still believes in copper’s long-term value but admits that slower global growth could delay the expected supply shortage.
Meanwhile, JPMorgan now expects the US to fall into a recession this year. UBS estimates that every 1% drop in US GDP could cut output in export-driven Asian economies like Taiwan and South Korea by up to 2%.
Copper stocks have taken a beating amid falling prices, global slowdown fears, and rising trade tensions. The sharp selloff followed news from China’s Xinhua News Agency that Beijing will impose a 34% tariff on all US imports starting April 10.
Here’s a quick look at how major mining companies are reacting:
KNOW MORE: Copper Prices Slump Below $9,000: What Does It Mean for Global Growth?
What started as a bullish rush has turned into a brutal crash. With tariffs rising and demand shrinking, copper is now a symbol of deeper market fears. Global supply chains are out of sync, and the world’s top miners are feeling the heat. If trade tensions escalate, this copper price crash may face a difficult recovery.
The short-term weather outlook offers only modest demand support. NatGasWeather reports a late-season chill pushing through the Great Lakes and East, with overnight lows in the 20s-30s. However, mild to warm conditions persist across the West, South, and Central U.S., with highs reaching the 50s to 90s. With this mix, demand is projected to remain moderate over the next seven days—insufficient on its own to drive a bullish breakout.
Thursday’s EIA report showed a storage injection of 57 Bcf, aligning with consensus estimates of 55–56 Bcf. This build was significantly above the five-year average of +17 Bcf, underscoring muted residential and commercial demand. Total working gas in storage now stands at 1,830 Bcf—40 Bcf below the five-year average and 450 Bcf less than this time last year. While slightly tighter year-on-year, the surplus over five-year norms has evaporated, offering limited fundamental upside.
Beyond domestic fundamentals, traders remain wary of broader risk-off sentiment, including renewed fears tied to the U.S.-China trade war. A breakdown in energy sector sentiment pressured natural gas alongside crude on Friday, suggesting further downside if macro headwinds intensify.
Unless bulls defend $3.361 with conviction, natural gas futures are likely to probe lower technical levels. With no immediate weather or storage support and resistance levels still capping rallies, the short-term bias leans bearish. A move toward $2.995 could attract bargain hunters, but until then, sellers appear in control.
More Information in our U.S. natural gas futures.
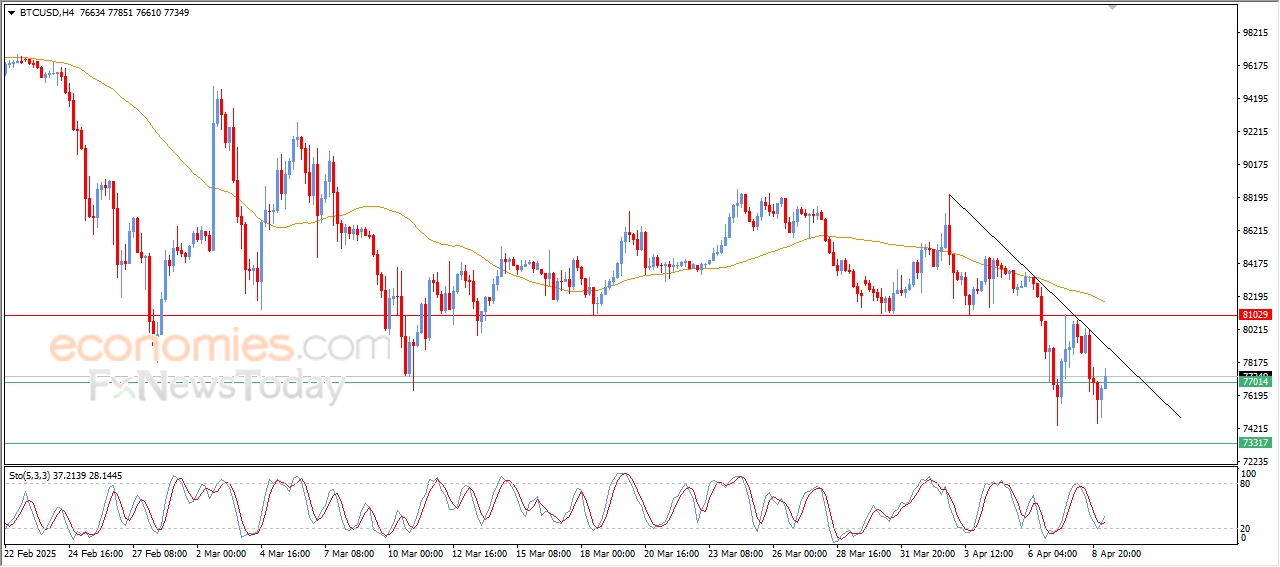
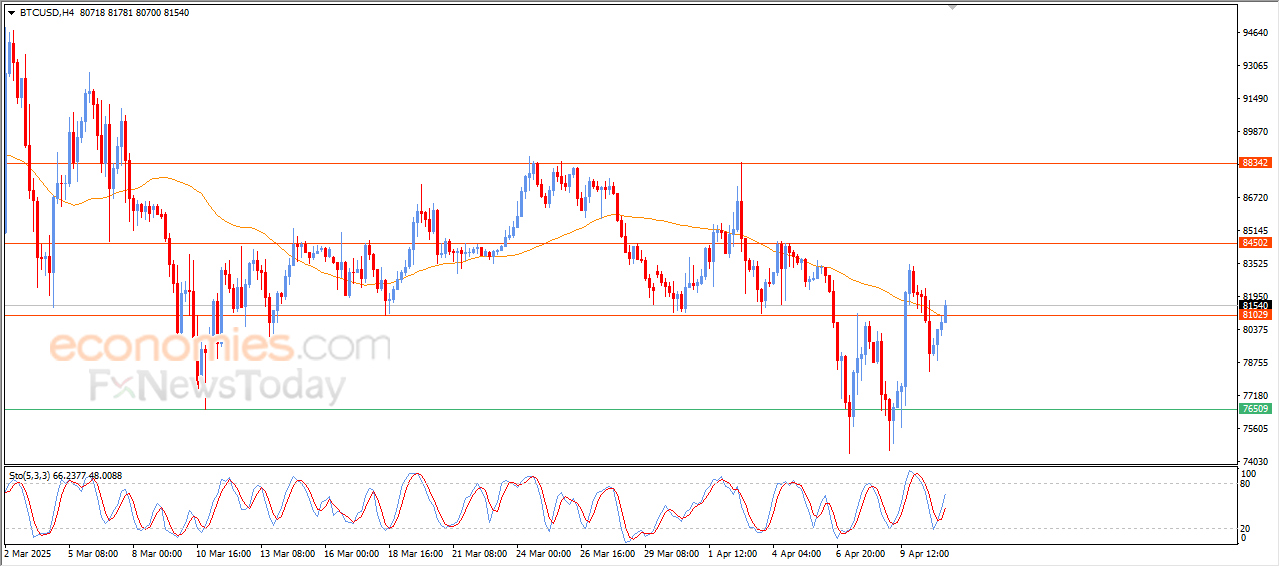
Bitcoin (BTCUSD) has risen in its recent intraday trading, surpassing the negative pressure from the EMA50, breaching the strong resistance level at $81,000, which supports the bullish scenario, especially with the positive signals that appearing on the Relative Strength Index (RSI).
To get our more detailed analysis and 100% accurate signals provided by Best Trading Signal, subscribe to Economies.com VIP Club through the link below!
At the time of this writing, natural gas continues to trade above the midpoint of the day’s trading range and looks likely to end the day with a potentially bullish hammer or doji hammer candlestick pattern. The high for the day was $3.58. Earlier in the session a breakdown of an inside day pattern from Thursday triggered, resulting in a test of support as mentioned above. Since a potentially bullish one-day pattern followed, today’s closing price is likely to be above Thursday’s low of $3.47. This sets up a potentially bullish pattern heading into next week.
Nonetheless, it is not just today’s pattern that is potentially bullish, it is also the combination with the patterns of the prior two days. Since natural gas is likely to close inside yesterday’s range and in the top half of today’s price range, the bearish breakdown shows signs of a failed pattern. The three-candle combination is a potentially bullish hikkake pattern. It can be both a reversal or continuation pattern and it will trigger on a rally above Thursday’s high of $3.75.
However, an advance above today’s high can provide an earlier valid bullish signal regardless of the hikkake pattern being present. Given the three-period combination, it is a potentially powerful short-term pattern. Of course, a drop below today’s low is short-term bearish and indicates a failure of the potentially bullish pattern
Initial upside targets start with the four-day high of $3.83 and the 50-Day MA, now at $3.89. A declining trendline at the top of the channel may also be around the 50-Day line when approached, and it may provide clues. Subsequently, if an upside breakout of the downtrend line triggers the 50% retracement at $4.12 becomes a potential target, followed by an interim swing high and 61.8% Fibonacci retracement at $4.26 and $4.30, respectively.
For a look at all of today’s economic events, check out our economic calendar.
The CADCHF pair’s price kept the negative stability below 0.6020 barrier, affected by the negativity of the main indicators, to notice resuming the negative attack by reaching 0.5850.
No escape of the price from forming more of the bearish waves, due to the validation of the main negative factors, to expect reaching the extra target at 0.5785, and breaking it might extend the losses in the near period towards 0.5715 reaching to the support level of the bearish channel’s support at 0.5645.
The expected trading range for today is between 0.5715 and 0.5950.
Trend forecast: Bearish
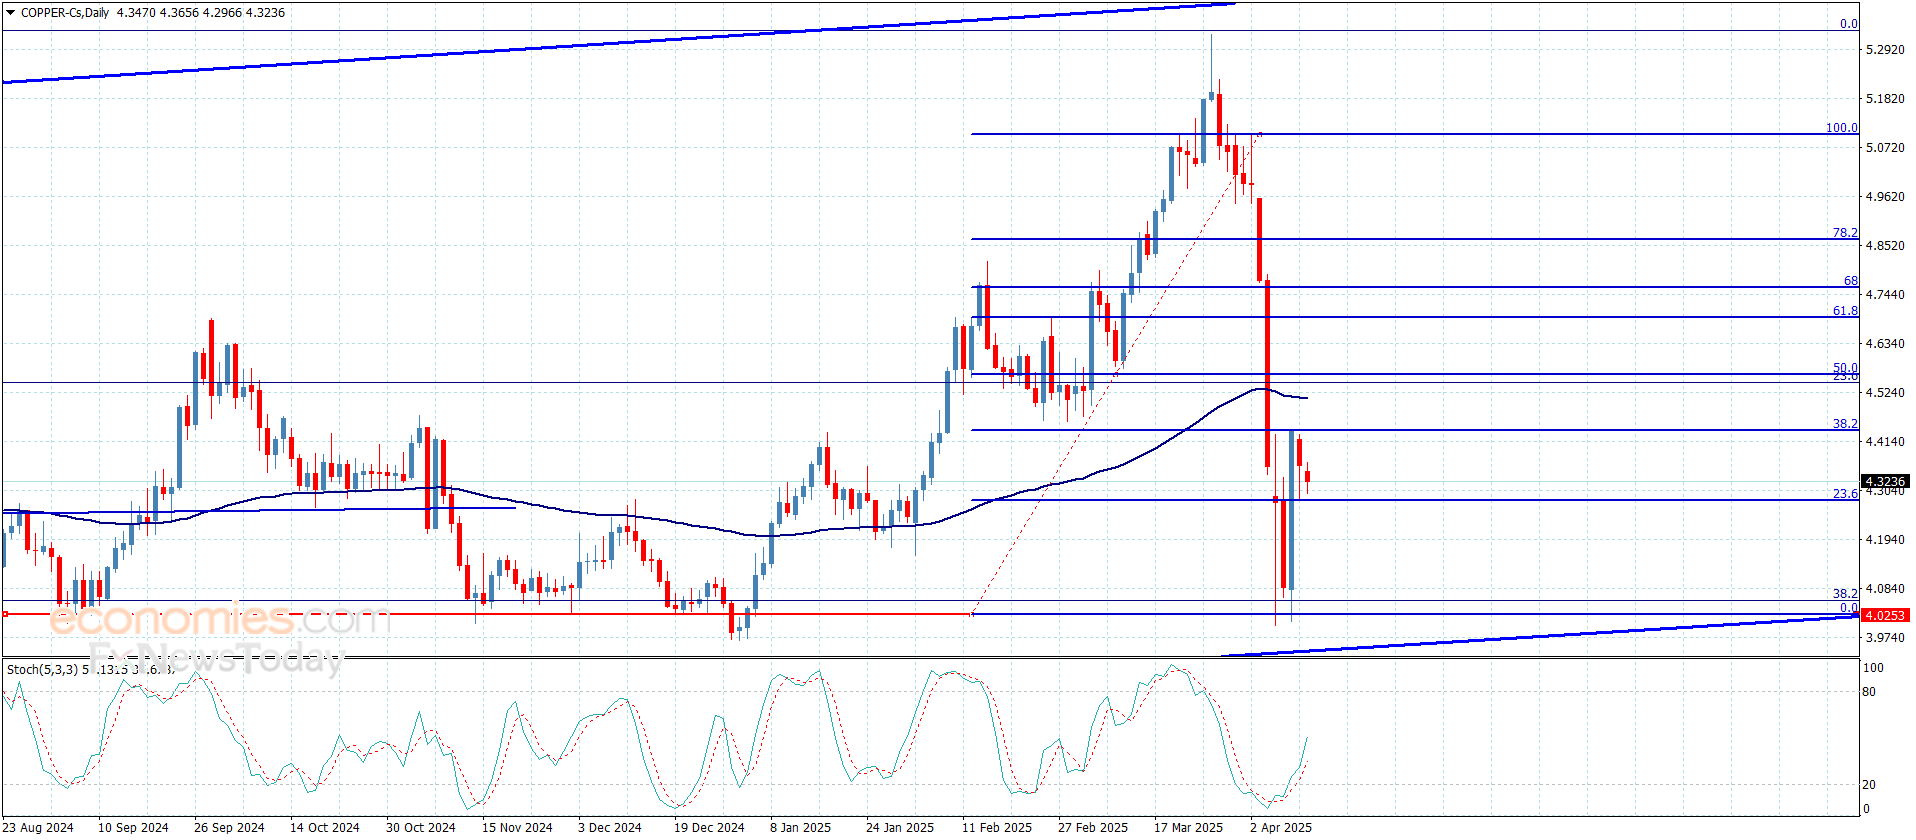
Copper price didn’t move anything since yesterday’s trading, delaying the bullish rally by its repeated fluctuation below 38.2%Fibonacci correction level, which represents an intraday obstacle by its stability near $4.4000.
The continuation of stochastic attempts to provide positive momentum and the repeated stability above the critical support at $4.000, these factors make us keep the bullish suggestion, to expect the mentioned obstacle and holding above it, targeting extra positive stations that begin at $4.5600 and $4.6800.
The expected trading range for today is between $4.2300 and $4.5600
Trend forecast: Bullish