The main tag of GoldPrice Articles.
You can use the search box below to find what you need.
[wd_asp id=1]
The main tag of GoldPrice Articles.
You can use the search box below to find what you need.
[wd_asp id=1]
Adobe’s stock price (ADBE) edged higher in the intraday levels while trying to recoup some recent losses, as it vented off oversold saturation in the RSI, while still suffering negative from trading below the 50-day SMA, amid the dominance of the main downward trend in the medium term, while trading alongside the secondary short-term trend line.
Therefore we expect the stock to return lower, targeting the support of $403.75, provided the resistance of $465.70 holds on.
Trend forecast for today: likely Bearish
The GBPCAD price reacted to the positive factors represented by leaning within the bullish channel in addition to the continuous positive momentum coming by the major indicators, to notice forming new bullish rally recently and surpass 1.8235 recorded high to start recording new gains by reaching 1.8445.
Note that stochastic continuous fluctuation within the overbought areas might increase the chances of gaining the required additional positive momentum to target more positive stations, to expect targeting 1.8470 as a first additional station, followed by reaching the bullish channel’s resistance line at 1.8600.
The expected trading range for today is between 1.8340 and 1.8470
Trend forecast: Bullish
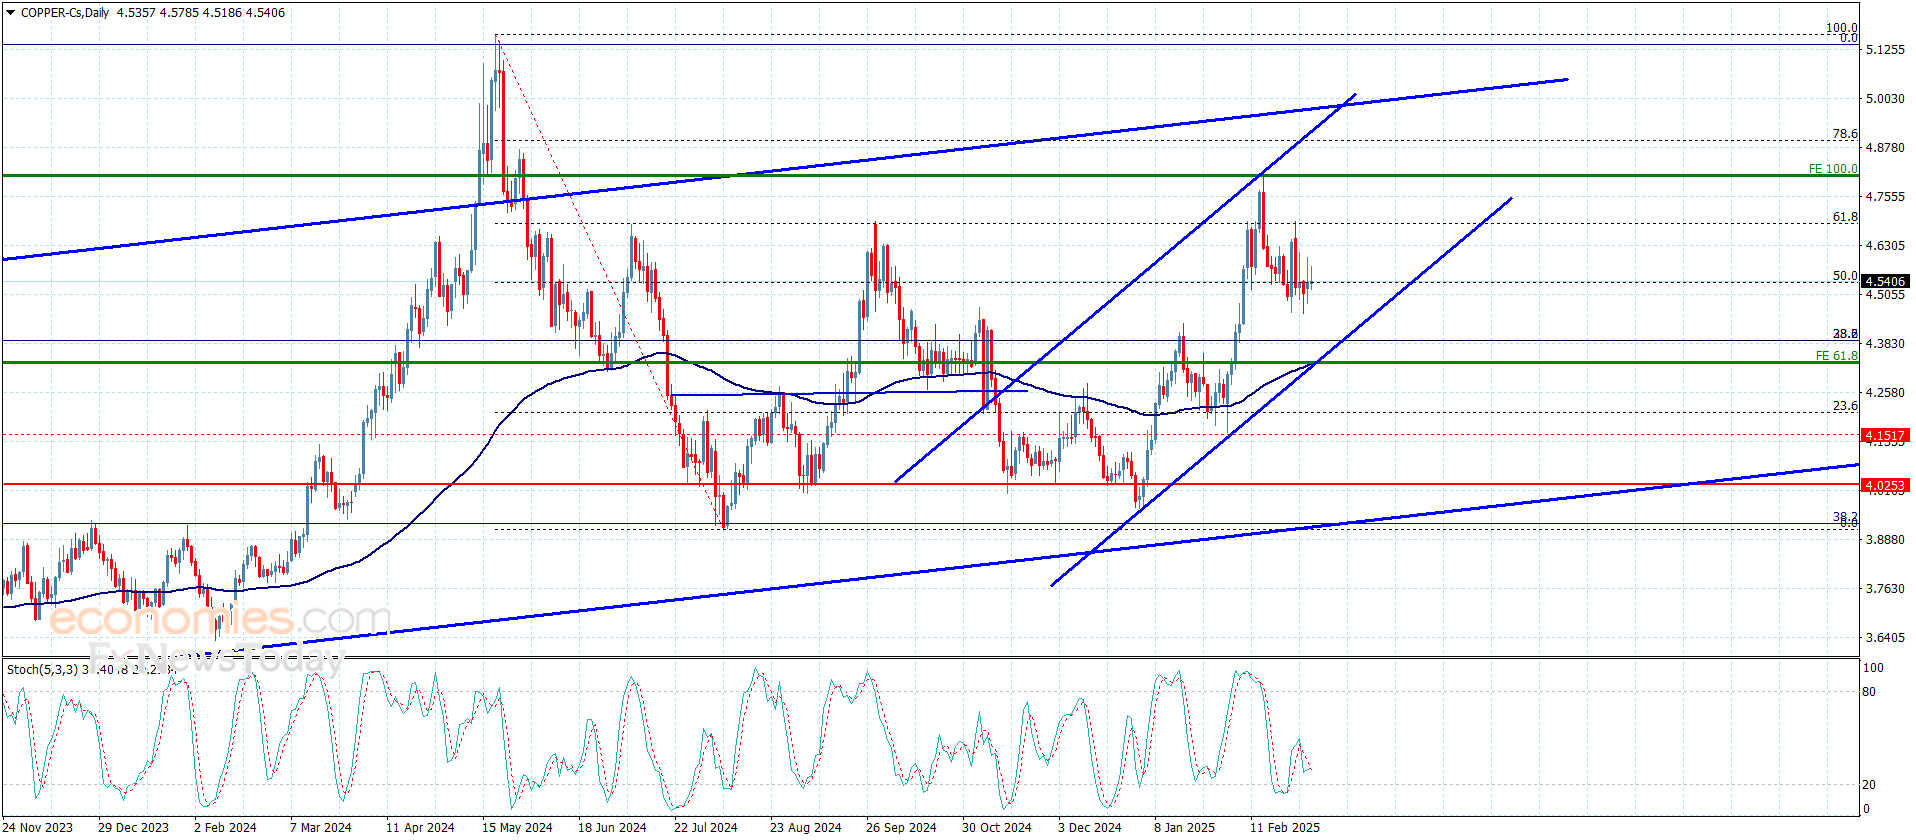
No news for copper price, to continue providing slow sideways trades by settling near 4.5400$, affected by the contradiction between the major indicators until this moment, reminding you that the frequent stability below 4.6800$ barrier reinforces the chances of resuming the negative correction that might target 4.3900$ level soon, followed by reaching the minor bullish channels’ support line at 4.3200$.
The expected trading range for today is between 4.3900$ and 4.5600$
Trend forecast: Bearish
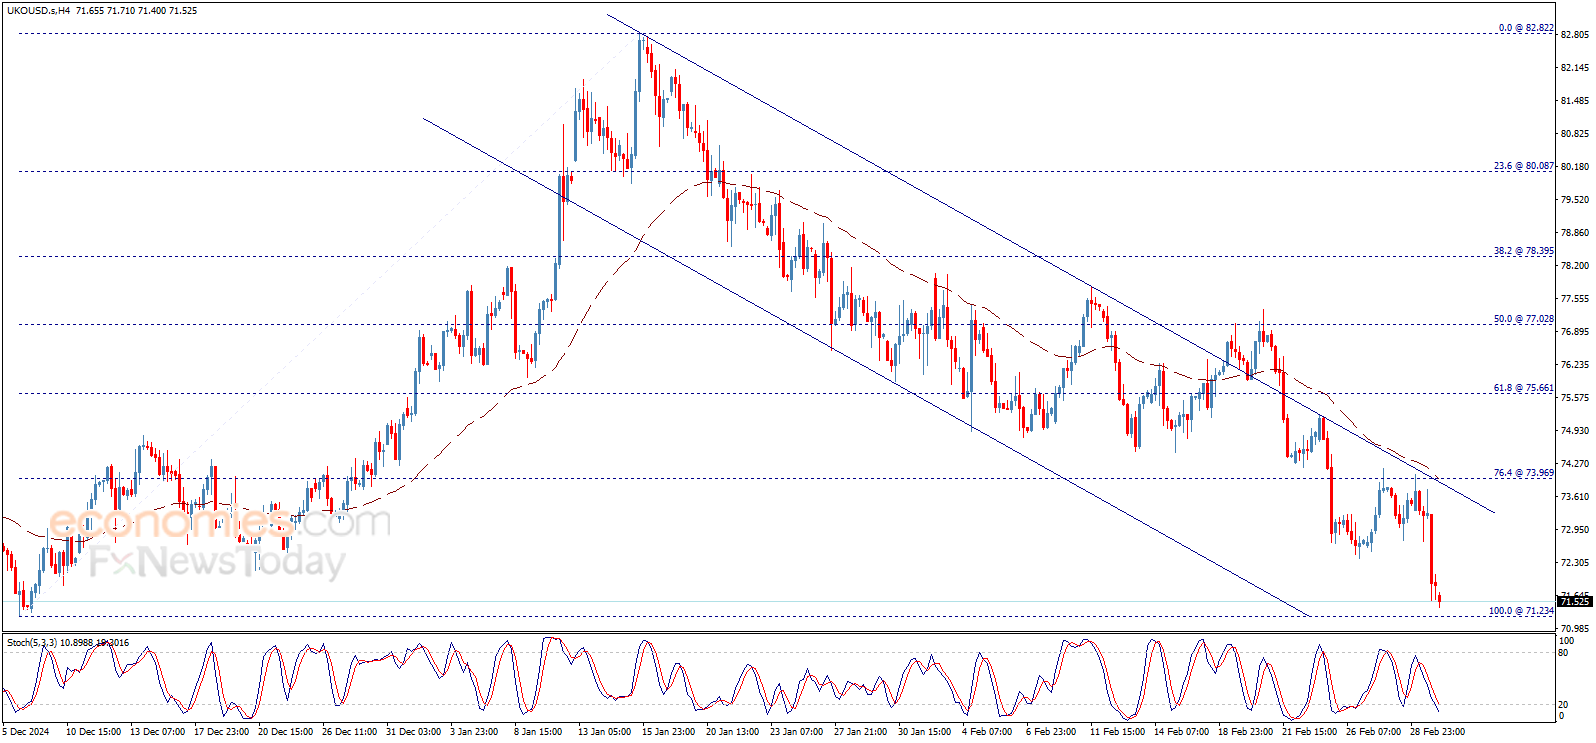
Brent oil price traded with strong negativity yesterday to surpass our first target at 72.70$ and reach the thresholds of the second waited target at 71.25$, and we believe that the way is open to continue the decline on the intraday and short-term basis, as we suggest breaking the last level to open the way to continue the bearish trend in the upcoming period.
To get our more detailed analysis and 100% accurate signals provided by Best Trading Signal, subscribe to Economies.com VIP Club through the link below!
Gold price is treading water below $2,900 early Tuesday, consolidating the recent upswing before the next push higher.
Markets remain risk-averse as a global tariff war seems inevitable, with US President Donald Trump affirming 25% tariffs on Canada and Mexico effective on Tuesday while he already signed the order to raise China tariffs to 20%.
In response, China’s Commerce Ministry and the Canadian prime minister’s office confirmed retaliatory tariffs on the US, triggering a tit-for-tat situation, which could translate into a full-fledged trade war.
Additionally, risks of the US economy tipping into recession have heightened amid increased expectations of Trump’s tariffs-led higher inflationary pressures and falling investors’ confidence. The Atlanta Fed GDP tracker now is at -2.8%, having reported a 5% collapse in two business days. Meanwhile, US ISM Manufacturing PMI declined to 50.3 in February, down from 50.9, missing expectations of 50.8. This was due to a sharp drop in new orders, which plunged from 55.1 to 48.6.
US recession fears fuelled a tech sell-off on Wall Street on Monday, prompting investors to run for cover in the traditional safe-haven Gold price as the US Dollar (USD) was sold off into the gloomy US economic outlook. US Treasury bond yields tumbled to the lowest level in five months, allowing Gold price to rebound toward the $2,900 threshold.
However, it remains to be seen if Gold price can regain that level as the USD could find fresh haven demand should risk aversion intensify in the sessions ahead. That said, geopolitical tensions will continue to play their part, cushioning any downside in the bright metal.
CNN News reported on Monday that US President Trump ordered military aid to Ukraine to be paused after his Friday Oval Office argument with Ukrainian President Volodymyr Zelensky. This put the US at crossfires with his European allies like Britain and France, who made clear their support for Zelensky at a summit in London on Sunday.
On Sunday, European leaders agreed to draft a peace plan on the Ukraine conflict to present to Washington.
Markets also remain wary as attention turns to the US employment data due later this week, which could significantly impact the US Federal Reserve’s (Fed) interest rate-cut outlook, influencing the value of the USD and the Gold price action in the near term.
The daily chart shows that Gold price has stalled its latest move higher at the 21-day Simple Moving Average (SMA) of $2,900.
The recovery will likely gain traction only on acceptance above that level on a daily candlestick closing basis.
The Relative Strength Index (RSI) has turned slightly lower but holds well above the 50 level, suggesting that the upside bias remains intact.
The February 26 high of $2,930 will be on their radars if the 21-day SMA at $2,900 is taken out sustainably.
The next topside barrier is seen at an all-time high of $2,956.
If sellers refuse to step aside, the immediate support is seen at the $2,850 psychological barrier, below which the $2,835 demand area will be retested.
Additional declines will challenge the $2,800 round level.
Tariffs are customs duties levied on certain merchandise imports or a category of products. Tariffs are designed to help local producers and manufacturers be more competitive in the market by providing a price advantage over similar goods that can be imported. Tariffs are widely used as tools of protectionism, along with trade barriers and import quotas.
Although tariffs and taxes both generate government revenue to fund public goods and services, they have several distinctions. Tariffs are prepaid at the port of entry, while taxes are paid at the time of purchase. Taxes are imposed on individual taxpayers and businesses, while tariffs are paid by importers.
There are two schools of thought among economists regarding the usage of tariffs. While some argue that tariffs are necessary to protect domestic industries and address trade imbalances, others see them as a harmful tool that could potentially drive prices higher over the long term and lead to a damaging trade war by encouraging tit-for-tat tariffs.
During the run-up to the presidential election in November 2024, Donald Trump made it clear that he intends to use tariffs to support the US economy and American producers. In 2024, Mexico, China and Canada accounted for 42% of total US imports. In this period, Mexico stood out as the top exporter with $466.6 billion, according to the US Census Bureau. Hence, Trump wants to focus on these three nations when imposing tariffs. He also plans to use the revenue generated through tariffs to lower personal income taxes.
Strong support was seen from the day’s low of $3.74. It is a price area discussed over the past week or so as being potentially a significant support zone since it marks an area of confluence. The 20-MA is at $3.76, there is a 50% retracement level at $3.73, and the 50-Day MA line is at $3.73. Given the bullish reaction, it looks clear that the price zone was recognized. Therefore, a bearish retracement might have completed today, opening the way for a continuation towards resistance at recent highs and possibly new trend highs.
The next sign of strength will be on a rally above the five-day high and prior interim swing high at $4.19. That is also a weekly high from last week. There is then a potential resistance zone from the January high at $4.37 to the February high at $4.48. It is interesting to note that the recent pullback took a form like a falling bullish wedge. A bull breakout triggered today.
This puts natural gas in a bullish position to possibly reach new trend highs. The next higher target is a 50% retracement of a previous interim decline at $4.56. Note the resistance was seen around a top trend channel line at each of the recent swing highs. Nonetheless, depending on how prices rise, natural gas could hit the 50% retracement target and stay below potential resistance around the top trendline.
For a look at all of today’s economic events, check out our economic calendar.
Silver price recovers, climbs above the $31.50 mark on Monday as the Greenback depreciates sharply across the board. Tariffs on Mexico, Canada and China would begin on March 4, according to US President Donald Trump in a press conference held at the Oval Office. This and the drop in US Treasury bond yields keep XAG/USD trading at $31.67, gaining over 1.76%.
Silver price rebound after dipping below the 50-day Simple Moving Average (SMA) of $30.93, before reclaiming $31.00. On its way to the current spot price, XAG/USD climbed past the 100-day SMA at $31.21, exacerbating Silver’s advance past the $31.50 area.
If XAG/USD closes on a daily basis above the latter, it would be poised to challenge key resistance levels like the $32.00 mark, and the February 20 peak at $33.20.
Conversely, if XAG/USD drops below $31.50, the immediate support would be the 50-day SMA, followed by the 200-day SMA at $30.43.
Silver is a precious metal highly traded among investors. It has been historically used as a store of value and a medium of exchange. Although less popular than Gold, traders may turn to Silver to diversify their investment portfolio, for its intrinsic value or as a potential hedge during high-inflation periods. Investors can buy physical Silver, in coins or in bars, or trade it through vehicles such as Exchange Traded Funds, which track its price on international markets.
Silver prices can move due to a wide range of factors. Geopolitical instability or fears of a deep recession can make Silver price escalate due to its safe-haven status, although to a lesser extent than Gold’s. As a yieldless asset, Silver tends to rise with lower interest rates. Its moves also depend on how the US Dollar (USD) behaves as the asset is priced in dollars (XAG/USD). A strong Dollar tends to keep the price of Silver at bay, whereas a weaker Dollar is likely to propel prices up. Other factors such as investment demand, mining supply – Silver is much more abundant than Gold – and recycling rates can also affect prices.
Silver is widely used in industry, particularly in sectors such as electronics or solar energy, as it has one of the highest electric conductivity of all metals – more than Copper and Gold. A surge in demand can increase prices, while a decline tends to lower them. Dynamics in the US, Chinese and Indian economies can also contribute to price swings: for the US and particularly China, their big industrial sectors use Silver in various processes; in India, consumers’ demand for the precious metal for jewellery also plays a key role in setting prices.
Silver prices tend to follow Gold’s moves. When Gold prices rise, Silver typically follows suit, as their status as safe-haven assets is similar. The Gold/Silver ratio, which shows the number of ounces of Silver needed to equal the value of one ounce of Gold, may help to determine the relative valuation between both metals. Some investors may consider a high ratio as an indicator that Silver is undervalued, or Gold is overvalued. On the contrary, a low ratio might suggest that Gold is undervalued relative to Silver.
Spot Gold found an interim bottom at $2,832.56 on Friday, bouncing from the level ahead of the weekly close and extending its recovery on Monday. The XAU/USD pair trades around $2,885, up on broad US Dollar (USD) weakness. Financial markets kick-stated the week in optimistic mode, helped by macroeconomic data released throughout the first half of the day. The bright metal, in the meantime, found support on geopolitical woes.
On the one hand, Chinese NBS Purchasing Managers’ Indexes (PMIs) were better than anticipated in February, with index output up to 50.2 from 49.1 in January, while the non-manufacturing index rose to 50.4 from 50.2. Additionally, S&P Global released the final estimates of the February Manufacturing PMI for major economies, upwardly revising most of them.
On the other hand, tensions between the United States (US) and Ukraine persist after Ukrainian President Volodymyr Zelenskyy abruptly left a meeting with US President Donald Trump on Friday. As a result, Eastern European nations aligned beyond Ukraine on fears the US will retrieve its support.
The USD extended its slide after the US reported that the official ISM Manufacturing PMI fell to 50.3 in February from 50.9 in January, also missing expectations of 50.5. The bright metal, in the meantime, was underpinned by headlines indicating that US President Donald Trump is meeting with his aides to discuss canceling military aid to Ukraine.
Meanwhile, US tariffs of 25% on Mexico and Canada and an additional 10% on China are due to come into effect on Tuesday. Trump would decide on this matter later in the day. US Secretary of Commerce Howard Lutnick said Canada and Mexico have done a “good job” on the border, while adding they still need to tackle the fentanyl issue.
From a technical point of view, the daily chart for the XAU/USD pair shows the ongoing recovery is not enough to anticipate a recovery towards record highs. The pair is trading well above bullish 100 and 200 Simple Moving Averages (SMAs), yet the 20 SMA provides dynamic resistance at around $2,899.50. Technical indicators, in the meantime, turned higher but hover around their midlines with uneven strength, overall remaining neutral.
In the near term, and according to the 4-hour chart, the risk skews to the upside, although additional confirmations are required. Technical indicators aim firmly higher, recovering from oversold readings yet currently battling their midlines. The same chart shows buyers appeared around a bullish 200 SMA, while a flat 100 SMA provides resistance at around $2,910.
Support levels: 2,876.90 2,858.70 2,845.40
Resistance levels: 2,894.80 2,907.60 2,925.60
At 14:35 GMT, Natural Gas Futures are trading $3.899, up $0.065 or +1.70%.
Weather forecasts remain a key bearish factor. Maxar Technologies projects above-normal temperatures from March 10-14 across the Rockies to the Atlantic, limiting heating demand. This follows an earlier February rally driven by storage tightness, but with winter demand winding down, concerns over consumption are resurfacing.
Lower-48 gas demand fell to 80.2 Bcf/d last Friday, marking a 10.3% year-over-year decline. Without a late-season cold snap, traders may struggle to find strong bullish catalysts. Despite last week’s 261 Bcf storage draw—above the five-year average—current trends indicate weaker consumption, keeping pressure on prices.
Production remains robust, with Lower-48 dry gas output at 107.8 Bcf/d, up 2.8% year-over-year. Meanwhile, LNG exports provide some support, with flows to U.S. terminals rising to 15.6 Bcf/d, a 2.1% weekly increase.
A potential long-term bullish factor emerged as the Trump administration lifted restrictions on new LNG export projects. Bloomberg reported that a decision on the Commonwealth LNG facility in Louisiana is approaching, which could eventually boost U.S. natural gas demand. However, in the short term, storage and weather are dictating price action.
Silver price (XAG/USD) surges an almost 1% to near $31.50 in European trading hours on Monday. The white metal strengthens as an increase in Federal Reserve (Fed) dovish bets has weighed on the US Dollar (USD).
The US Dollar Index (DXY), which tracks the Greenback’s value against six major currencies, resumes its downside after a three-day upside move and slumps to near 107.00.
According to the CME FedWatch tool, there is a 77% chance that the Fed will cut its borrowing rates in June, up from 63% a week ago. In the March and May policy meetings, the Fed is almost certain to keep interest rates steady in the range of 4.25%-4.50%.
Traders have raised bets supporting the Fed to reduce its borrowing rates in June after the United States (US) Personal Spending data declined for the first time in January in two years.
For more cues on the Fed’s monetary policy outlook, investors will focus on a slew of US economic data, notably on the Nonfarm Payrolls (NFP), releasing this week.
Meanwhile, fears of US President Donald Trump’s tariffs on Canada, Mexico, and China have also increased the demand for safe-haven Silver. On March 4, Trump is poised to impose tariffs on these countries for pouring drugs into the US economy.
Silver price recovers to near $31.50 in Monday’s European session. However, the outlook of the Silver price remains bearish as it trades below the 50-day Exponential Moving Average (EMA), which is around $31.80.
The 14-day Relative Strength Index (RSI) falls inside the 40.00-60.00 range, suggesting that the bullish momentum has faded. However, the bullish bias remains intact.
Looking down, the upward-sloping trendline from the August 8 low of $26.45 will act as key support for the Silver price around $30.00. While, the February 14 high of $33.40 will be the key barrier.
Silver is a precious metal highly traded among investors. It has been historically used as a store of value and a medium of exchange. Although less popular than Gold, traders may turn to Silver to diversify their investment portfolio, for its intrinsic value or as a potential hedge during high-inflation periods. Investors can buy physical Silver, in coins or in bars, or trade it through vehicles such as Exchange Traded Funds, which track its price on international markets.
Silver prices can move due to a wide range of factors. Geopolitical instability or fears of a deep recession can make Silver price escalate due to its safe-haven status, although to a lesser extent than Gold’s. As a yieldless asset, Silver tends to rise with lower interest rates. Its moves also depend on how the US Dollar (USD) behaves as the asset is priced in dollars (XAG/USD). A strong Dollar tends to keep the price of Silver at bay, whereas a weaker Dollar is likely to propel prices up. Other factors such as investment demand, mining supply – Silver is much more abundant than Gold – and recycling rates can also affect prices.
Silver is widely used in industry, particularly in sectors such as electronics or solar energy, as it has one of the highest electric conductivity of all metals – more than Copper and Gold. A surge in demand can increase prices, while a decline tends to lower them. Dynamics in the US, Chinese and Indian economies can also contribute to price swings: for the US and particularly China, their big industrial sectors use Silver in various processes; in India, consumers’ demand for the precious metal for jewellery also plays a key role in setting prices.
Silver prices tend to follow Gold’s moves. When Gold prices rise, Silver typically follows suit, as their status as safe-haven assets is similar. The Gold/Silver ratio, which shows the number of ounces of Silver needed to equal the value of one ounce of Gold, may help to determine the relative valuation between both metals. Some investors may consider a high ratio as an indicator that Silver is undervalued, or Gold is overvalued. On the contrary, a low ratio might suggest that Gold is undervalued relative to Silver.