The main tag of GoldPrice Articles.
You can use the search box below to find what you need.
[wd_asp id=1]
The main tag of GoldPrice Articles.
You can use the search box below to find what you need.
[wd_asp id=1]
Natural gas price continued its bullish rally to record 3.800$ level yesterday, approaching the major resistance to push it to form temporary negative rebound by fluctuating near 3.710$.
Note that the continuous fluctuation below the current resistance and stochastic exit from the overbought areas might increase the negative pressures on the price, to expect crawling towards 3.620$ level soon, followed by attempting to test the additional support at 3.520$.
The expected trading range for today is between 3.620$ and 3.830$
Trend forecast: Bearish
Silver price provides more bullish bias to approach the intraday bullish channel’s resistance line that appears on the chart, which meets the waited target at 32.86$, getting continuous positive support by the EMA50, to reinforce the chances of continuing the rise in the upcoming sessions.
For inquiries, Contact Us.
Spot Gold keeps grinding higher on Thursday, currently trading at around $2,920 a troy ounce. Financial markets turned optimistic in early Asia session amid hopes the conflict between Russia and Ukraine could come to an end with the intervention of the United States (US).
Risk appetite was further fueled by market talks pointing at US President Donald Trump announcing gradual tariffs later in the day. Trump imposed 25% tariffs on all steel and aluminium imports to the country at the beginning of the week and anticipated another round of levies to be announced later today. CNBC reported that such fresh tariffs would not come into effect today, adding that there would be a delay of “some months.”
Meanwhile, Trump announced through social media that he will give a news conference on reciprocal tariffs today at 13:00 EST or 18:00 GMT.
Data-wise, market players ignored higher-than-anticipated US Producer Price Index (PPI) data. Inflation at wholesale levels rose by 0.4% on a monthly basis in January, vs the 0.3% anticipated by market players. From a year earlier, the PPI was up 3.5% against expectations of a 3.2% advance. Initial Jobless Claims, on the other hand, rose by less than expected, up 213K in the week ended February 7. On Friday, the macroeconomic calendar will include January US Retail Sales.
The XAU/USD pair has recovered its bullish tone, posting a higher high and a higher low on a daily basis. The same chart shows technical indicators consolidate within overbought territory, somehow hinting at a corrective slide yet far from confirming it. Finally, the pair keeps developing above all its moving averages, with a bullish 20 Simple Moving Average (SMA) advancing beyond the 100 and 200 SMAs while providing mid-term dynamic support at around $2,808.30.
In the near term, and according to the 4-hour chart, the risk skews to the upside. The XAU/USD pair is finding intraday support at around a mildly bullish 20 SMA, currently at $2,904.60. The 100 and 200 SMAs, in the meantime, keep advancing far below the shorter one. Finally, technical indicators turned north within positive levels, favoring another leg north.
Support levels: 2,904.60 2,889.80 2,872.30
Resistance levels: 2,925.10 2,942.50 2,960.00
At 14:05 GMT, Natural Gas Futures are trading $3.733, up $0.168 or +4.71%.
Winter conditions remain a key driver of natural gas prices, with Arctic temperatures expected to persist across northern Europe and parts of the U.S. through late February. NatGasWeather forecasts “high” national demand in the coming week as frigid systems bring subzero temperatures across much of the interior U.S.
Meanwhile, today’s EIA report is expected to show a storage draw of 91-96 Bcf, significantly below the five-year average draw of 144 Bcf. Warmer-than-normal conditions in much of the U.S., excluding the northern regions, and stronger wind energy generation last week have contributed to a smaller-than-expected withdrawal. However, if the reported draw is larger than estimates, it could add further fuel to the current rally.
U.S. gas prices are also reacting to developments in the European market. Reports that the European Commission is considering a price cap to control energy costs have been met with opposition from energy industry groups, which warn of potential market instability.
In a separate development, European gas prices tumbled after reports that the U.S. and Russia have agreed to initiate peace talks regarding the war in Ukraine. A resolution could lead to increased Russian pipeline flows through Ukraine, potentially restoring Europe’s cost competitiveness to pre-crisis levels. Dutch TTF futures fell 6.3% following the news, after briefly trading above 58 euros per megawatt-hour earlier this week.
With cold weather sustaining demand and storage withdrawals tightening supplies, natural gas prices are positioned to climb further. If the market maintains its strength above $3.505, a move toward $4.020 is likely. However, traders should remain cautious, as natural gas markets tend to fade rallies quickly. A weaker-than-expected storage draw or a shift toward milder forecasts could trigger a reversal, bringing the 50-day moving average at $3.138 back into play.
Copper price returned to renew the bullish attempts after holding above 50% Fibonacci correction level at 4.5400$, to surpass 4.6900$ resistance line this morning and hint its preparation to resume the bullish attack by settling near 4.7100$.
The price needs to gather the additional positive momentum to manage to hold above the mentioned resistance and ease the mission of recording additional gains that might extend towards 4.8050$ and 4.8920$ levels soon.
The expected trading range for today is between 4.6500$ and 4.8050$
Trend forecast: Bullish
We use cookies to remember your site preferences, record your referrer, improve the performance of our site and to make any adverts we show on 3rd party sites more relevant. For more information, see our cookie policy.
Please select an option below and ‘Save’ your preferences.
Silver price (XAG/USD) holds onto gains near Wednesday’s high around $32.30 in Thursday’s European session. The white metal remains firm amid uncertainty that United States (US) President Donald Trump will announce reciprocal tariffs on Thursday.
The White House said on Wednesday that US President Donald Trump could announce his reciprocal tariff plan before he meets with Indian Prime Minister Narendra Modi on Thursday.
Such a scenario would deepen fears of a global trade war, which will boost the safe-haven appeal of precious metals, such as Silver.
In the election campaign, Trump said that he would implement a policy of “an eye for an eye, a tariff for a tariff, same exact amount.”
Meanwhile, the market sentiment is risk-on as leaders of Russia and Ukraine have agreed to peace talks after a three-year-long war. The Silver price had a strong rally when Russia and Ukraine entered a war.
Apart from the uncertainty over Trump’s tariffs, the Silver price clings to gains due to weakness in the US Dollar (USD). Risk-on market mood due to Russia-Ukraine peace talks has weighed heavily on the US Dollar, with the US Dollar Index (DXY) declining to near 107.50.
The US Dollar weakens even though the hot US Consumer Price Index (CPI) report for January has boosted expectations that the Federal Reserve (Fed) will keep interest rates in the current range of 4.25%-4.50% for longer. Technically, higher interest rates for longer bodes poorly for the Silver price.
Silver price continues to face pressure near the immediate resistance of $32.50, which is plotted from the December 9 high. The outlook of the white metal remains bullish as it holds above the 50-day Exponential Moving Average (EMA), which trades around $30.95.
The 14-day Relative Strength Index (RSI) falls back inside the 40.00-60.00 range, suggesting that the momentum is not bullish for now. However, the upside bias is intact.
Looking down, the upward-sloping trendline from the August 8 low of $26.45 will be the key support for the Silver price around $29.50. While, the October 31 high of $33.90 will be the key barrier.
Silver is a precious metal highly traded among investors. It has been historically used as a store of value and a medium of exchange. Although less popular than Gold, traders may turn to Silver to diversify their investment portfolio, for its intrinsic value or as a potential hedge during high-inflation periods. Investors can buy physical Silver, in coins or in bars, or trade it through vehicles such as Exchange Traded Funds, which track its price on international markets.
Silver prices can move due to a wide range of factors. Geopolitical instability or fears of a deep recession can make Silver price escalate due to its safe-haven status, although to a lesser extent than Gold’s. As a yieldless asset, Silver tends to rise with lower interest rates. Its moves also depend on how the US Dollar (USD) behaves as the asset is priced in dollars (XAG/USD). A strong Dollar tends to keep the price of Silver at bay, whereas a weaker Dollar is likely to propel prices up. Other factors such as investment demand, mining supply – Silver is much more abundant than Gold – and recycling rates can also affect prices.
Silver is widely used in industry, particularly in sectors such as electronics or solar energy, as it has one of the highest electric conductivity of all metals – more than Copper and Gold. A surge in demand can increase prices, while a decline tends to lower them. Dynamics in the US, Chinese and Indian economies can also contribute to price swings: for the US and particularly China, their big industrial sectors use Silver in various processes; in India, consumers’ demand for the precious metal for jewellery also plays a key role in setting prices.
Silver prices tend to follow Gold’s moves. When Gold prices rise, Silver typically follows suit, as their status as safe-haven assets is similar. The Gold/Silver ratio, which shows the number of ounces of Silver needed to equal the value of one ounce of Gold, may help to determine the relative valuation between both metals. Some investors may consider a high ratio as an indicator that Silver is undervalued, or Gold is overvalued. On the contrary, a low ratio might suggest that Gold is undervalued relative to Silver.
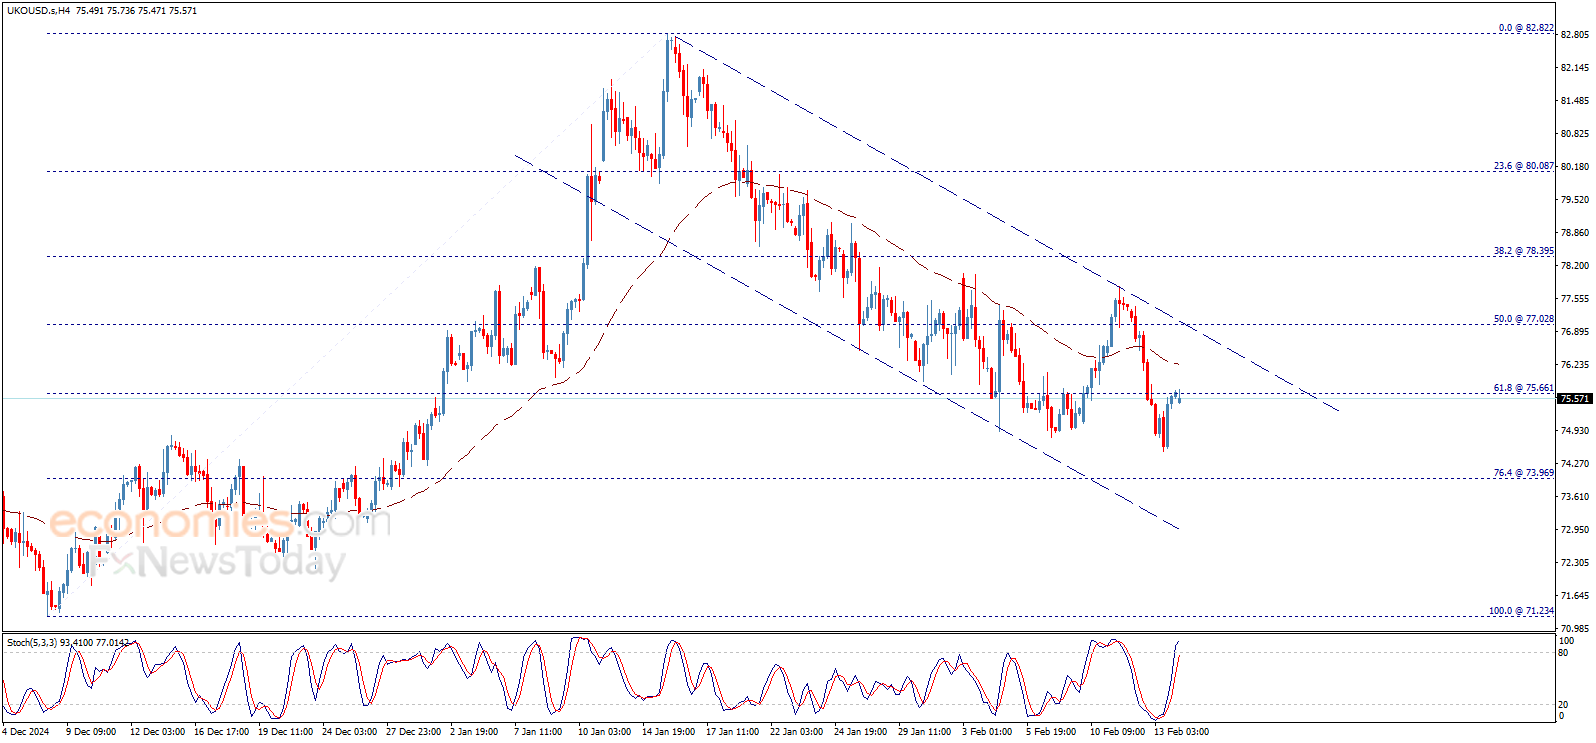
Crude oil price confirmed breaking 72.30$ level after closing yesterday below it, starting today with strong decline to head towards expected testing to 70.30$ level, noting that the price returns to the bearish channel that appears on the chart.
For inquiries, Contact Us.
Gold price is trying to hold above the $2,900-mark early Thursday, having witnessed intense volatility a day ago. The focus once again remains on the US fundamentals and US President Donald Trump’s tariff plans for a fresh boost to Gold prices.
White House noted late Wednesday that the earlier announced reciprocal tariffs by President Trump could come by on Thursday, keeping the haven demand for the traditional safety net – Gold price – intact.
However, Gold traders remain wary of creating additional bullish positions in the bright metal amid increased expectations that the Federal Reserve (Fed) could pause its easing trajectory until the third quarter of this year. The hotter-than-expected January US Consumer Price Index (CPI) data published on Wednesday reinforced the hawkish bets surrounding the Fed’s interest rates outlook.
The annual headline CPI increased 3% in January, up from 2.9% the previous month. The core inflation unexpectedly rose to 3.3% over the year in January versus December’s 3.2% growth. Speaking with US lawmakers Wednesday, Fed Chair Jerome Powell said the latest data show we’re close but not there on inflation, implying that the Fed is in no rush to cut rates further.
The Fed’s hawkishness triggered a sharp rally in the US Treasury bond yields on Wednesday, fuelling a steep decline in Gold price to near the $2,865 region. Gold buyers quickly jumped in on bargain hunting, lifting the yellow metal to settle back above $2,900. Gold is widely considered a hedge against inflation, which remains at the top of the market’s concerns.
Attention now turns toward the US Producer Price Index (PPI) data due later in Thursday’s American session for further cues on the Fed’s policy stance, which could influence the non-interest-bearing Gold price.
However, any downside in Gold price will likely remain cushioned as Trump’s reciprocal tariffs could raise tensions surrounding a potential trade war worldwide. The European Union (EU) will prioritize negotiations over retaliatory countermeasures to avoid a damaging trade war, officials signalled earlier on Wednesday.
Following a brief dip below the critical 21-four hourly Simple Moving Average (SMA), now at $2,897, Gold price managed to recapture the latter, fuelling a gradual recovery.
The Relative Strength Index (RSI) holds well above the midline, currently near 63.50, backing the upside potential.
The further recovery will need acceptance above the $2,910 round level on a four-hourly candlestick closing basis.
The next topside barrier is aligned at the record high of $2,943.
On the flip side, a four-hourly candlestick closing below the 21-four hourly SMA at $2,897 will reinforce the selling interest, calling for a test of the 50-four hourly SMA at $2,866.
The last line of defense for Gold buyers is the 100-four hourly SMA at $2,816.
Tariffs are customs duties levied on certain merchandise imports or a category of products. Tariffs are designed to help local producers and manufacturers be more competitive in the market by providing a price advantage over similar goods that can be imported. Tariffs are widely used as tools of protectionism, along with trade barriers and import quotas.
Although tariffs and taxes both generate government revenue to fund public goods and services, they have several distinctions. Tariffs are prepaid at the port of entry, while taxes are paid at the time of purchase. Taxes are imposed on individual taxpayers and businesses, while tariffs are paid by importers.
There are two schools of thought among economists regarding the usage of tariffs. While some argue that tariffs are necessary to protect domestic industries and address trade imbalances, others see them as a harmful tool that could potentially drive prices higher over the long term and lead to a damaging trade war by encouraging tit-for-tat tariffs.
During the run-up to the presidential election in November 2024, Donald Trump made it clear that he intends to use tariffs to support the US economy and American producers. In 2024, Mexico, China and Canada accounted for 42% of total US imports. In this period, Mexico stood out as the top exporter with $466.6 billion, according to the US Census Bureau. Hence, Trump wants to focus on these three nations when imposing tariffs. He also plans to use the revenue generated through tariffs to lower personal income taxes.
Campbell Soup Company’s stock price (CPB) rose in the intraday levels, buoyed by positive signals from the RSI as the price tries to retest the resistance of $37.94, while recouping some recent losses, amid the dominance of the main downward trend in the short term, with negative pressure due to trading below the 50-day SMA.
Therefore we expect the price to return lower, provided it settles firmly below the resistance of $37.94, thus targeting the support of $33.90.
Trend forecast for today: Likely Bearish