The main tag of GoldPrice Articles.
You can use the search box below to find what you need.
[wd_asp id=1]
The main tag of GoldPrice Articles.
You can use the search box below to find what you need.
[wd_asp id=1]
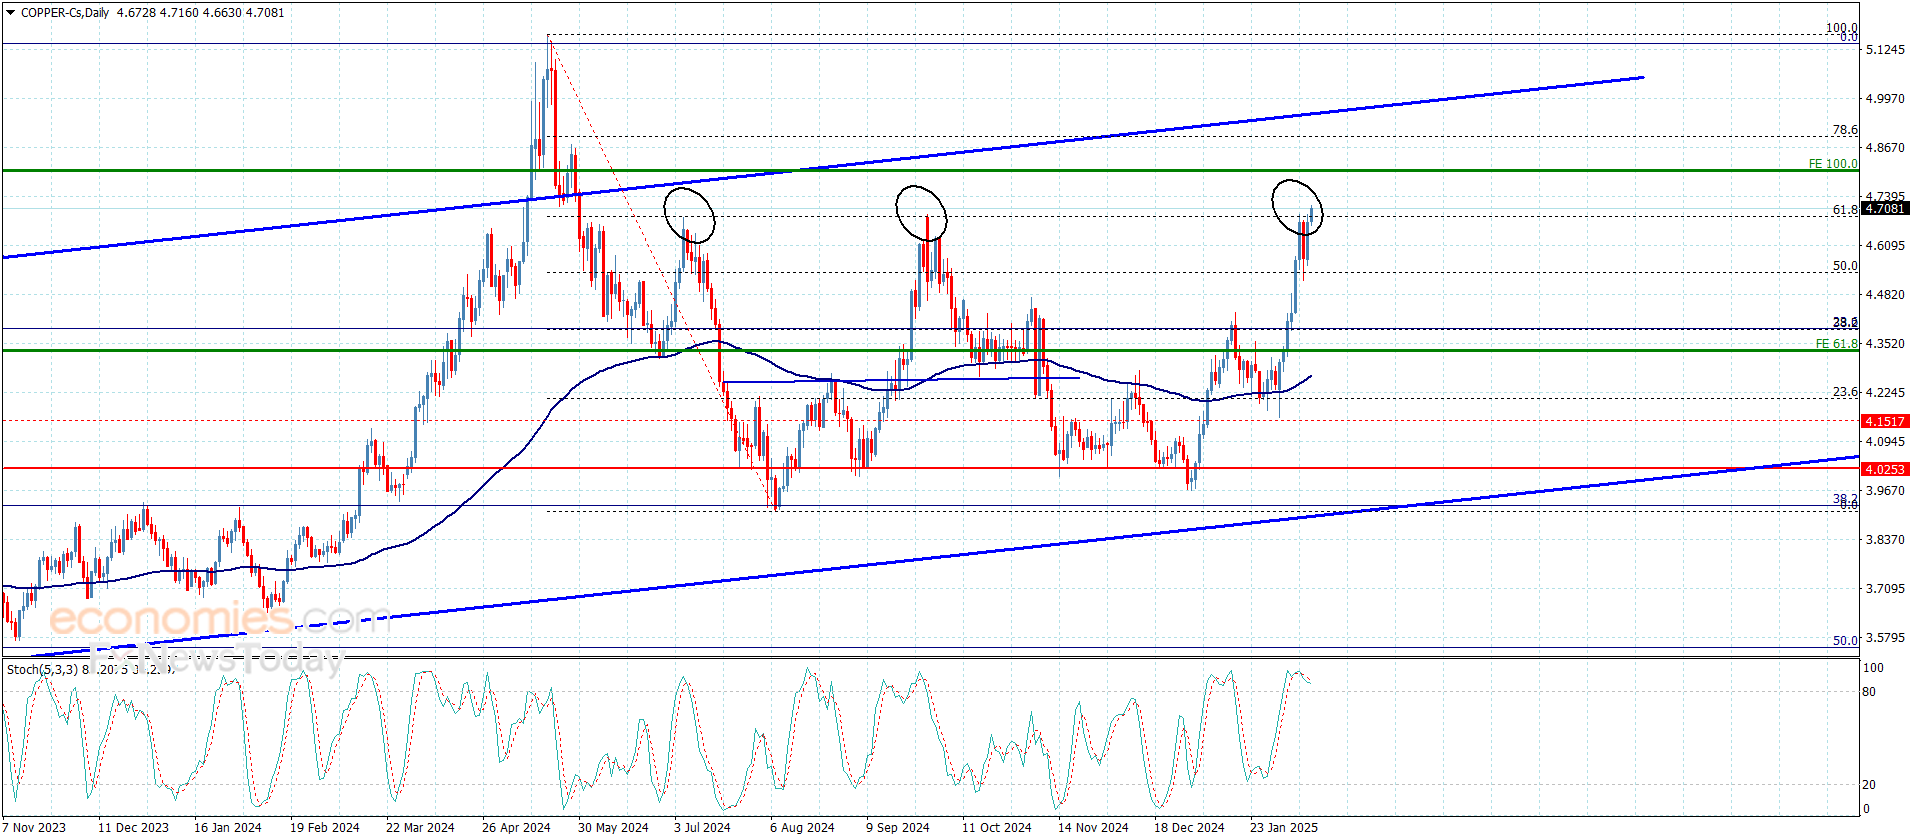
Copper price returned to renew the bullish attempts after holding above 50% Fibonacci correction level at 4.5400$, to surpass 4.6900$ resistance line this morning and hint its preparation to resume the bullish attack by settling near 4.7100$.
The price needs to gather the additional positive momentum to manage to hold above the mentioned resistance and ease the mission of recording additional gains that might extend towards 4.8050$ and 4.8920$ levels soon.
The expected trading range for today is between 4.6500$ and 4.8050$
Trend forecast: Bullish
The GBPJPY pair continued to form strong bullish trades, taking advantage of the frequent stability above 189.70 level that formed key support against the bullish attempts, to notice surpassing the first additional target at 192.30 and approach 50% Fibonacci correction level at 193.30 as a next station for the current trades.
Also, stochastic reach to 80 level confirms providing the additional positive momentum to increase the chances of surpassing 193.30 level soon to manage to record additional gains that might start at 193.60 and 194.20 levels.
The expected trading range for today is between 191.80 and 193.60
Trend forecast: Bullish
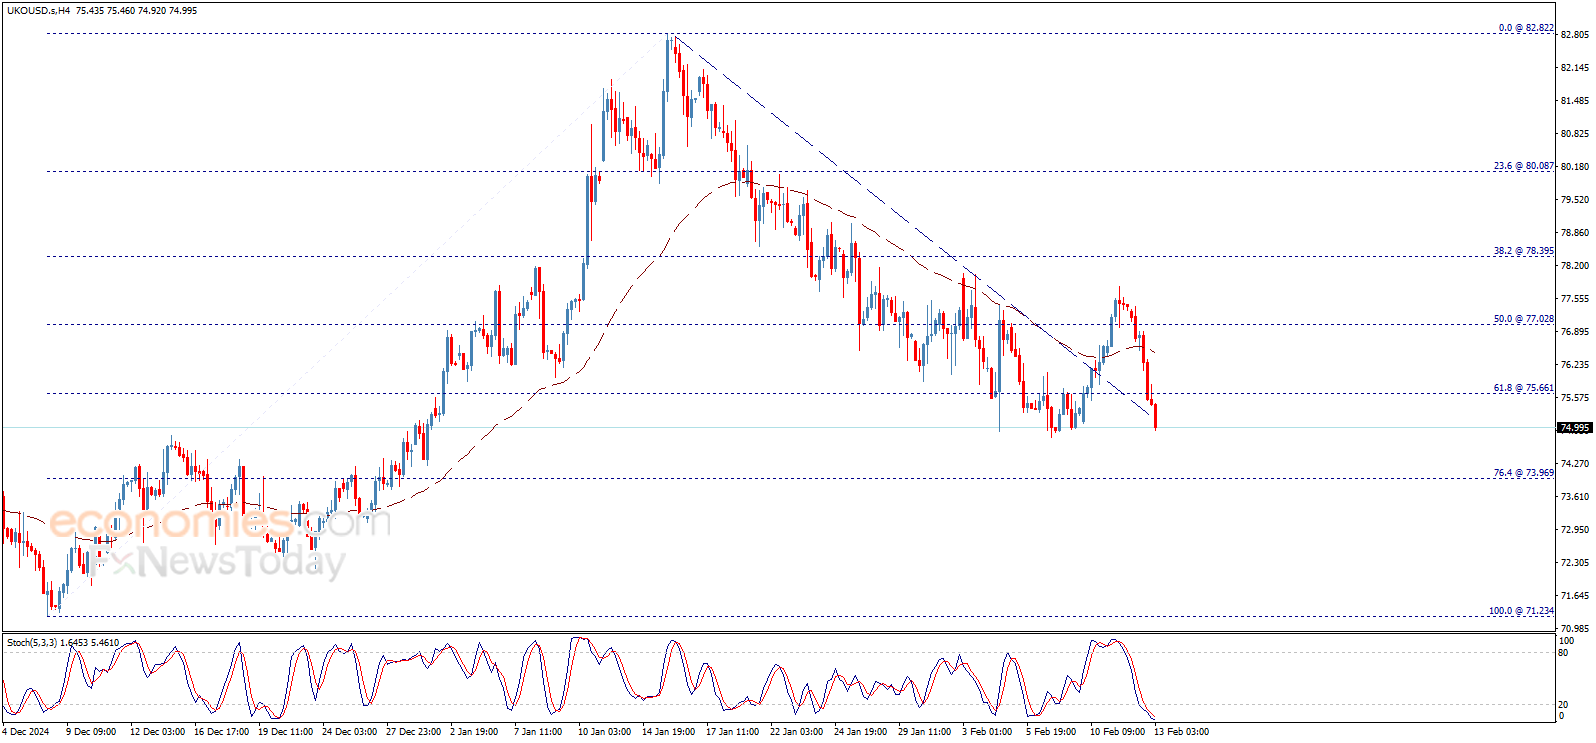
Crude oil price confirmed breaking 72.30$ level after closing yesterday below it, starting today with strong decline to head towards expected testing to 70.30$ level, noting that the price returns to the bearish channel that appears on the chart.
For inquiries, Contact Us.
Although today’s decline triggered a breakdown below Tuesday’s bearish shooting star candlestick pattern, the bullish reaction today may negate that signal. Nonetheless, near-term price levels look relatively clear. Today’s low of $2,864 is short term support. If broken to the downside the trendline will also have failed to retain support and lower prices become targets.
This week’s low at $2,853 is a key price level as it is part of a series of six consecutive weeks of higher weekly highs and higher weekly lows. A change in that bullish weekly pattern may provide a clue to That bullish pattern may begin to change once that pattern starts to change.
On the upside, a breakout above today’s high of $2,909 will show strength, but Monday’s high of $2,912 should also be considered. It was resistance on Monday, which had the highest historical closing price at $2,907. Tuesday’s record high in gold was $2,943.
The advance completed a couple targets there were derived from Fibonacci extension and projection targets. Therefore, resistance was seen in a price area that could lead to a pullback. Nonetheless, if the $2,943 high is exceeded higher targets start with $2,961, followed by $2,982.
Furthermore, notice that there is a trendline across the top of a large parallel trend channel. The line was confirmed with the recent swing high at $2,790. It also shows the possibility of higher prices if Tuesday’s high can be exceeded.
Silver price ended yesterday above 31.63$ level and the negative pressure that it witnessed in the previous sessions, to keep the bullish trend scenario active for the upcoming period, organized inside the bullish channel that appears on the chart, supported by the EMA50 that carries the price from below.
For inquiries, Contact Us.
A daily close above the 50-Day line is bullish and may provide a clue that indicates further underlying strength in the price of natural gas. Also, the 38.2% Fibonacci retracement level at $3.51 was exceeded for the second time today and a strong close above that price level looks likely. However, today’s rise was the first test of resistance around the 20-Day MA since the drop below it on January 27. Resistance has been seen but whether it can be sustained remains to be seen. Given the signs of underlying strength, a reclaim of the 20-Day MA may be possible before a pullback.
If the 20-Day MA can be reclaimed, the next higher target zone is from around $3.64 to $3.69. That price zone consists of the prior swing high and peak for 2023 at $3.64, a 50% retracement level at $3.67, and a 127.2% extended target for a small rising ABCD pattern (not shown). The initial target for the ABCD pattern was completed at $3.58.
Now that the 20-Day line has fallen to converge with the $3.58, the $3.58 price zone takes on greater potential significance. Since a breakout above the 2023 high of $3.64 provided a new bullish trend reversal signal for the long-term trend in late-December, it is a key price level. A rise above it would be bullish, and especially a daily close above it.
Last week’s price range and likely this week as well are within the price range from two weeks ago from $2.99 to $3.83. Since the low end of the price range was tested as support with last week’s low, an upswing to test resistance near the week’s high could be in process.
For a look at all of today’s economic events, check out our economic calendar.
Home Depot’s stock price (HD) rose in the intraday levels, after leaning on the support of the 50-day SMA, lending the stock positive momentum, amid the dominance of the main upward trend, while trading alongside the secondary short-term trend line, with positive signals from the RSI after reaching oversold levels.
Therefore we expect more gains for the stock, targeting the pivotal resistance of $440.97, provided the support of $401.76 holds on.
Trend forecast for today: Bullish
Spot Gold recovered from an intraday low of $2,863.61 and trades above the $2,900 mark in the mid-American session. Financial markets are quite volatile in the second half of the day after multiple key headlines coming from the United States (US).
On the one hand, the country released the Consumer Price Index (CPI), which rose by 3.0% in January compared to a year earlier. The core annual reading printed at 3.3% vs. the expected 3.1%, while, on a monthly basis, the CPI rose 0.5%, higher than the 0.4% posted in December. All figures were above expectations, immediately triggering demand for the safe-haven US Dollar (USD) amid speculation the US Federal Reserve (Fed) will further delay any potential interest rate cut.
The XAU/USD pair fell to the aforementioned low, yet the slide was limited amid Gold’s safe-haven condition. The pair recovered as Fed Chairman Jerome Powell testified before Congress. Powell tried to put things back in balance by noting that the economy is “close, but not there” on inflation. Additionally, he repeated that the central bank makes its decisions based on the economy’s performance. Finally, he said that policymakers want to keep the monetary policy restrictive for now while acknowledging that it is possible officials will have to move the policy rate on tariffs.
Somehow, Wall Street managed to reverse part of its early losses with Powell, putting pressure on the USD and helping XAU/USD recover its bullish pose.
From a technical point of view, the daily chart for XAU/USD shows overbought conditions persist, yet there are no clear signs of an upcoming slide. Technical indicators have turned flat within extreme levels and even aim marginally higher. At the same time, XAU/USD develops far above all its moving averages, with the 20 Simple Moving Average (SMA) heading firmly north at around $2,798.00 while far above the 100 and 200 SMAs.
In the near term, and according to the 4-hour chart, Gold is bullish. XAU/USD is advancing, breaking above a bullish 20 SMA, while the intraday dip has stalled far above a bullish 100 SMA. The Momentum indicator pared it slide around its 100 line but holds around it. However, the Relative Strength Index (RSI) indicator has already changed course and aims north at around 59, supporting another leg north.
Support levels: 2,883.50 2,872.30 2,855.45
Resistance levels: 2,911.60 2,925.00 2,940.00
Important DisclaimersThe content provided on the website includes general news and publications, our personal analysis and opinions, and contents provided by third parties, which are intended for educational and research purposes only. It does not constitute, and should not be read as, any recommendation or advice to take any action whatsoever, including to make any investment or buy any product. When making any financial decision, you should perform your own due diligence checks, apply your own discretion and consult your competent advisors. The content of the website is not personally directed to you, and we does not take into account your financial situation or needs.The information contained in this website is not necessarily provided in real-time nor is it necessarily accurate. Prices provided herein may be provided by market makers and not by exchanges.Any trading or other financial decision you make shall be at your full responsibility, and you must not rely on any information provided through the website. FX Empire does not provide any warranty regarding any of the information contained in the website, and shall bear no responsibility for any trading losses you might incur as a result of using any information contained in the website.The website may include advertisements and other promotional contents, and FX Empire may receive compensation from third parties in connection with the content. FX Empire does not endorse any third party or recommends using any third party’s services, and does not assume responsibility for your use of any such third party’s website or services.FX Empire and its employees, officers, subsidiaries and associates, are not liable nor shall they be held liable for any loss or damage resulting from your use of the website or reliance on the information provided on this website.Risk DisclaimersThis website includes information about cryptocurrencies, contracts for difference (CFDs) and other financial instruments, and about brokers, exchanges and other entities trading in such instruments. Both cryptocurrencies and CFDs are complex instruments and come with a high risk of losing money. You should carefully consider whether you understand how these instruments work and whether you can afford to take the high risk of losing your money.FX Empire encourages you to perform your own research before making any investment decision, and to avoid investing in any financial instrument which you do not fully understand how it works and what are the risks involved.
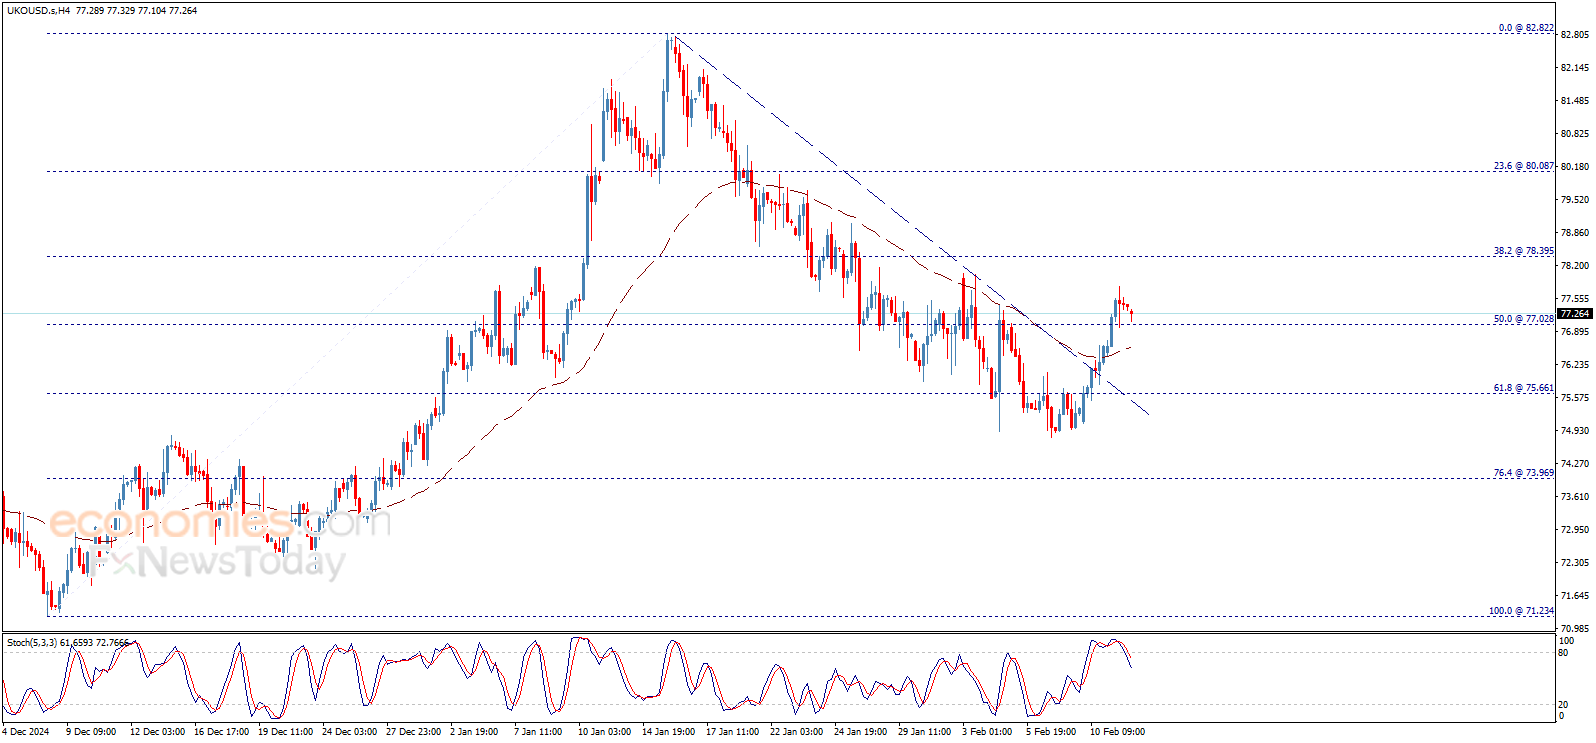
Crude oil price succeeded to achieve our waited target at 73.90$ and found solid resistance there, to show some bearish bias and head towards potential retest to the breached resistance of the bearish channel that appears on the chart, and the EMA50 meets the breached resistance to add more strength to the support line formed there.
For inquiries, Contact Us.