The main tag of GoldPrice Articles.
You can use the search box below to find what you need.
[wd_asp id=1]
The main tag of GoldPrice Articles.
You can use the search box below to find what you need.
[wd_asp id=1]
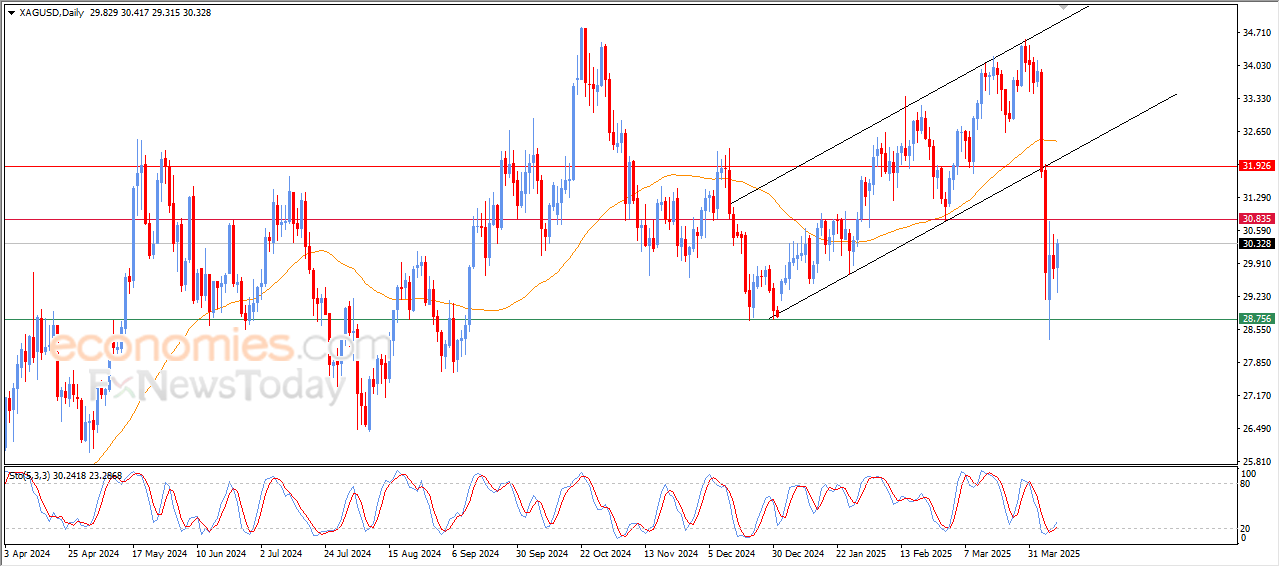
Silver price (XAG/USD) continues to climb for the second straight day, trading near $31.10 per troy ounce during Thursday’s Asian session. The grey metal surged nearly 4% in the previous session, fueled by renewed safe-haven demand following escalating US-China trade tensions.
US President Donald Trump announced an immediate hike in tariffs on Chinese imports to 125%, shortly after China raised reciprocal duties on US goods to 84%. This tit-for-tat escalation overshadowed a broader trade de-escalation effort, where the US had temporarily lowered tariffs to 10% for 90 days to facilitate negotiations with other countries.
Meanwhile, markets are digesting the latest Federal Open Market Committee (FOMC) minutes, which suggested near-unanimous concern among policymakers over the dual threat of rising inflation and slowing growth—highlighting potential “difficult tradeoffs” for the Fed.
The non-yielding Silver metal may attract fresh buying interest following the release of China’sthat Consumer Price Index (CPI) data, which reinforces dovish expectations for the People’s Bank of China (PBoC) policy outlook. China’s CPI fell 0.1% year-over-year in March, missing forecasts of a 0.1% rise and following a 0.7% drop in February. On a monthly basis, CPI declined 0.4%, steeper than both February’s 0.2% decrease and market expectations. Additionally, the Producer Price Index (PPI) slipped 2.5% year-over-year, exceeding the previous 2.2% drop and the projected 2.3% decline, signaling continued deflationary pressures in the economy.
Despite intensifying trade frictions, Fed officials emphasized a data-dependent approach to policy. The CME FedWatch tool shows that markets are currently pricing in a 40% chance of a rate cut at next month’s meeting. Investors now turn their attention to upcoming US CPI and PPI data on Friday for further clarity on the Fed’s rate path.
Silver is a precious metal highly traded among investors. It has been historically used as a store of value and a medium of exchange. Although less popular than Gold, traders may turn to Silver to diversify their investment portfolio, for its intrinsic value or as a potential hedge during high-inflation periods. Investors can buy physical Silver, in coins or in bars, or trade it through vehicles such as Exchange Traded Funds, which track its price on international markets.
Silver prices can move due to a wide range of factors. Geopolitical instability or fears of a deep recession can make Silver price escalate due to its safe-haven status, although to a lesser extent than Gold’s. As a yieldless asset, Silver tends to rise with lower interest rates. Its moves also depend on how the US Dollar (USD) behaves as the asset is priced in dollars (XAG/USD). A strong Dollar tends to keep the price of Silver at bay, whereas a weaker Dollar is likely to propel prices up. Other factors such as investment demand, mining supply – Silver is much more abundant than Gold – and recycling rates can also affect prices.
Silver is widely used in industry, particularly in sectors such as electronics or solar energy, as it has one of the highest electric conductivity of all metals – more than Copper and Gold. A surge in demand can increase prices, while a decline tends to lower them. Dynamics in the US, Chinese and Indian economies can also contribute to price swings: for the US and particularly China, their big industrial sectors use Silver in various processes; in India, consumers’ demand for the precious metal for jewellery also plays a key role in setting prices.
Silver prices tend to follow Gold’s moves. When Gold prices rise, Silver typically follows suit, as their status as safe-haven assets is similar. The Gold/Silver ratio, which shows the number of ounces of Silver needed to equal the value of one ounce of Gold, may help to determine the relative valuation between both metals. Some investors may consider a high ratio as an indicator that Silver is undervalued, or Gold is overvalued. On the contrary, a low ratio might suggest that Gold is undervalued relative to Silver.
Gold price is biding time near $3,100 in Asian trading on Thursday, gathering strength for the next push higher. The further upside in the Gold price depends on the upcoming US Consumer Price Index (CPI) data.
Despite the latest pause in the Gold price turnaround, the US-China trade war escalation will likely keep the demand for safe havens such as Gold intact. The tit-for-tat game for the US and China is just getting bigger, with Beijing preparing to deepen the China-EU trade, indirectly taking aim at American companies, per the Wall Street Journal (WSJ).
This report came after US President Donald Trump announced on Wednesday a 90-day ‘pause’ on reciprocal tariffs of 10% for all countries except for China. Trump raised the tariff rate for China to 125%, effective immediately.
Earlier on Wednesday, Beijing hit back at Trump’s 104% tariffs with its own additional tariffs of 84%, up from the previous 34%, on all American goods. Amidst tariff headlines still driving markets, investors continue to remain unnerved and prefer to hold on to the traditional store of value, Gold, heading toward the US CPI inflation showdown.
Increased expectations that the Trump-inflicted global trade war would cause higher inflation and tip the economy into recession keep the odds for aggressive interest rate cuts by the Federal Reserve (Fed) elevated. Dovish Fed bets remain supportive of the Gold price upside.
Therefore, it remains to be seen if the US March CPI report signals rising inflationary pressures, calling for the Fed’s prudence on future rate cuts. The non-interest-bearing Gold price will likely resume its corrective downside in such a scenario. However, any reaction to the US CPI data could be short-lived as tariff headlines will continue to play a pivotal role.
The US CPI is expected to rise 2.6% annually in March after increasing 2.8% in February. The core CPI inflation is seen a tad lower at 3% in the same period versus February’s 3.1%. On a monthly basis, the CPI and core CPI are forecast to rise 0.1% and 0.3%, respectively, in March.
The technical setup on the daily time frame favors Gold buyers, with the 14-day Relative Strength Index (RSI) holding firm above the midline, currently near 60.
On Wednesday, Gold price settled above the 21-day Simple Moving Average (SMA), then at $3,036, breaking out of this week’s range and opening the door for more upside.
Softer-than-expected US CPI readings would ramp up odds for a May Fed rate cut, bolstering the Gold price recovery to test the $3,150 psychological barrier.
The record high of $3,168 will be next on buyers’ radars, above which the $3,200 round level will be challenged.
If the US inflation data comes in hotter-than-expected, it would imply another pause by the Fed next month, smashing the yieldless Gold.
Gold price could find immediate respite at the 21-day SMA resistance-turned-support, now at $3,048.
Additional declines could threaten the $3,000 mark, below which a test of the 50-day SMA at $2,960 will be inevitable.
Inflationary or deflationary tendencies are measured by periodically summing the prices of a basket of representative goods and services and presenting the data as The Consumer Price Index (CPI). CPI data is compiled on a monthly basis and released by the US Department of Labor Statistics. The YoY reading compares the prices of goods in the reference month to the same month a year earlier.The CPI is a key indicator to measure inflation and changes in purchasing trends. Generally speaking, a high reading is seen as bullish for the US Dollar (USD), while a low reading is seen as bearish.
Platinum price continued forming the bullish correctional trading, surpassing the obstacle at $920.00, to begin recording some of the gains by reaching $930.00, getting advantage from the continuation of the positive momentum that come from stochastic, which approaches from 50 level.
Reminding you that the bullish suggestion on the current trading will remain valid, depending on the stability of the support at $895.00, to expect reaching 50%Fibonacci correction level at $950.00, and surpassing it will lead the price to test the resistance at $961.00
The expected trading range for today is between $920.00 and $950.00
Trend forecast: Bullish
There’s quite a few countries out there that have been tariffing the United States 20, 30, 40 % for decades. So really it does more or less kind of just somewhat even the playing field. It’s not aggressive. It’s something that producers of various goods around the world can absorb.

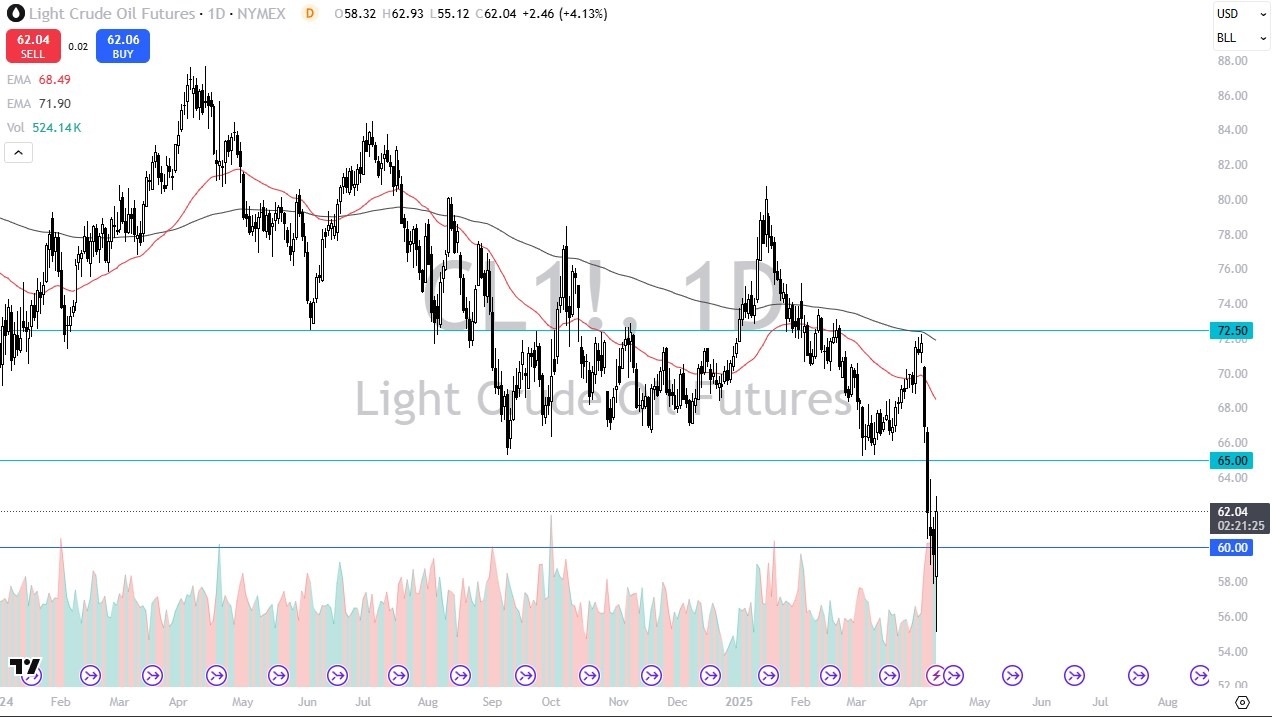
That being said, it’s worth noting that we are above the $60 level, but we are giving back some of the gains. And I think the process here is going to be extraordinarily noisy. The $65 level above is a massive barrier. If we could break that, it would be a huge win for the bulls. But right now, I don’t think we’re anywhere near that. I think we’re probably closer to a situation where we’re trying to form some type of basing pattern that is higher than we hit overnight. But we also have to worry about China and their reaction to the now 125 % tariffs on their goods, because during the day Amazon, and I’m starting to hear a little bit of chatter from Walmart as well, are canceling orders from China. This is a big deal. This means things just got a little uglier. Chinese banks have been ordered not to buy US dollars. Good luck with that. There’s no way to pay international debts without them. So, things are going to get very interesting very quick.
With that being said, there is a certain amount of concern about the overall global demand. If China slips into a recession and the US slips into a recession, everybody feels it. So, I think this is still a market that you would want to at least think about being bearish on, but you might want to get out of the way of trying to short it. A range between $60 and $65 does make a certain amount of sense, but you need stability before you start putting money to work.
Ready to trade daily crude oil price analysis? We’ve shortlisted the best Forex Oil trading brokers in the industry for you.
Goldman Sachs has slashed its oil prices forecasts again and now expects Brent Crude to average below $60 per barrel next year, at $58, amid recession risks, slowing demand, and more supply from the OPEC+ producers.
The investment bank had previously forecasted oil demand growth at 600,000 barrels per day (bpd) this year but now it sees the growth at half this figure, at 300,000 bpd.
Higher risks of recessions and higher-than-expected OPEC+ production prompted Goldman Sachs to slash again its oil price forecasts for 2026, days after it had already cut its price outlook in the wake of the U.S. tariffs announcement last week.
Goldman Sachs’s analysts issued a new note dated April 6, in which they slashed their 2026 oil price forecasts by $4 per barrel to $58 for Brent Crude prices and to $55 for the U.S. benchmark, WTI Crude.
On Friday, Goldman Sachs cut its oil price forecast for 2025 by 5.5 per cent for Brent crude and by 4.3 per cent for West Texas Intermediate, citing the OPEC+ decision to boost production in May and the tariff barrage that President Trump unleashed. The bank also revised down its 2026 Brent crude forecast by 9 per cent to $62 per barrel and its 2026 WTI forecast by 6.3 per cent to $59 per barrel.
Two days later, Goldman Sachs slashed the forecasts again and now expects Brent Crude to average below $60 per barrel next year, at $58, amid recession risks, slowing demand, and more supply from the OPEC+ producers.
The investment bank had previously forecasted oil demand growth at 600,000 barrels per day (bpd) this year. Now it sees the growth at half this figure, at 300,000 bpd.
There is a chance of oil prices rising from current levels if the U.S. backs down from the tariffs, according to the bank.
“Oil prices would likely exceed our forecast if the Administration were to reverse tariffs sharply and deliver a reassuring message to markets, consumers, and businesses, Goldman’s analysts wrote in the April 6 note carried by Reuters.
Goldman Sachs last week raised recession odds to 45 per cent over the next 12 months, up from a 35 per cent chance of a recession estimated previously. Goldman’s analysts cited “a sharp tightening in financial conditions, foreign consumer boycotts, and a continued spike in policy uncertainty that is likely to depress capital spending by more than we had previously assumed.”
We’ve got the edge. Get real-time reports, breaking scoops, and exclusive angles delivered straight to your phone. Don’t settle for stale news. Join LEADERSHIP NEWS on WhatsApp for 24/7 updates →
Spot Gold resumed its bullish run after a brief consolidating phase, trading a handful of bucks below the $3,100 mark in the American session, up roughly $100 on the day amid returning risk-aversion. The escalation of the trade war, particularly between the United States (US) and China. Following US President Trump’s decision to double levies on the Asian giant to a whopping 104%, Beijing announced retaliatory tariffs of 84%.
Back-and-forth announcements finally took their toll on financial markets, and fears returned. Investors are concerned about a potential US recession alongside economic setbacks among major economies. Market participants are also worried about upward inflationary pressures coming with widespread import taxes, and how those could affect central banks’ upcoming monetary policy decisions.
Meanwhile, the Federal Open Market Committee is about to release the Minutes from the March meeting. Given the latest tariffs’ developments, the document could be considered old news and have a limited impact on the US Dollar (USD). Nevertheless, the document may shed additional light on policymakers’ thinking.
Back in March, the Summary of Economic Projections (SEP) showed Chair Jerome Powell and co are in no rush to move interest rates amid increased fiscal and political uncertainty. The Federal Reserve (Fed) is expected to trim rates by modest 50 basis points (bps) this year, with increased doubts about such moves given mounting trading tensions.
From a technical point of view, XAU/USD is poised to retest record highs in the $3,160 region. The daily chart for the pair shows technical indicators advancing within positive levels, with sharp bullish slopes. At the same time, the pair recovered above a bullish 20 Simple Moving Average (SMA) currently at around $3,044. Finally, the 100 and 200 SMAs keep heading firmly higher, far below the shorter one, in line with the dominant bullish trend.
The near-term picture also favors another leg higher, although given the intraday advance, Gold may consolidate or even correct lower before resuming gains. Still, the 4-hour chart shows XAU/USD stands above all its moving averages, which, anyway, lack directional strength. At the same time, technical indicators have turned flat near their intraday highs, and well above their midlines, suggesting absent selling interest.
Support levels: 3,078.30 3,062.90 3,051.10
Resistance levels: 3,105.00 3,122.85 3,136.50
Generally speaking, a trade war is an economic conflict between two or more countries due to extreme protectionism on one end. It implies the creation of trade barriers, such as tariffs, which result in counter-barriers, escalating import costs, and hence the cost of living.
An economic conflict between the United States (US) and China began early in 2018, when President Donald Trump set trade barriers on China, claiming unfair commercial practices and intellectual property theft from the Asian giant. China took retaliatory action, imposing tariffs on multiple US goods, such as automobiles and soybeans. Tensions escalated until the two countries signed the US-China Phase One trade deal in January 2020. The agreement required structural reforms and other changes to China’s economic and trade regime and pretended to restore stability and trust between the two nations. However, the Coronavirus pandemic took the focus out of the conflict. Yet, it is worth mentioning that President Joe Biden, who took office after Trump, kept tariffs in place and even added some additional levies.
The return of Donald Trump to the White House as the 47th US President has sparked a fresh wave of tensions between the two countries. During the 2024 election campaign, Trump pledged to impose 60% tariffs on China once he returned to office, which he did on January 20, 2025. With Trump back, the US-China trade war is meant to resume where it was left, with tit-for-tat policies affecting the global economic landscape amid disruptions in global supply chains, resulting in a reduction in spending, particularly investment, and directly feeding into the Consumer Price Index inflation.
tariff
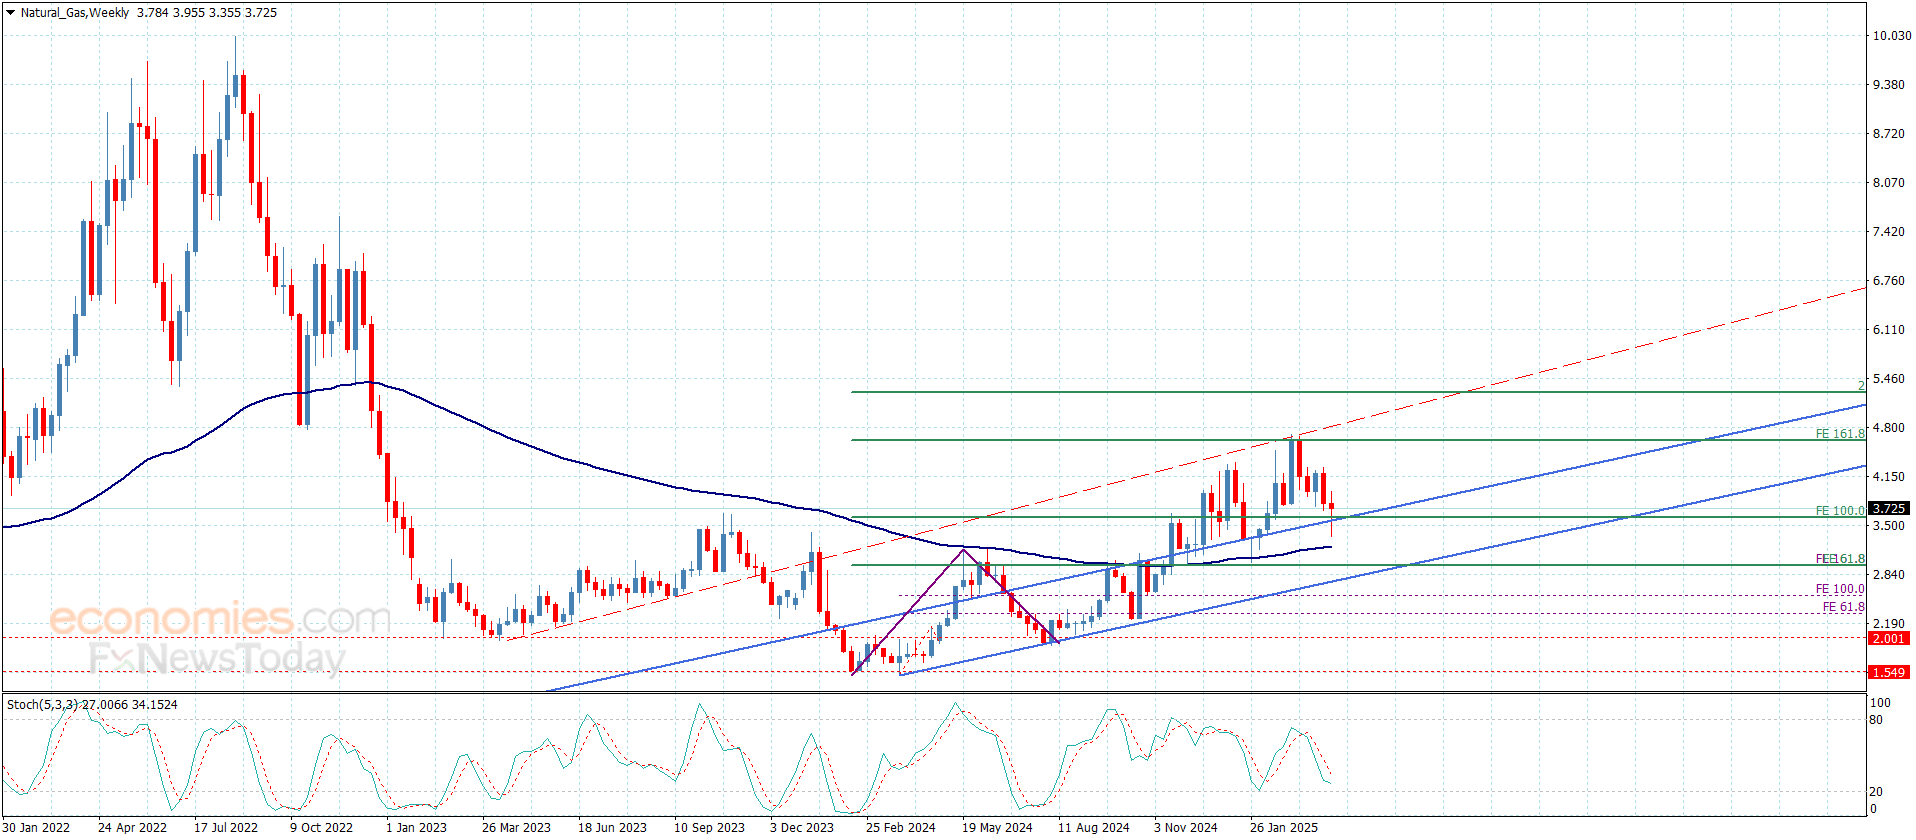
The day’s high of $3.83 attempted to test the 50-Day MA as resistance following a daily close below line last Friday. Although the recovery above the trendline is positive, the 50-Day line needs to be reclaimed if natural gas is going to have a chance to further strengthen. There is also the 20-Day MA that is a little higher at $3.94. Since the 20-Day line is falling there is the potential for it to drop below the 50-Day line. That would be a bearish sign if it is sustained.
Since natural gas recovered the trendline in less than two days, and it followed a retracement to a key 78.6% retracement level, an eventual advance to test resistance around the downtrend line seems likely, at a minimum. Notice that support was found yesterday at the lower channel line, and it was again tested today with a brief undercut of the lower channel.
Moreover, although the middle line (dashed) of the channel was exceeded today, natural gas may close at or slightly below that line. If it does so, it will be the second day that the middle line was recognized. Notice that Tuesday’s low found support at the lower end of the channel.
Until there is a daily close above the 20-Day MA and the top falling trendline, there remains the possibility that bearish correction has not completed, and further tests of lows could occur. Another drop below the trendline would indicate that it was not successfully tested as support, reflecting continued underlying downward pressure.
For a look at all of today’s economic events, check out our economic calendar.
Coffee price began gathering its gains by activating the bearish correctional track after breaking 370.65, to notice its decline towards 338.20, to settle below the moving average 55.
Stochastic reach to the oversold level will increase the negative pressures, which makes us prefer targeting extra negative stations that might begin at 332.00 and 326.30 before any attempt to regain the bullish track.
The expected trading range for today is between 332.00 and 355.10
Trend forecast: Bearish
To get our more detailed analysis and 100% accurate signals provided by Best Trading Signal, subscribe to Economies.com VIP Club through the link below!
The price of Ethereum (ETHUSD) has risen during its recent intraday trading, following the stability of the support level at $1,404, which has provided some positive momentum. This momentum aims to recover part of the previous losses and get rid of its clear oversold conditions indicated by the Relative Strength Index (RSI), especially that positive signals begin to emerge, accompanied with the domination of the main bearish trend.
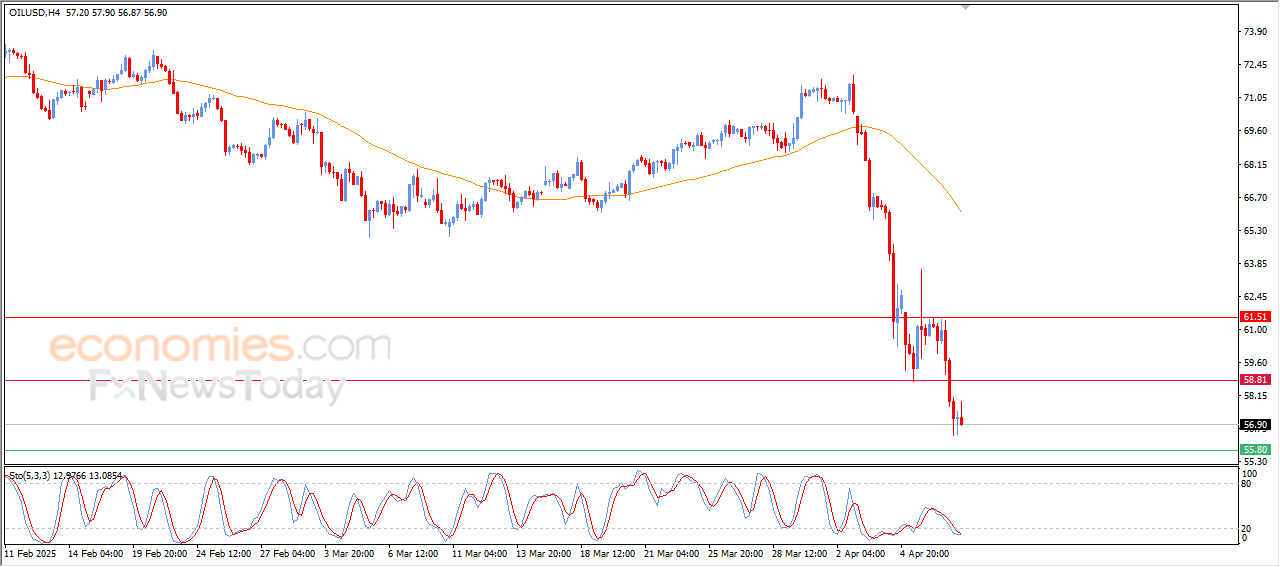
Crude oil prices: Following Donald Trump’s tariffs uncertainty and Saudi Arabia’s rate cuts, crude oil prices dropped to more than four years low on Wednesday. WTI crude oil price oscillates around the $57.70 mark, logging an intraday loss of nearly 3.20% during early morning deals in the Asian stock market. Brent futures lost $2.13, or 3.39%, to $60.69 a barrel as of 0108 GMT. US West Texas Intermediate crude futures fell $2.36, or 3.96%, to $57.22. Brent reached its lowest point in March 2021, and WTI reached its lowest in February 2021. Crude oil futures contract for April expiry on the Multi Commodity Exchange (MCX) crashed 1.78% or ₹94 per barrel on Tuesday and closed at ₹5,199 per barrel.
Both benchmarks have tumbled over the five consecutive sessions since US President Donald Trump announced sweeping tariffs on most imports, sparking concerns that a global trade war would dent economic growth and hit fuel demand. The US will impose a 104% tariff on China from 12:01 a.m. EDT (0401 GMT) on Wednesday, a White House official said in a Tuesday briefing. The tariffs will increase by 50% after Beijing failed to lift its retaliatory tariffs on US goods by a noon deadline on Tuesday set by Trump.
According to commodity market experts, crude oil prices have crashed due to demand concerns fuelled by an escalating tariff war between the US and China and rate cuts announced by Saudi Arabia. They said that crude oil prices might continue to trade red and touch the $52 per barrel mark, whereas, in the domestic market, crude oil prices may test the ₹5,025 per barrel mark on MCX.
Speaking on the reasons that are dragging crude oil prices across bourses, Anuj Gupta, Head — Commodity & Currency at HDFC Securities, said, “Oil prices fell sharply to an over four-year low in Asian trade on Wednesday as signs of a rapidly escalating US-China trade war sparked heightened concerns over a recession and weaker demand.” He said Saudi Arabia’s announcement to increase output and decrease oil prices is also a significant reason for nosediving crude oil prices.
“China’s aggressive retaliation diminishes the chances of a quick deal between the world’s two biggest economies, triggering mounting fears of global economic recession,” said Ye Lin, vice president of oil commodity markets at Rystad Energy.
“China’s 50,000 bpd to 100,000 bpd of oil demand growth is at risk if the trade war continues for longer. However, a stronger stimulus to boost domestic consumption could mitigate the losses,” she said.
Exacerbating oil’s decline was OPEC’s decision last week, which groups together the Organization of the Petroleum Exporting Countries and allies, including Russia, to hike output in May by 411,000 barrels per day. Analysts say this move is likely to push the market into surplus.
Goldman Sachs now forecasts that Brent and WTI could edge down to $62 and $58 per barrel by December 2025 and to $55 and $51 per barrel by December 2026.
Anuj Gupta of HDFC Securities said, “Crude oil prices are expected to remain under pressure. They may touch $52 per barrel in the international market, whereas they may test the ₹5,025 per barrel mark on the MCX. One should look at short positions on every rise as oil prices face hurdles at $62 per barrel in the international market and ₹5,380 per barrel on the MCX.”
(With inputs from Reuters)
Disclaimer: The views and recommendations made above are those of individual analysts or broking companies, and not of Mint. We advise investors to check with certified experts before making any investment decisions.