The main tag of GoldPrice Articles.
You can use the search box below to find what you need.
[wd_asp id=1]
The main tag of GoldPrice Articles.
You can use the search box below to find what you need.
[wd_asp id=1]
Ethereum price (ETHUSD) finds difficulty to hold above 2764.75$, to move below it now, noticing that stochastic gathers the positive momentum to support the chances to rise in the upcoming sessions and surpass the mentioned level again.
Therefore, we expect to witness positive trades today, and the price needs to breach 2764.75$ resistance to confirm heading towards 3017.30$ that represents our next main target, taking into consideration that failing to breach the mentioned resistance will put the price under additional negative pressure that its targets begin by testing 2480.00$ areas.
The expected trading range for today is between 2580.00$ support and 2890.00$ resistance.
Trend forecast: Bullish
Spot Gold’s rally to record highs continued on Wednesday, with XAU/USD trading as high as $2,882.34 during American trading hours. As it has been happening these days, demand for safety prevails amid mounting concerns related to United States (US) President Donald Trump’s tariffs. At the same time, the US Dollar (USD) has lost its attractiveness, with stock markets recovering and investors digesting the latest US data.
The latest US macroeconomic figures showed a solid labor market and softer-than-anticipated economic progress. On the one hand, the ADP Employment Change report showed that the private sector added 183,000 new jobs in January, better than the 150,000 anticipated by market players and above the 122,000 gained in December.
On the other hand, the January ISM Services Purchasing Managers’ Index (PMI) rose by 52.8, below the 54 posted in December and the expected 54.3. Other details of the report showed that the Prices Paid Index, the inflation component, dropped to 60.4 from 64.4, while the Employment Index edged higher to 52.3 from 51.3.
Meanwhile, Wall Street struggles to extend its recent recovery. Most Asian and European indexes closed in the green, but among US indexes, only the Dow Jones Industrial Average (DJIA) is up.
From a technical point of view, the daily chart for XAU/USD shows that the bullish momentum prevails despite overbought conditions, as technical indicators keep aiming north despite developing at extreme levels. At the same time, the pair advanced further above bullish moving averages, with the 20 Simple Moving Average (SMA) heading sharply higher at around $2,750.
In the near term, and according to the 4-hour chart, the risk skews to the upside. Technical indicators have resumed their advances within overbought levels and after a limited retracement, suggesting buyers are still willing to add on dips. Finally, XAU/USD develops far above all bullish moving averages, with the shorter 20 SMA at around $2,825.
Support levels: 2,857.80 2,845.30 2,829.10
Resistance levels: 2,883.00 2,900.00 2,915.00
Tariffs are customs duties levied on certain merchandise imports or a category of products. Tariffs are designed to help local producers and manufacturers be more competitive in the market by providing a price advantage over similar goods that can be imported. Tariffs are widely used as tools of protectionism, along with trade barriers and import quotas.
Although tariffs and taxes both generate government revenue to fund public goods and services, they have several distinctions. Tariffs are prepaid at the port of entry, while taxes are paid at the time of purchase. Taxes are imposed on individual taxpayers and businesses, while tariffs are paid by importers.
There are two schools of thought among economists regarding the usage of tariffs. While some argue that tariffs are necessary to protect domestic industries and address trade imbalances, others see them as a harmful tool that could potentially drive prices higher over the long term and lead to a damaging trade war by encouraging tit-for-tat tariffs.
During the run-up to the presidential election in November 2024, Donald Trump made it clear that he intends to use tariffs to support the US economy and American producers. In 2024, Mexico, China and Canada accounted for 42% of total US imports. In this period, Mexico stood out as the top exporter with $466.6 billion, according to the US Census Bureau. Hence, Trump wants to focus on these three nations when imposing tariffs. He also plans to use the revenue generated through tariffs to lower personal income taxes.
Short-term resistance is at today’s high of $3.37 and support was at the low of the day, at $3.16. Despite the minor bullish indication from today’s price action, further consolidation within the day’s range is also possible. If the low of the day is broken to the downside, there is the possibility of a gap filling at $3.12. A rising trendline can also be watched for signs of support if recent lows are retested.
It is interesting to note that this week’s low, that was hit today, successfully found support around the 20-Week MA (not shown), which is $3.15. Notably, natural gas fell below the 20-Week MA last week and closed below it on a weekly basis. That was bearish price behavior. But the reclaim of the 20-Week line this week countered with bullish indications.
Therefore, support around $3.15 needs to continue to hold to confirm the bullish posture. Staying above the 20-Week line will provide another piece of bullish evidence, increasing the chance for a continuation of the bounce from last week’s low of $2.99. Regardless, natural gas is likely to complete this week as an inside week given last week’s wide trading range from $2.99 to $3.83.
A decisive breakout above Wednesday’s high of $3.37 points to higher targets for natural gas. The 50-Day MA at $3.52 is the next upside target where resistance may be seen. It is confirmed by the 38.2% Fibonacci retracement at $3.51. Since the 50-Day line had been dynamic support for the rising trend previously, until last Tuesday, there is a strong chance it will be tested as resistance at a minimum.
For a look at all of today’s economic events, check out our economic calendar.
Affirm Holdings’ stock price (AFRM) slid in the intraday levels, amid negative pressure from trading below the 50-day SMA, with negative signals from the RSI after reaching overbought levels, as the stock tries to shake off these negative pressures, amid the dominance of the main upward trend, while trading alongside the secondary short-term trend line.
Therefore we expect the stock to return higher, targeting the pivotal resistance of $72.82, provided the support of $52.48 holds on.
Trend forecast for today: Likely Bullish
Silver price (XAG/USD) surrenders almost its entire intraday gains and falls back to near $32.00 in Wednesday’s North American session. The white metal faces selling pressure as the US Dollar (USD) attempts to gain ground on the back of upbeat United States (US) ADP Employment Change data for January. The US Dollar Index (DXY), which tracks the Greenback’s value against six major currencies, finds buyers’ demand near 107.40 but is still over 0.4% down intraday.
The agency reported that 183K new workers were hired by the private sector last month, which were significantly higher than estimates of 150K, and the prior release of 176K, revised significantly higher from 122K.
Signs of strong labor demand would force Federal Reserve (Fed) officials to keep interest rates at their current levels for longer. Last week, Fed Chair Jerome Powell said that they will make monetary policy adjustments only after seeing “real progress in inflation or at least some weakness in labor market”. Technically, the Fed’s stance for keeping interest rates steady weighs on precious metals, such as Silver.
Meanwhile, investors are also doubting the Silver outlook amid receding fears of a lethal global trade war. Market participants expect the trade war to remain restricted between China and the US. Investors have interpreted President Donald trump’s tariff agenda as more a negotiating tool after his decision of suspending the order of imposing 25% tariffs on Canada and Mexico.
While 10% tariffs on China have come into effect from February, and in retaliation, China has also imposed levies on the US.
Silver price strives to break above the immediate resistance of $32.50, which is plotted from the December 9 high. The outlook of the white metal remains bullish as the 20-day Exponential Moving Average (EMA) is sloping higher near $30.90.
The 14-day Relative Strength Index (RSI) oscillates in the 60.00-80.00 range, suggesting that the momentum is bullish.
Looking down, the upward-sloping trendline from the August 8 low of $26.45 will be the key support for the Silver price around $29.50. While, the October 31 high of $33.90 will be the key barrier.
Silver is a precious metal highly traded among investors. It has been historically used as a store of value and a medium of exchange. Although less popular than Gold, traders may turn to Silver to diversify their investment portfolio, for its intrinsic value or as a potential hedge during high-inflation periods. Investors can buy physical Silver, in coins or in bars, or trade it through vehicles such as Exchange Traded Funds, which track its price on international markets.
Silver prices can move due to a wide range of factors. Geopolitical instability or fears of a deep recession can make Silver price escalate due to its safe-haven status, although to a lesser extent than Gold’s. As a yieldless asset, Silver tends to rise with lower interest rates. Its moves also depend on how the US Dollar (USD) behaves as the asset is priced in dollars (XAG/USD). A strong Dollar tends to keep the price of Silver at bay, whereas a weaker Dollar is likely to propel prices up. Other factors such as investment demand, mining supply – Silver is much more abundant than Gold – and recycling rates can also affect prices.
Silver is widely used in industry, particularly in sectors such as electronics or solar energy, as it has one of the highest electric conductivity of all metals – more than Copper and Gold. A surge in demand can increase prices, while a decline tends to lower them. Dynamics in the US, Chinese and Indian economies can also contribute to price swings: for the US and particularly China, their big industrial sectors use Silver in various processes; in India, consumers’ demand for the precious metal for jewellery also plays a key role in setting prices.
Silver prices tend to follow Gold’s moves. When Gold prices rise, Silver typically follows suit, as their status as safe-haven assets is similar. The Gold/Silver ratio, which shows the number of ounces of Silver needed to equal the value of one ounce of Gold, may help to determine the relative valuation between both metals. Some investors may consider a high ratio as an indicator that Silver is undervalued, or Gold is overvalued. On the contrary, a low ratio might suggest that Gold is undervalued relative to Silver.
Brent oil price crawls downwards calmly, and the technical indicators keep providing the negative signals, waiting for more decline to test 75.66$ initially, reminding you that breaking this level will push the price towards 74.00$ as a next target.
In general, the bearish trend scenario will remain valid and active for today unless the price rallied to breach 77.05$ and hold above it.
The expected trading range for today is between 74.90$ support and 77.90$ resistance.
Trend forecast: Bearish
Gold price is holding the record-setting rally early Wednesday, hanging close to the levels seen ever near $2,850. Traders gear up for the upcoming US private sector employment data and US-China trade talks for Gold price action.
The buying interest around the traditional store of value, the Gold price, remains unabated so far this week, courtesy of the growing uncertainties over US President Donald Trump’s tariff policies and their impact on the global growth and inflation outlook.
The Trump administration’s tariff pushback on Canada and Mexico for a month and the US-Sino trade war keep investors on edge, especially with Chinese traders returning after a week-long Lunar New Year holiday.
A mixed set of US economic data releases in the ISM Manufacturing PMI and the Jobs Openings survey help maintain the bets for two US Federal Reserve (Fed) interest rate cuts this year even as Fed policymakers express caution on further rate cuts. This remains supportive of the non-interest-bearing Gold price.
However, the Gold price could face a headwind in the near term if the US succeeds in ending the Israel-Hamas geopolitical conflict. Israeli Prime Minister Benjamin Netanyahu and Trump met on Tuesday at the White House and discussed the elimination of Hamas, Iran strategy and renewed Israel-Saudi normalization.
The 47th American President, however, expressed uncertainty on whether the ceasefire deal between Hamas and Israel will hold. “ Gold tends to benefit in times of geopolitical instability and market turmoil.
Looking ahead, the impending trade talks between US President Donald Trump and his Chinese counterpart Xi Jinping are eagerly awaited. White House spokeswoman Karoline Leavitt told reporters that a Trump-Xi call still needed to be scheduled. “President Xi did reach out to President Trump to speak about this, maybe to begin a negotiation. So we’ll see how that call goes,” Leavitt told Fox Business Network earlier on Tuesday.
In the meantime, the US employment data might reclaim the spotlight, given the increasing uncertainty around the Fed’s scope and timing of interest rate cuts. The US ADP Employment Change is seen arriving at 150K in January after registering 122K in December. Later in American trading, the US ISM Services PMI data will also offer fresh trading impetus, followed by speeches from Fed policymakers Austan Goolsbee and Michelle Bowman.
Gold price remains at the mercy of the US Dollar (USD) dynamics amid a cautious market environment heading into the US data releases.
The daily chart warrants caution for Gold optimists as the 14-day Relative Strength Index (RSI) remains within the overbought territory, currently near 75.
If buyers face exhaustion, a pullback could be in the offing before the uptrend resumes.
If a correction sets in, Gold price could challenge the $2,800 round level, below which the February 3 low of $2,772 will be tested.
Additional declines will put the January 30 low of $2,754 at risk. The last line of defense for buyers is seen at the 21-day SMA at $2,731.
However, the 50-day Simple Moving Average (SMA) and 100-day SMA Bull Cross keep hopes alive for buyers.
On the upside, the Gold price needs a daily candlestick closing above the $2,850 psychological level to refresh record highs near $2,880 en route to the $3,000 round level.
The ADP Employment Change is a gauge of employment in the private sector released by the largest payroll processor in the US, Automatic Data Processing Inc. It measures the change in the number of people privately employed in the US. Generally speaking, a rise in the indicator has positive implications for consumer spending and is stimulative of economic growth. So a high reading is traditionally seen as bullish for the US Dollar (USD), while a low reading is seen as bearish.
Next release: Wed Feb 05, 2025 13:15
Frequency: Monthly
Consensus: 150K
Previous: 122K
Source: ADP Research Institute
As global concerns about trade tensions escalate—especially after the United States imposed tariffs on Canada, Mexico, and China, with the European Union on the way—investors are turning to the precious metal as a hedge against inflation and economic uncertainty
The massive surge in gold prices since the beginning of this year reflects the bullish market movement dominating the precious metal since March 2024, driven by several key factors that lead investors to view gold as a safe haven
One of the main reasons for this market is the global monetary easing cycle we have witnessed recently, as many central banks have significantly lowered interest rates to stimulate their local economies
These easing measures, which boost the global economy, make gold—an asset that does not yield fixed returns—more attractive to investors looking to protect their capital
Furthermore, escalating global geopolitical tensions contribute to increased demand for gold, as investors worry about political and economic uncertainty on a worldwide scale
Consequently, speculations are growing about the possibility of prices reaching the $3,000 per ounce mark in the near term, as instability continues and investors flock to safe-haven assets
Will this upward market continue? And what factors might push gold to unprecedented levels? In this report, we review the key drivers affecting gold prices and future forecasts for the precious metal in light of current economic and trade developments
After returning to the White House, President Donald Trump began implementing his protectionist trade policies, as promised during his campaign, aiming to reduce the trade deficit and boost domestic manufacturing
One of his most prominent campaign promises was to impose new tariffs of up to 60% on Chinese imports, in an attempt to force Beijing into making trade concessions and protect American industries
He also threatens to impose a 10% global tariff on all imported goods, under the pretext of bolstering domestic production and reducing reliance on foreign sources
In addition, Trump intends to renegotiate several trade agreements that he deems insufficiently beneficial to the United States, and he may use economic pressure on allies to secure more favorable terms
It is also expected that the new American administration will continue targeting companies that relocate their production abroad with new taxes and sanctions
However, these policies may lead to an escalation of trade tensions with major countries such as China and the European Union, which could spark fears of rising prices and inflation within the United States
Overall, Trump’s second administration has reshaped American trade policy with a more aggressive approach, one that will boost domestic manufacturing but may have significant repercussions on the global economy
As promised by President Donald Trump last month, the United States imposed a 25% tariff on Canada and Mexico starting Tuesday, February 4
White House officials stated that there would be no exceptions to these tariffs
During his campaign, Donald Trump vowed to impose comprehensive tariffs abroad as part of an expansive plan to reshape the American economy and its relationships with other countries
However, during the first two weeks of his term, his threats sparked uncertainty as some leaders believed his threats were merely a negotiating tactic
These rapidly escalating trade conflicts represent the most aggressive protectionist move by an American president in nearly a century, leading to widespread selling in global financial markets amid potential repercussions on inflation rates, geopolitical dynamics, and global economic growth
At the last moment, President Donald Trump suspended his threat on Monday, February 3, agreeing to a 30-day grace period in exchange for Canada and Mexico committing to concessions on illegal immigration and drug trafficking
Both Canadian Prime Minister Justin Trudeau and Mexican President Claudia Sheinbaum announced their agreement to enhance border protection efforts in response to Trump’s demands for stringent measures to curb illegal immigration and drug smuggling
With the implementation of a 10% tariff on China starting Tuesday, Beijing retaliated by imposing its own tariffs on certain American imports, further intensifying trade tensions between the world’s two largest economies
The Chinese Ministry of Finance announced tariffs of 15% on American coal and liquefied natural gas, 10% on crude oil, and on agricultural equipment, as well as on a limited number of imported trucks and large-engine sedans
The Chinese Ministry of Commerce and Customs Administration also reported imposing export restrictions on certain critical minerals used in electronics, military equipment, and solar panels
Separately, the National Market Regulation Administration stated that China would cooperate with the American tech giant Google over alleged antitrust violations
During his first term in 2018, Trump launched a fierce two-year trade war with China, targeting its massive trade surplus with the United States, which led to global supply chain disruptions and significant damage to the global economy
In an attempt to end the dispute, China agreed in 2020 to increase its annual purchases of American goods by $200 billion, but the implementation of the agreement was hindered by the COVID-19 pandemic, further exacerbating China’s annual trade deficit with the United States
In a new escalation, Trump warned that tariffs could be raised further if China did not take effective measures to stop the flow of fentanyl, stating, “I hope China stops sending fentanyl to us, or tariffs will skyrocket”; while China labeled fentanyl as “an American problem” and promised countermeasures
Major central banks in the United States, Europe, the United Kingdom, Canada, Switzerland, and Mexico continue their cycle of monetary easing and interest rate cuts, resulting in new liquidity injections into the markets.
Market experts say that in the medium term there is clear optimism for stocks, residential real estate, gold, and even cryptocurrencies thanks to the global monetary easing cycle.
Robert Kiyosaki, author of “Rich Dad, Poor Dad,” wrote on platform X that he expects gold to reach $3,300 per ounce following Trump’s victory in the U.S. presidential election.
Kiyosaki explained that Donald Trump wants a weak U.S. dollar to boost exports, create jobs, and open new factories, which will drive gold prices up from $2,800 to $3,300 per ounce before the end of 2025.
Citibank Group stated: We expect gold to reach $3,000 per ounce within the next six months.
Gold, which retains its value as a hedge against inflation, tends to perform well during times of economic uncertainty when investors steer away from riskier assets like stocks.
Gold bullion prices hit an all-time high of $2,860.67 per ounce on Wednesday, February 5, 2025.
By the end of 2024, spot gold prices rose by more than 27%, marking the second consecutive annual gain and the largest annual gain since 2010, driven by the generosity of global central banks and geopolitical tensions.
Gold prices usually have an inverse relationship with interest rates; as rates decline, gold becomes more attractive compared to fixed income assets like bonds.
China and India typically compete for the title of the world’s largest gold buyer, but this scenario changed last year as Chinese consumption of jewelry, bullion, and coins reached record levels. Demand for gold jewelry in China increased by 10% while demand in India fell by 6%, and Chinese investments in bullion and coins surged by 28%.
The Indian government reduced import duties on gold and silver to 6% from 15% last year, improving actual demand forecasts and supporting jewelry manufacturing in the world’s second-largest consumer of gold bullion
Gold is trading around $2,800 per ounce, and in light of forecasts indicating a bullish market in 2025, we believe that levels between $2,750 and $2,700 are suitable for investment, with a long-term target above $3,000 per ounce
Gold can be invested in several ways:
In light of recent developments in global markets and the economic and trade risks, it is entirely possible for gold prices to rise to $3,000 per ounce this year, with the potential to hit new historic levels if strong industrial and investment demand factors materialize
Yes, most major institutions and banks forecast that the precious metal will continue its upward trajectory this year, setting new record highs
Analysts and experts advise closely monitoring political and economic developments, and diversifying investment portfolios to include gold as part of a risk-hedging strategy
Gold is resuming its long-term upward trend after the recent temporary downward correction experienced in recent weeks. After testing the $2536.00 levels, the price rebounded, setting new historical records up to the time of writing this report.
A range of positive technical factors supports the continuation of the upward trend across various timeframes. On the weekly chart, based on Fibonacci extension levels of the last downward wave, the price appears poised to reach the next key level of $2946.00 and needs to hold above the support level at around $2790.00 to confirm the ongoing bullish trend.
On the daily chart, the price is moving within an ascending channel that has been in place since the beginning of Q4 2023. After bouncing off its support last month, the price resumes its upward movement toward an expected resistance level of $2980.00 in the channel.
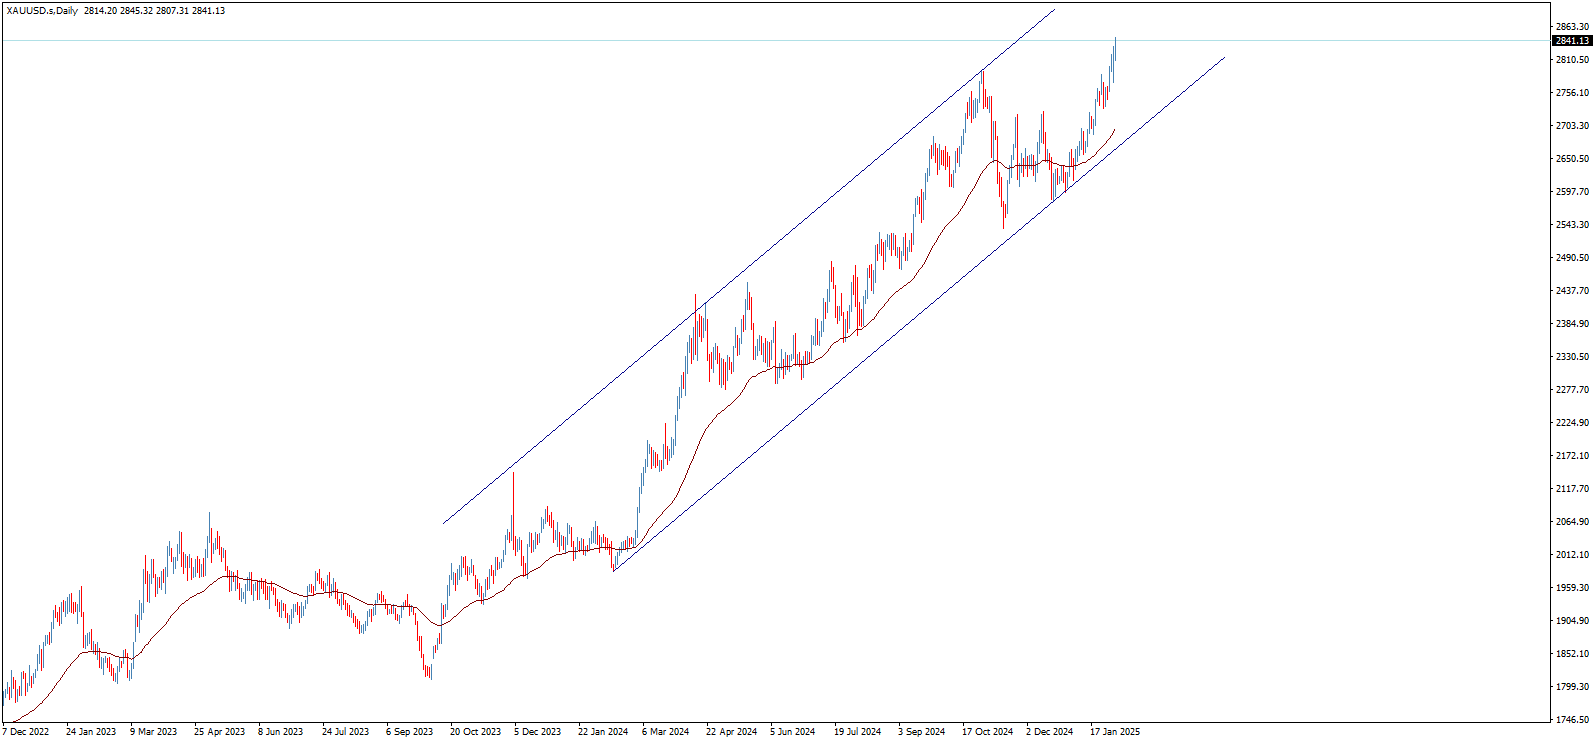
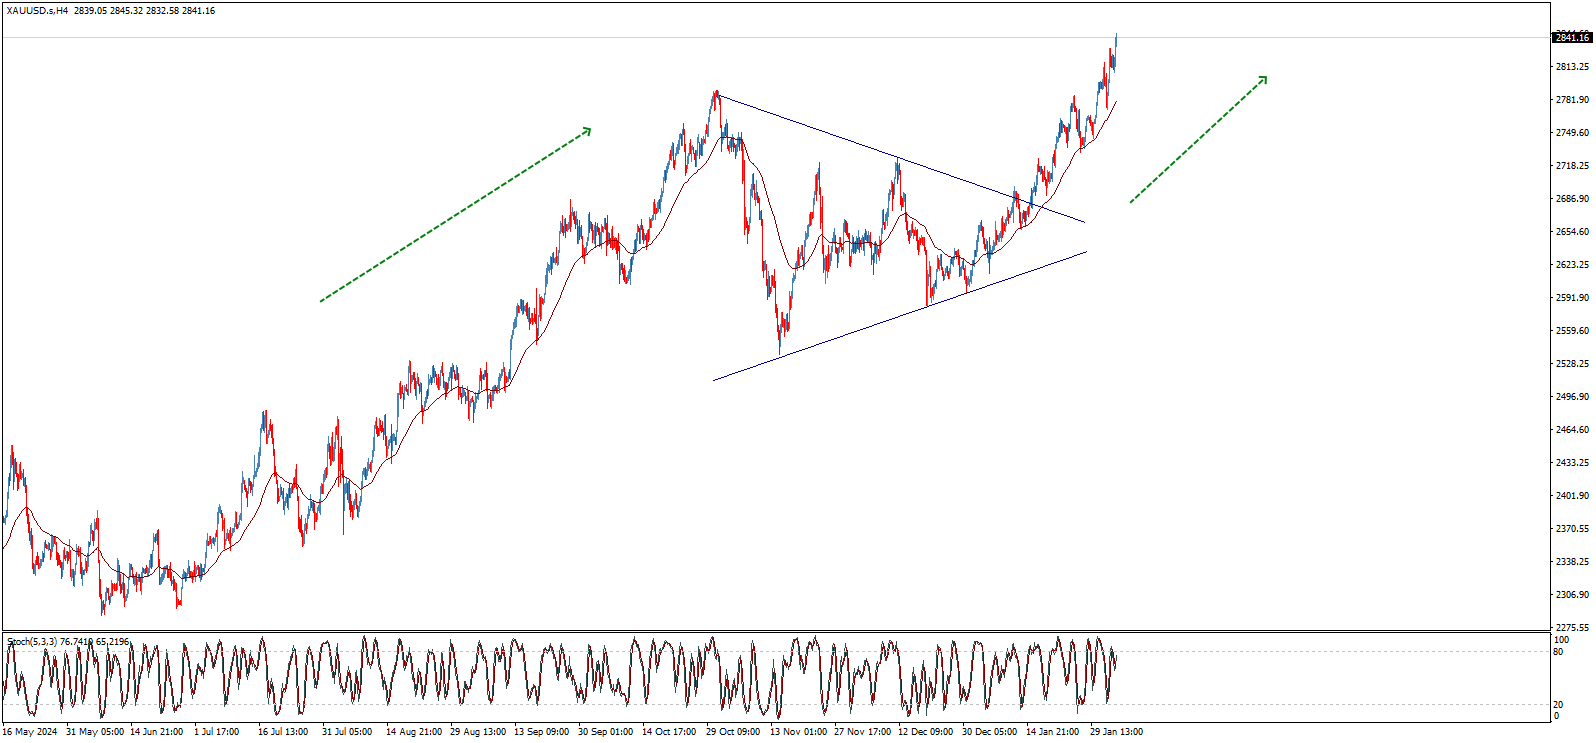
Another positive catalyst in recent trading was the breakthrough of a symmetrical triangle pattern, which is considered a key to resuming the main upward trend and achieving the proposed targets, along with the positive support provided by the 50-day moving average for short- to medium-term trading.
Looking at the instantaneous timeframes, we notice another ascending channel that carries the latest upward wave, where the current test of its resistance level requires caution in upcoming trading, as failure to break through the $2845.00 zone may force a pullback to test the channel’s support around $2786.00 before another recovery.
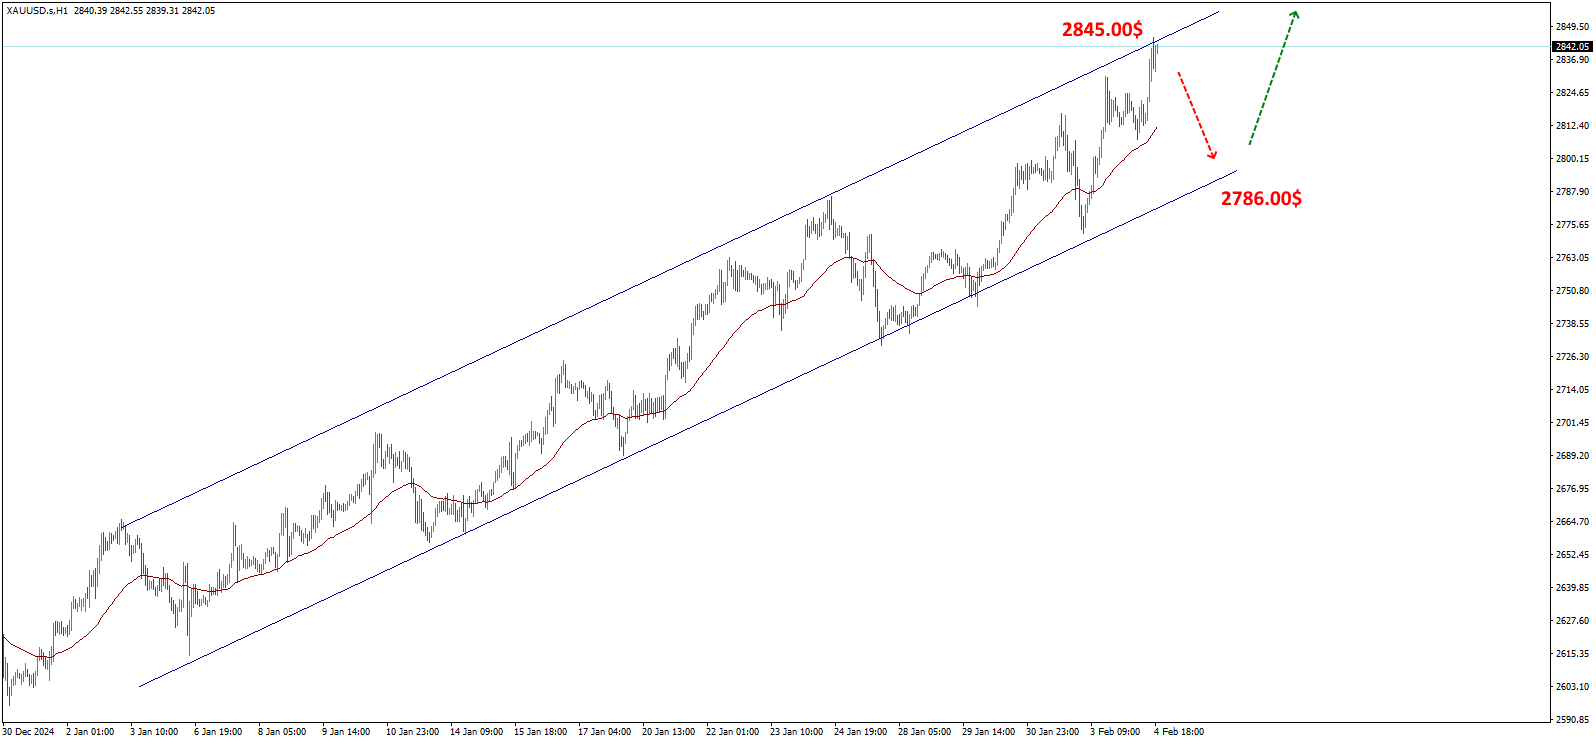
In summary, the technical factors support a continuation of the upward trend and a drive to achieve additional historic levels. However, reaching the psychological barrier of $3000.00 per ounce might trigger strong sell-offs and further corrections before any new attempt to resume the long-term upward path.
Conversely, it is crucial to note that a break below $2670.00 will derail the bullish path, forcing a downward correction that could target the $2555.00 level and extend losses down to $2375.00 before any renewed upward movement.
Ethereum price (ETHUSD) finds difficulty to hold above 2764.75$, to move below it now, noticing that stochastic gathers the positive momentum to support the chances to rise in the upcoming sessions and surpass the mentioned level again.
Therefore, we expect to witness positive trades today, and the price needs to breach 2764.75$ resistance to confirm heading towards 3017.30$ that represents our next main target, taking into consideration that failing to breach the mentioned resistance will put the price under additional negative pressure that its targets begin by testing 2480.00$ areas.
The expected trading range for today is between 2580.00$ support and 2890.00$ resistance.
Trend forecast: Bullish
The GBPJPY pair failed to surpass 193.30 barrier yesterday, to push it to form new negative rebound and notice its consolidation near 191.25 now, hinting its surrender to the negative track again.
We notice that the consolidation of the MA55 above the mentioned barrier to confirm confining trading within the negative track for now, to expect suffering additional losses by attacking 190.55 level soon, followed by repeating the pressure on 189.60 support line.
The expected trading range for today is between 190.55 and 192.60
Trend forecast: Bearish