The main tag of GoldPrice Articles.
You can use the search box below to find what you need.
[wd_asp id=1]
The main tag of GoldPrice Articles.
You can use the search box below to find what you need.
[wd_asp id=1]
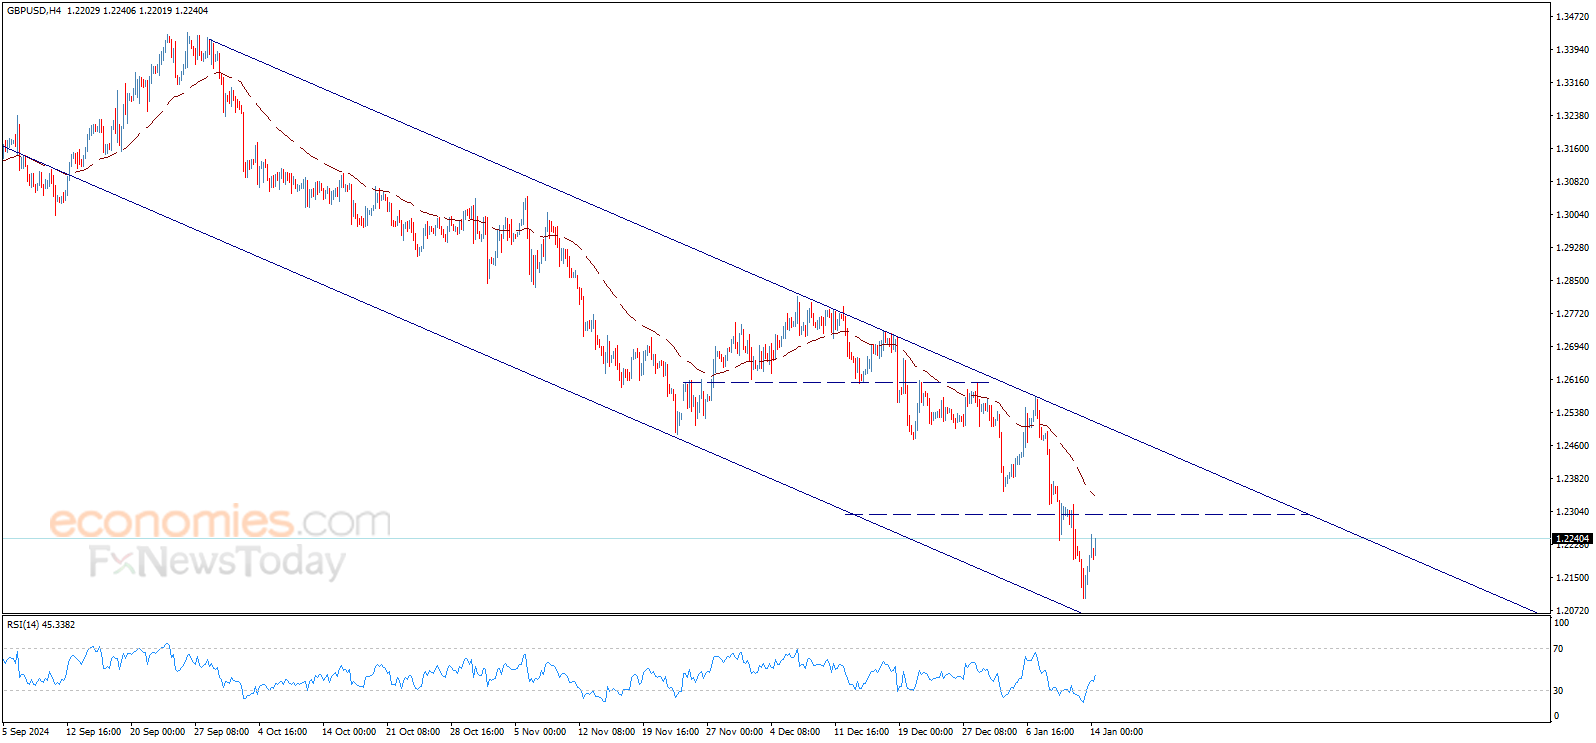
The GBPUSD price shows additional positive trades to move above 1.2200$, waiting to get negative motive that pushes the price to resume the main bearish trend, which its next main target located at 1.2045$.
We remind you that breaking 1.2180$ will ease the mission to achieve the expected decline, while holding below 1.2300$ represents major condition to the continuation of the bearish trend.
The expected trading range for today is between 1.2120$ support and 1.2290$ resistance
Trend forecast: Bearish
Xerox Holdings’ stock price (XRX) inched higher in the intraday levels, buoyed by positive signals from the RSI as the stock tries to correct the main downward trend while trading alongside the negative trend line in the medium term, with negative pressure due to trading below the 50-day SMA.
Therefore we expect the stock to return lower, targeting the support of $8.04 anew, provided it settles below the resistance of $9.50.
Trend forecast for today: Likely Bearish
Spot Gold trades within familiar levels on Tuesday as a better market mood weighed on safe-haven demand throughout the first half of the day. The sentiment improved on headlines indicating that President-elect Donald Trump’s team is considering gradual tariff increases over the upcoming months to prevent a sudden increase in inflation. The plan, not confirmed neither deny by Trump at the time being, implies 2% to 5% tariffs increased per month.
Meanwhile, the United States (US) reported that wholesale-level inflation rose by less than anticipated in December. The Producer Price Index (PPI) rose 0.2% in the month, below the previous 0.4% and the expected 0.3%. On a yearly basis, the PPI was up 3.3%, missing expectations of 3.4%. Finally, the core annual reading resulted at 3.5%, ticking higher from the 3.4% posted in November yet below the 3.8% anticipated by market players.
The positive mood receded as the American session developed, and the three major US indexes trade in the red.
The news reinforced speculation the Federal Reserve (Fed) will keep interest rates at their current levels for longer than previously anticipated. Speculative interest is now waiting for the US December Consumer Price Index (CPI), to be out on Wednesday. Meanwhile, the United Kingdom (UK) will also unveil CPI figures earlier in the day.
XAU/USD hovers around $2,670, and the daily chart shows that bulls are cautiously adding. The pair remains above its moving averages, albeit a bullish 100 Simple Moving Average (SMA) is about to cross above a flat 20 SMA, signaling receding buying interest. Technical indicators, however, have resumed their advances within positive levels, limiting the odds of a relevant leg south.
In the 4-hour chart, a directionless 20 SMA has rejected advances since the week started, now acting as dynamic resistance at around $2,674.00. The 100 and 200 SMAs are also flat, yet well below the current level. Finally, technical indicators have ticked higher, although in neutral-to-bearish territory.
Support levels: 2,660.70 2,645.15 2,635.00
Resistance levels: 2,675.00 2,683.20 2,697.90
Silver price (XAG/USD) recovers some of their recent losses from the previous session, trading near $29.80 per troy ounce during European trading hours on Tuesday. Analyzing the daily chart suggests that short-term price momentum appears neutral, with the XAG/USD pair positioned around the nine-day and 14-day Exponential Moving Averages (EMAs). A breakout in either direction could signal a clearer trend.
Moreover, the 14-day Relative Strength Index (RSI) hovers near the 50 level, suggesting a neutral outlook. This suggests the market is evenly balanced, with no clear indication of overbought or oversold conditions, reflecting equilibrium between bullish and bearish momentum.
Silver price currently tests resistance at the immediate 14-day EMA of $29.83, followed closely by the nine-day EMA at $29.84. A breakout above these levels could boost market sentiment and drive the XAG/USD pair toward the key psychological level of $30.00. A sustained move beyond this threshold may strengthen bullish momentum, potentially setting the stage for the grey metal to target its two-month high of $32.28, last achieved on December 9.
On the downside, initial support is located at the four-month low of $28.74, recorded on December 19, followed by the critical psychological level of $28.00. A break below these levels could intensify bearish momentum and signal further downside potential for Silver price.
Silver is a precious metal highly traded among investors. It has been historically used as a store of value and a medium of exchange. Although less popular than Gold, traders may turn to Silver to diversify their investment portfolio, for its intrinsic value or as a potential hedge during high-inflation periods. Investors can buy physical Silver, in coins or in bars, or trade it through vehicles such as Exchange Traded Funds, which track its price on international markets.
Silver prices can move due to a wide range of factors. Geopolitical instability or fears of a deep recession can make Silver price escalate due to its safe-haven status, although to a lesser extent than Gold’s. As a yieldless asset, Silver tends to rise with lower interest rates. Its moves also depend on how the US Dollar (USD) behaves as the asset is priced in dollars (XAG/USD). A strong Dollar tends to keep the price of Silver at bay, whereas a weaker Dollar is likely to propel prices up. Other factors such as investment demand, mining supply – Silver is much more abundant than Gold – and recycling rates can also affect prices.
Silver is widely used in industry, particularly in sectors such as electronics or solar energy, as it has one of the highest electric conductivity of all metals – more than Copper and Gold. A surge in demand can increase prices, while a decline tends to lower them. Dynamics in the US, Chinese and Indian economies can also contribute to price swings: for the US and particularly China, their big industrial sectors use Silver in various processes; in India, consumers’ demand for the precious metal for jewellery also plays a key role in setting prices.
Silver prices tend to follow Gold’s moves. When Gold prices rise, Silver typically follows suit, as their status as safe-haven assets is similar. The Gold/Silver ratio, which shows the number of ounces of Silver needed to equal the value of one ounce of Gold, may help to determine the relative valuation between both metals. Some investors may consider a high ratio as an indicator that Silver is undervalued, or Gold is overvalued. On the contrary, a low ratio might suggest that Gold is undervalued relative to Silver.
Silver (XAG/USD) ticks higher during the Asian session on Tuesday, though it lacks bullish conviction and seems vulnerable to extending the previous day’s retracement slide from the vicinity of a four-week top. The white metal currently trades around the $29.65 region, up 0.15% for the day.
From a technical perspective, Monday’s failure near the 100-day Exponential Moving Average (EMA) suggests that the recent recovery from the $28.80-$28.75 region has run out of steam and validates the negative outlook. That said, mixed oscillators on the daily chart warrant some caution before placing fresh bearish bets around the XAG/USD and positioning for deeper losses.
In the meantime, the $30.00 psychological mark now seems to act as an immediate hurdle ahead of the $30.50-$30.55 region (100-day EMA). A sustained move beyond the latter might shift the near-term bias in favor of bullish traders and lift the XAG/USD beyond an intermediate resistance near the $31.00 round figure, towards the next relevant barrier near the $31.35-$31.40 zone.
On the flip side, weakness below the mid-$29.00s will reaffirm the bearish outlook and make the XAG/USD vulnerable to retest the $29.00 mark before eventually dropping to the $28.80-$28.70 region, or a three-month low touched in December. The downward trajectory could extend further towards the $28.45-$28.40 area en route to the $28.00 mark and the $27.70-$27.65 support.
Silver is a precious metal highly traded among investors. It has been historically used as a store of value and a medium of exchange. Although less popular than Gold, traders may turn to Silver to diversify their investment portfolio, for its intrinsic value or as a potential hedge during high-inflation periods. Investors can buy physical Silver, in coins or in bars, or trade it through vehicles such as Exchange Traded Funds, which track its price on international markets.
Silver prices can move due to a wide range of factors. Geopolitical instability or fears of a deep recession can make Silver price escalate due to its safe-haven status, although to a lesser extent than Gold’s. As a yieldless asset, Silver tends to rise with lower interest rates. Its moves also depend on how the US Dollar (USD) behaves as the asset is priced in dollars (XAG/USD). A strong Dollar tends to keep the price of Silver at bay, whereas a weaker Dollar is likely to propel prices up. Other factors such as investment demand, mining supply – Silver is much more abundant than Gold – and recycling rates can also affect prices.
Silver is widely used in industry, particularly in sectors such as electronics or solar energy, as it has one of the highest electric conductivity of all metals – more than Copper and Gold. A surge in demand can increase prices, while a decline tends to lower them. Dynamics in the US, Chinese and Indian economies can also contribute to price swings: for the US and particularly China, their big industrial sectors use Silver in various processes; in India, consumers’ demand for the precious metal for jewellery also plays a key role in setting prices.
Silver prices tend to follow Gold’s moves. When Gold prices rise, Silver typically follows suit, as their status as safe-haven assets is similar. The Gold/Silver ratio, which shows the number of ounces of Silver needed to equal the value of one ounce of Gold, may help to determine the relative valuation between both metals. Some investors may consider a high ratio as an indicator that Silver is undervalued, or Gold is overvalued. On the contrary, a low ratio might suggest that Gold is undervalued relative to Silver.
Gold price is back on the bids in Asian trading on Tuesday, having found fresh buyers near the $2,660 region. Gold buyers try their luck again heading into the US inflation test, with the Producer Price Index (PPI) slated for release later in the day.
The US Dollar (USD) consolidates its overnight retreat while the US Treasury bond yields lick their wounds early Tuesday, allowing Gold price to make another run toward the $2,700 barrier.
The risk-on rally in Chinese equities lifts the broader market sentiment, keeping the safe-haven USD on edge. Investors remain expectant of more stimulus from China, especially after recent Chinese efforts to support the Yuan and economic growth.
Goldman Sachs Chief Economist Jan Hatzius said: “China plans to implement a variety of stimulus measures to counter the impact of anticipated US tariffs and a continued housing market downturn.”
Markets also cash in on their USD longs ahead of the top-tier US PPI data, which will likely be closely scrutinized in the lead-up to Wednesday’s Consumer Price Index (CPI) showdown.
Traders have scaled back their bets for a US Federal Reserve (Fed) interest rate cut this year to only one from two predicted in December last year, according to the CME Group’s FedWatch Tool, following a strong US Nonfarm Payrolls report released on Friday.
Therefore, the US inflation data are critical to affirming the hawkish Fed expectations, significantly impacting the Greenback alongside the Gold price. The annual US PPI inflation is expected to increase to 3.4% in December from 3% in November, while core PPI is seen rising 3.7% in the same period after reporting a 3.4% growth previously.
Hot inflation data could revive the US Dollar’s demand and resume the Gold price correction. However, the Gold price could recapture $2,700 and beyond on a downside surprise to the PPI print, prompting markets to prepare for a softer CPI report on Wednesday. It’s worth nothing that any chatter about Trump’s tariff plans could also play a pivotal role in the Gold price action.
Gold price corrected from a monthly high on Monday despite increased inflationary concerns in the incoming US President Donald Trump’s 2.0 era. Gold price is considered as a hedge against inflation.
Additionally, the bright metal failed to benefit from a sharp pullback in the US Dollar and the US Treasury bond yields after a Bloomberg report. Citing people familiar with the matter, Bloomberg reported late Monday that advisors on Trump’s incoming economic team are considering gradually implementing tariffs, increasing them incrementally each month by 2% to 5% per month.
The short-term technical outlook for Gold price remains more or less the same, with more upside likely in the offing following the previous week’s symmetrical triangle breakout.
The 14-day Relative Strength Index (RSI) points north above the midline, currently near 55, adding credence to the bullish potential in Gold price.
Gold price looks to take out the $2,700 barrier should buyers extend control.
The next upside barriers are aligned at the $2,710 round level and the December 12 high of $2,726.
On the other side, strong support is around $2,641, where the 50-day SMA coincides with the triangle resistance.
On sustained declines, Gold price could find immediate respite at $2,635, the confluence of the 21-day SMA and the 100-day SMA.
The last line of defense for Gold buyers is seen at the January 6 low of $2,615.
The Producer Price Index released by the Bureau of Labor statistics, Department of Labor measures the average changes in prices in primary markets of the US by producers of commodities in all states of processing. Changes in the PPI are widely followed as an indicator of commodity inflation. Generally speaking, a high reading is seen as positive (or bullish) for the USD, whereas a low reading is seen as negative (or bearish).
Certainly, today’s bearish reaction to new highs seems to lower the chance for a new trend high in the short term. At least until after there is a test of lower support levels. There are a few things to be aware of. Notice that resistance was seen around the confluence of several technical price targets, beginning with 4.33. A rising ABCD pattern (purple) reached its initial target from the pattern and therefore identified a possible pivot level. So far, the market reaction confirms this.
In addition, to completing a target for the ABCD pattern today, a breakout above the top trendline of a rising channel also triggered on the way to 4.37. Resistance was seen around that line on the most recent swing high of 4.20. So, today’s price action shows a failed breakout of the channel. Once a failure occurs, the possibility of a swing in the other direction increases. That is what is being shown so far.
The first lower trend support area is around the 20-Day MA, now at 3.62, along with an internal uptrend line. Moreover, the 20-Day line can be combined with the 50% retracement at 3.67 and the 2023 swing high of 3.64. The 2023 high has some significance and therefore a solid chance of being tested as support during a correction. Having the 20-Day line and 50% retracement nearby increases the chance for signs of support.
For a look at all of today’s economic events, check out our economic calendar.
Spot Gold is on the back foot on Monday amid persistent US Dollar’s (USD) demand. The XAU/USD hit a multi-week high of $2,697.88 on Friday, as a solid United States (US) monthly employment report spurred risk aversion. The Nonfarm Payrolls (NFP) report showed the country added 256,000 new jobs in December, while the Unemployment Rate edged lower to 4.1%. The figures were upbeat. Even further, Average Hourly Earnings rose by 3.9%, easing from the previous 4%. The combined headlines hint at an on-hold Federal Reserve (Fed) for longer.
Demand for safety equally benefited Gold and the Greenback at the end of the previous week, yet persistent USD demand finally took its toll on XAU/USD, now trading at around $2,665. In the absence of relevant macroeconomic data, the focus remained on sentiment, and stocks’ behaviour. Asian and European indexes closed in the red, while Wall Street trades mixed: only the Dow Jones Industrial Average trades in the green after collapsing on Friday, while the S&P500 and the Nasdaq Composite remain in the red.
Meanwhile, the focus this week will be on inflation. The United Kingdom (UK) and the US will release fresh Consumer Price Index (CPI) figures next Wednesday. Market participants will also be waiting for President-elect Donald Trump and tariffs updates.
From a technical point of view, the daily chart for the XAU/USD pair shows sellers have gained courage, yet at stepper decline is far from evident. The pair remains above all its moving averages, although a mildly bearish 20 Simple Moving Average (SMA) converges with a bullish 100 SMA at around $2,635. Technical indicators, in the meantime, turned sharply lower, yet remain within positive levels.
In the 4-hour chart, Gold is developing below its 20 SMA, which lost its bullish strength and provides resistance at around $2,672. The 100 and 200 SMAs, in the meantime, remain flat below the current level. Finally, technical indicators head firmly south, pressuring their midlines straight from overbought readings, suggesting the near-term slide could continue.
Support levels: 2,660.70 2,645.15 2,635.00
Resistance levels: 2,672.20 2,683.20 2,697.90
The natural gas markets have shown quite a bit of upward momentum. But really, at this point in time, I think you have to look at them through the prism of how many rallies do we have left in the winter? Clearly, we’re in one. Now, the question of course will be whether or not we can break to the $4.50 level. If we can break there, then it’s likely that we could see a lot of upward momentum, perhaps to the $5 level. Ultimately, this is a market that I have no interest in shorting whatsoever. So, with that being the case, I’m just looking for dips to buy.
The $4 level should be support as well, but I also think there’s probably even more support at the $3.60 level. Sooner or later, we are going to focus on spring, but we’ve got some time before that. So, I think we’ve got one, maybe two more bounces and shots higher before we turn around and start focusing on winter being gone. The market breaking down below the $3.40 level could of course break things down significantly, but we’re so far away from that right now, it’s not really a concern of mine.
Copper prices broke a two-year losing streak in 2024 after rising by about 3% following declines of 12% and 8% in 2022 and 2023, respectively.
The red metal performed exceptionally well in the first half of last year, rising above $5 per pound before retreating in the second half of the year, falling back to nearly $4 per pound.
The global economic uncertainty that developed in the second half of last year, particularly in China—the largest copper consumer in the world—dragged on the red metal’s sentiment.
Copper prices got off to a great start in 2025, rising nearly 5% through the first week of trading. The move came despite a rise in the dollar—which usually works against prices because of the currency’s impact on trade.
However, several developments bode well for the industrial metal’s outlook this year.
The first is that China’s government appears more willing to introduce stimulus measures—both from the fiscal and monetary sides.
China expects a new trade war with the incoming Trump administration. While that will likely be negative for global trade, it may also increase Beijing’s willingness to bolster domestic consumption.
A 5% target for Chinese gross domestic product (GDP) growth remains in place for 2025. Beijing has already introduced several measures to boost consumption, including expanding a subsidized program that allows consumers to trade in goods, such as phones.
China also boosted pay for millions of government workers, with about $20 billion in economic impact from those wage hikes. Beijing also agreed to issue about $409 billion in bonds for 2025, the highest on record.
Meanwhile, smelters in China are expected to continue to increase production this year even as the supply of copper concentrate narrows. The increased production estimates follow lower benchmark prices for copper concentrate, which could help to bolster smelters’ profit margins.
The Trump administration appears likely to take measures to make it easier for mining projects to take off. That could include faster permitting and reduced regulations, especially around environmental concerns. That should help boost copper supply, but it won’t come in 2025 because mines take years and sometimes decades to start producing.
That said, demand in the United States is likely to increase, especially if current economic conditions persist and the Federal Reserve cuts interest rates. Still, if the U.S. economy continues to chug along, it could help to support copper prices. The main tailwinds could come from electric vehicles and increased data centers to support artificial intelligence.
A possible target for copper this year could be $5 per pound, according to several analysts. However, there will likely be considerable volatility along the way. A trade war would have an oversized impact on financial markets, especially assets like copper, which are sensitive to trade and overall economic conditions.
Traders increased their short bets on copper late in 2024, with short positioning now at the highest levels since last summer. Prices are still increasing, which could increase copper prices should the current trajectory hold, forcing traders to close their short positions.
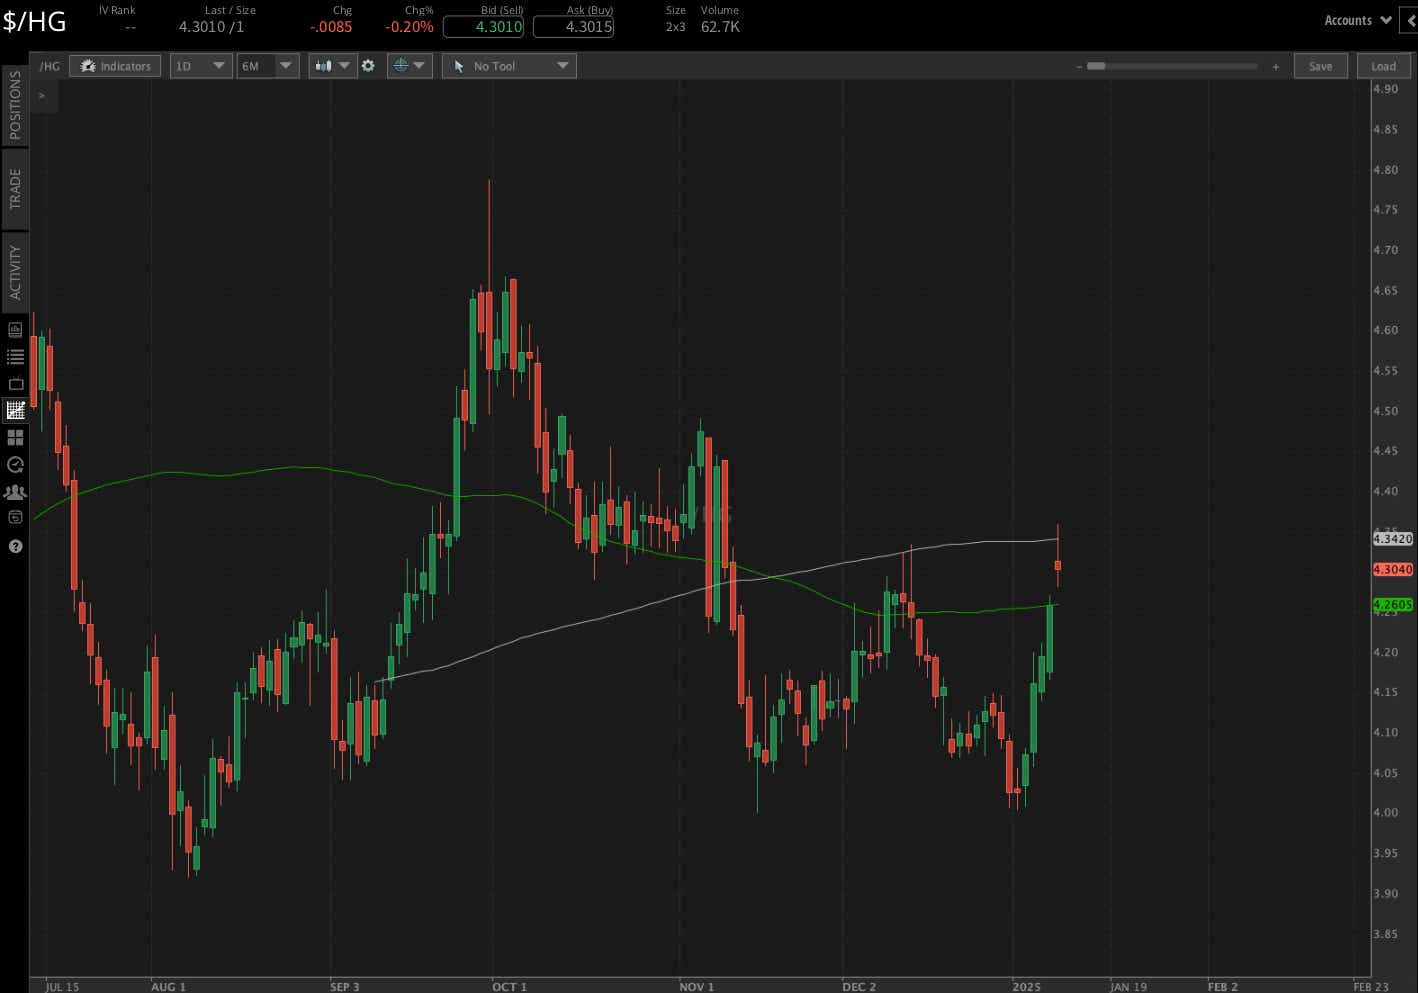
Copper prices made a notable technical move early this month, crossing above the 100-day simple moving average (SMA) on Jan. 10. The 200-day SMA is now being attacked, which could lead to a material improvement in the metal’s technical structure if prices manage to close above. Possible resistance from recent swing highs, notably the November swing high at 4.4930, and the September high at 4.79, could come into play in the coming months.
Thomas Westwater, a tastylive financial writer and analyst, has eight years of markets and trading experience. @fxwestwater
For live daily programming, market news and commentary, visit tastylive or the YouTube channels tastylive (for options traders), and tastyliveTrending for stocks, futures, forex & macro.
Trade with a better broker, open a tastytrade account today. tastylive, Inc. and tastytrade, Inc. are separate but affiliated companies.