The main tag of GoldPrice Articles.
You can use the search box below to find what you need.
[wd_asp id=1]
The main tag of GoldPrice Articles.
You can use the search box below to find what you need.
[wd_asp id=1]
Silver Price rises for the seven straight day putting aside the jump in US Treasury bond yields and the US Dollar, after a strong US jobs report calmed Federal Reserve officials about the employment situation in the US. Nevertheless, the evolution on inflation seems to be stalled, gathering some attention of Fed oficials. The XAG/USD trades at $30.35 up over 0.80%.
Silver continues to trend higher, advancing steadily above the $30.00 figure for the latest fhree trading days, boosted by buyers emerging at crucial support found at the 200-day Simple Moving Average (SMA) at $29.93. However, they are struggling with stir resistance at the 50-day SMA at $30.42, which has kept prices from reaching the 100-day SMA at $30.80.
If bulls clear those levels, that will clear the path to challenge $31.00 and expose the next cycle high seen at $32.32, December’s 12 peak.
Conversely, if XAG/USD slides beneath $30.00, the 200-day SMA emerges as bulls’ first line of defense. A breach of that level, could drive Silver’s price towards the January 6 low of $29.41, ahead of the December 31 low of $28.78.
Silver is a precious metal highly traded among investors. It has been historically used as a store of value and a medium of exchange. Although less popular than Gold, traders may turn to Silver to diversify their investment portfolio, for its intrinsic value or as a potential hedge during high-inflation periods. Investors can buy physical Silver, in coins or in bars, or trade it through vehicles such as Exchange Traded Funds, which track its price on international markets.
Silver prices can move due to a wide range of factors. Geopolitical instability or fears of a deep recession can make Silver price escalate due to its safe-haven status, although to a lesser extent than Gold’s. As a yieldless asset, Silver tends to rise with lower interest rates. Its moves also depend on how the US Dollar (USD) behaves as the asset is priced in dollars (XAG/USD). A strong Dollar tends to keep the price of Silver at bay, whereas a weaker Dollar is likely to propel prices up. Other factors such as investment demand, mining supply – Silver is much more abundant than Gold – and recycling rates can also affect prices.
Silver is widely used in industry, particularly in sectors such as electronics or solar energy, as it has one of the highest electric conductivity of all metals – more than Copper and Gold. A surge in demand can increase prices, while a decline tends to lower them. Dynamics in the US, Chinese and Indian economies can also contribute to price swings: for the US and particularly China, their big industrial sectors use Silver in various processes; in India, consumers’ demand for the precious metal for jewellery also plays a key role in setting prices.
Silver prices tend to follow Gold’s moves. When Gold prices rise, Silver typically follows suit, as their status as safe-haven assets is similar. The Gold/Silver ratio, which shows the number of ounces of Silver needed to equal the value of one ounce of Gold, may help to determine the relative valuation between both metals. Some investors may consider a high ratio as an indicator that Silver is undervalued, or Gold is overvalued. On the contrary, a low ratio might suggest that Gold is undervalued relative to Silver.
Nevertheless, the current rally is occurring inside last week’s price range. It shows a long red candle with a weak close near the lows of the week. This week’s bullish price action counters some of last week’s bearish price action and shows strength. But since an inside week is a form of consolidation on that time scale, trading could proceed in a choppy fashion for a while longer. At least that seems to be a risk. A new weekly high closing price this week will go a long way towards further confirming bullish daily signals.
The price structure of higher swing highs and higher swing lows remains intact for the bull trend. Recent bullish signals indicate a possible challenge to resistance around the current trend high of 4.20. If upward momentum can be maintained, then the 4.20 high could be exceeded. A rising parallel trend channel defines the vibration of price in the larger bull trend that began from the 2024 low of 1.55.
The current shorter-term uptrend, that began from the October swing low, defines a smaller internal trend within a large uptrend price pattern. Since support was successfully tested around the internal uptrend line and 20-Day MA, the road may be clear for the larger bullish pattern to exert its influence. However, gold could go to a new trend high yet still find resistance around the top channel line.
In the big picture, gold triggered another bullish reversal of the long-term downtrend on a rally above the October 2023 swing high of 3.64 recently. That breakout followed an earlier bull breakout of a large symmetrical triangle pattern. So, the current short-term advance is supported by the larger bullish price patterns.
For a look at all of today’s economic events, check out our economic calendar.
Silver price (XAG/USD) gains to near $31.30 in Friday’s European session. The white metal gains ahead of the United States (US) Nonfarm Payroll (NFP) data for December, which will be published at 13:30 GMT. The labor market data will influence market expectations about whether the Federal Reserve (Fed) will continue with its cautious stance on further policy-easing.
The NFP report is expected to show that the US economy added fresh 160K workers in December, lower than 227K in November. The Unemployment Rate is estimated to have remained steady at 4.2%.
Investors will also pay close attention to the Average Hourly Earnings data for December. Being a wage growth measure that drives consumer spending, the Average Hourly Earnings data will provide cues about the inflation outlook. Month-on-month Average Hourly Earnings is expected to have risen at a slower pace of 0.3% from the former release of 0.4%, with annual figures growing steadily by 4%.
The Federal Open Market Committee (FOMC) minutes for the December policy meeting showed that officials were worried about a slowdown in the progress in inflation towards the Fed’s target of 2%.
Broadly, the Silver price has performed strongly for more than a week as market sentiment remains cautious due to uncertainty over the likely global trade war. Investors remain cautious due to incoming protectionist policies from President-elect Donald Trump, which are expected to promote the business outlook of the US. Historically, Silver performs better in a heightened uncertain environment.
Ahead of the US NFP report, the US Dollar Index (DXY), which gauges Greenback’s value against six major currencies, flattens around 109.15. 10-year US Treasury yields rise to near 4.7%.
Silver price continues to face selling pressure near the upward-sloping trendline around $30.50, which is plotted from the February 29 low of $22.30 on a daily timeframe. The white metal oscillates around the 20-day Exponential Moving Average (EMA), which trades near $30.00.
The 14-day Relative Strength Index (RSI) moves higher above 50.00. A fresh bullish momentum would come into action if it decisively breaks above 60.00.
Looking down, the September low of $27.75 would act as key support for the Silver price. On the upside, the December 12 high of $32.33 would be the barrier.
Silver is a precious metal highly traded among investors. It has been historically used as a store of value and a medium of exchange. Although less popular than Gold, traders may turn to Silver to diversify their investment portfolio, for its intrinsic value or as a potential hedge during high-inflation periods. Investors can buy physical Silver, in coins or in bars, or trade it through vehicles such as Exchange Traded Funds, which track its price on international markets.
Silver prices can move due to a wide range of factors. Geopolitical instability or fears of a deep recession can make Silver price escalate due to its safe-haven status, although to a lesser extent than Gold’s. As a yieldless asset, Silver tends to rise with lower interest rates. Its moves also depend on how the US Dollar (USD) behaves as the asset is priced in dollars (XAG/USD). A strong Dollar tends to keep the price of Silver at bay, whereas a weaker Dollar is likely to propel prices up. Other factors such as investment demand, mining supply – Silver is much more abundant than Gold – and recycling rates can also affect prices.
Silver is widely used in industry, particularly in sectors such as electronics or solar energy, as it has one of the highest electric conductivity of all metals – more than Copper and Gold. A surge in demand can increase prices, while a decline tends to lower them. Dynamics in the US, Chinese and Indian economies can also contribute to price swings: for the US and particularly China, their big industrial sectors use Silver in various processes; in India, consumers’ demand for the precious metal for jewellery also plays a key role in setting prices.
Silver prices tend to follow Gold’s moves. When Gold prices rise, Silver typically follows suit, as their status as safe-haven assets is similar. The Gold/Silver ratio, which shows the number of ounces of Silver needed to equal the value of one ounce of Gold, may help to determine the relative valuation between both metals. Some investors may consider a high ratio as an indicator that Silver is undervalued, or Gold is overvalued. On the contrary, a low ratio might suggest that Gold is undervalued relative to Silver.
Gold price consolidates the weekly gains just below the one-month high of $2,678 set on Thursday as traders eagerly await the US Nonfarm Payrolls (NFP) data for placing fresh bets.
Gold price continues to draw support from increased safe-haven demand, which overshadows the persistent strength in the US Dollar (USD) and the US Treasury bond yields. Inflation fears have been stoked due to the potential impact of the incoming immigration and trade policies by US President-elect Donald Trump, boosting the appeal of Gold price as an inflation hedge and a traditional safe-haven asset.
Meanwhile, expectations of fewer interest rate cuts by the US Federal Reserve (Fed) this year and China’s economic concerns keep the sentiment around the USD underpinned as the Greenback hovers near weekly highs against its major currency rivals. US benchmark 10-year Treasury bond yields sit at eight-month highs above 4.68%, somewhat limiting the upside attempts in the non-yielding Gold price.
Markets also remain risk-averse and refrain from placing any directional bets on the bright metal amid a typical pre-NFP caution. The US economy is expected to create 160K jobs in December after adding 227K jobs in November. The Unemployment Rate and the Average Hourly Earnings will likely remain steady at 4.2% and 4%, respectively, in the reported period.
A weaker-than-expected headline NFP print is likely to bring back expectations of aggressive Fed rate cuts on the table, triggering a broad US Dollar correction while adding extra legs to the ongoing Gold price uptrend. Conversely, an upside surprise in the NFP and wage inflation data could ramp up hawkish Fed bets, spelling doom for Gold price.
Further, markets could also resort to profit-taking on Gold longs ahead of next week’s US Consumer Price Index (CPI) data. However, speculations surrounding Trump’s policies could continue to drive markets, acting as a major tailwind for Gold price heading into the weekend.
The daily chart shows that the 14-day Relative Strength Index (RSI) holds comfortably above the midline, currently near 57.50, justifying the ongoing upside in Gold price. Additionally, Gold price closed Tuesday above the static resistance at $2,665.
However, buyers are likely to remain cautious as the 21-day Simple Moving Average (SMA) has crossed the 100-day SMA from above on a daily closing basis on Thursday, confirming a Bear Cross.
Amidst conflicting daily technical indicators, the US NFP report could pave the next direction in Gold price.
On a US NFP miss, Gold price could extend its four-day advance and challenge the December 13 high of $2,693 above the four-week high of $2,678.
The next upside barriers are aligned at the $2,700 round level and the December 12 high of $2,726.
Alternatively, strong payrolls could revive Gold sellers, knocking the rates toward the 50-day SMA at $2,643, below which the confluence of the 21-day SMA and the 100-day SMA at $2,633 will be tested.
The line in the sand for Gold buyers is pegged at the January 6 low of $2,615.
The Nonfarm Payrolls release presents the number of new jobs created in the US during the previous month in all non-agricultural businesses; it is released by the US Bureau of Labor Statistics (BLS). The monthly changes in payrolls can be extremely volatile. The number is also subject to strong reviews, which can also trigger volatility in the Forex board. Generally speaking, a high reading is seen as bullish for the US Dollar (USD), while a low reading is seen as bearish, although previous months’ reviews and the Unemployment Rate are as relevant as the headline figure. The market’s reaction, therefore, depends on how the market assesses all the data contained in the BLS report as a whole.
Silver price (XAG/USD) continues its rally after registering little losses in the previous session, trading around $30.20 per troy ounce during the Asian hours on Friday. Traders are now focused on US labor market data including Nonfarm Payrolls (NFP), for additional insights into the Federal Reserve’s policy direction.
The precious Silver, often considered a safe-haven asset, gains support amid uncertainty surrounding inflation and potential tariffs under President-elect Trump’s administration, as highlighted by the US Federal Reserve (Fed).
However, the upside of the non-yielding metal could be restrained as long-term US bond yields continue climbing on heavy supply. The 10-year stands at 4.68%, while the 30-year stands at 4.92% at the time of writing. This could be attributed to hawkish Federal Open Market Committee (FOMC) Minutes from the December meeting.
The latest FOMC Meeting Minutes showed that Fed policymakers expressed concern about inflation and the impact that President-elect Donald Trump’s policies could have. Fed officials indicated they would be moving more slowly on rate reductions because of the uncertainty. Fed officials penciled the expected cuts in 2025 to two from four in the previous estimate at September’s meeting.
Heightened geopolitical tensions have intensified market volatility, driving investors toward safe-haven assets like Silver. On Thursday, four people were killed in shelling incidents in Ukraine, with regional officials attributing one attack to Russia’s military and another to Ukrainian forces. In the Russian-controlled Zaporizhzhia region, two additional fatalities occurred when the town of Kamyanka-Dniprovska came under Ukrainian fire, according to Russia-appointed governor Yevgeny Balitsky, as reported by Reuters.
Silver is a precious metal highly traded among investors. It has been historically used as a store of value and a medium of exchange. Although less popular than Gold, traders may turn to Silver to diversify their investment portfolio, for its intrinsic value or as a potential hedge during high-inflation periods. Investors can buy physical Silver, in coins or in bars, or trade it through vehicles such as Exchange Traded Funds, which track its price on international markets.
Silver prices can move due to a wide range of factors. Geopolitical instability or fears of a deep recession can make Silver price escalate due to its safe-haven status, although to a lesser extent than Gold’s. As a yieldless asset, Silver tends to rise with lower interest rates. Its moves also depend on how the US Dollar (USD) behaves as the asset is priced in dollars (XAG/USD). A strong Dollar tends to keep the price of Silver at bay, whereas a weaker Dollar is likely to propel prices up. Other factors such as investment demand, mining supply – Silver is much more abundant than Gold – and recycling rates can also affect prices.
Silver is widely used in industry, particularly in sectors such as electronics or solar energy, as it has one of the highest electric conductivity of all metals – more than Copper and Gold. A surge in demand can increase prices, while a decline tends to lower them. Dynamics in the US, Chinese and Indian economies can also contribute to price swings: for the US and particularly China, their big industrial sectors use Silver in various processes; in India, consumers’ demand for the precious metal for jewellery also plays a key role in setting prices.
Silver prices tend to follow Gold’s moves. When Gold prices rise, Silver typically follows suit, as their status as safe-haven assets is similar. The Gold/Silver ratio, which shows the number of ounces of Silver needed to equal the value of one ounce of Gold, may help to determine the relative valuation between both metals. Some investors may consider a high ratio as an indicator that Silver is undervalued, or Gold is overvalued. On the contrary, a low ratio might suggest that Gold is undervalued relative to Silver.
Price cà phê Robusta greduce myes
Trên sàn London, giá cà phê Robusta ghi nhận đã quay đầu giảm mạnh vào lúc 15 giờ 30 phút ngày January 9, 2025. Cụ thể, mức giảm dao động từ 40 – 63 USD/tấn, với giá giao hàng tháng March 2025 đạt 4956 USD/tấn (giảm 63 USD/tấn). Các kỳ hạn khác cũng ghi nhận mức giảm tương tự, với giá tháng May 2025 là 4877 USD/tấn (giảm 53 USD/tấn), tháng July 2025 là 4795 USD/tấn (giảm 44 USD/tấn) và tháng September 2025 là 4709 USD/tấn (giảm 40 USD/tấn).
Price cà phê Arabica cugh khip kthere kdamp hthanks
Tương tự, giá cà phê Arabica trên sàn New York cũng giảm mạnh, với mức giảm từ 4.05 – 4.50 cent/lb. Giá giao hàng tháng March 2025 là 316.45 cent/lb (giảm 4.05 cent/lb), tháng May 2025 là 313.00 cent/lb (giảm 4.30 cent/lb), tháng July 2025 là 307.95 cent/lb (giảm 4.45 cent/lb), và tháng September 2025 là 301.60 cent/lb (giảm 4.50 cent/lb).
| Cà phê được trồng tại xã Phú Sơn, huyện Lâm Hà, tỉnh Lâm Đồng. Ảnh: Cẩm Thảo |
Giá cà phê Arabica từ Brazil cũng ghi nhận sự giảm giá không đều, dao động từ 373.10 – 395.50 USD/tấn. Kỳ giao hàng tháng May 2025 là 395.50 USD/tấn (giảm 0.95 USD/tấn) và kỳ tháng July 2025 là 382.90 USD/tấn (giảm 5.90 USD/tấn).
Gthere cà phê nội địa giảm “sốc”
Theo thông tin từ Giacaphe.com, vào lúc 15 giờ 30 phút hôm nay January 9, 2025, sau 3 phiên tăng liên tiếp trong tuần, thì đã ghi nhận giá giảm sốc vào đầu giờ chiều nay ở mức trung bình 119.100 đồng/kg, giảm -2.300 đồng/kg.
The highest coffee purchase price in key regions of the Central Highlands was recorded at 119.200 VND/kg. Specifically, today’s coffee price at Dak Lak at 119.000 VND/kg, down -2.300 VND/kg; coffee price at Lam Dong has a price of 118.000 VND/kg, down -2.500 VND/kg; coffee price at Gia Lai có mức giá 119.000 đồng/kg, giảm -2.200 đồng/kg và giá cà phê tại Dak Nong Today price is 119.200 VND/kg, down -2.300 VND/kg.
Giá cà phê trong nước mà Giacaphe.com niêm yết mỗi ngày được tính toán dựa trên giá của hai sàn cà phê world kết hợp với việc khảo sát liên tục từ các doanh nghiệp, đại lý thu mua tại các vùng trọng điểm trồng cà phê trên cả nước.
Coffee price prediction tomorrow 10/ 1 / 2025
Việc giá cà phê trong nước giảm mạnh vào đầu giờ chiều nay có thể được lý giải bởi một số yếu tố. Trước hết, sự điều chỉnh giá có thể phản ánh những biến động trong cung và cầu toàn cầu, cũng như tâm lý thị trường sau các phiên tăng liên tiếp.
 |
| Cà phê thành phẩm của Công ty TNHH Seed Coffee Đà Lạt. Ảnh: Cẩm Thảo |
Ngoài ra, các yếu tố như giá cà phê thế giới, thời tiết, sản lượng thu hoạch và nhu cầu tiêu thụ cũng có thể ảnh hưởng đến giá cà phê trong nước. Nếu tình hình thời tiết thuận lợi và sản lượng cà phê đạt yêu cầu, giá có thể tiếp tục chịu áp lực giảm.
Việc giá cà phê giảm mạnh có thể ảnh hưởng đến tâm lý người nông dân và các doanh nghiệp thu mua. Trong bối cảnh thị trường thế giới biến động, người tiêu dùng và các nhà đầu tư nên theo dõi sát sao các yếu tố tác động đến giá cả trong thời gian tới.
Dự báo cho ngày January 10, 2025, nếu không có thay đổi lớn về các yếu tố cơ bản, giá cà phê có khả năng sẽ tiếp tục ở mức ổn định trong khoảng từ 118.000 đến 119.200 đồng/kg.
Sources: https://congthuong.vn/du-bao-gia-ca-phe-ngay-mai-1012025-duoi-muc-119000-dongkg-368736.html
Nonetheless, today’s low established the bottom of a possible small expanding triangle consolidation formation. It is forming just below resistance around the 200-Day MA, currently at 75.74. This means that crude could rise to new highs but stay within the expanding consolidation range as defined with two lines around the boundary of the pattern that are pointing away from each other.
A resistance zone is identified on the chart from 75.78 to 76.47 due to the confluence of several indicators, including the 200-Day line. Also, there is the bottom boundary line of a large symmetrical triangle pattern cutting through the range.
Notice that the area around the 200-Day line was last tested as resistance during the upswing that ended with a peak of 79.09 in October last year. That advance ended with a 13.44 point or 20.5% rise in the price of crude oil, when measured from the September low of 65.65. There might be a measured move relationship between the prior advance and the current rally. The current advance saw crude oil rise by 8.36 points or 12.5% as of Wednesday’s high of 75.47. Bullish sentiment began to dominate again following the 67.11 bottom in early-December and that price is used to measure the current advance.
The September rally occurred over 20 trading days, while the current advance to yesterday’s was 21 days. That shows time symmetry. Meaning, once the time matches there is the potential for a pivot in the price of crude. That could occur with a retracement or consolidation. It is also interesting to note that the 8.36-point advance is 62.2% of the 13.44-point rally that started in September. That ratio is very close to the 61.8% Fibonacci relationship.
For a look at all of today’s economic events, check out our economic calendar.
Spot Gold is up for a third consecutive day, hitting $2,678.16 a troy ounce during European trading hours, holding nearby in a thinned American session amid a United States (US) holiday. Speculative interest maintained the cautious stance despite a lighter macroeconomic calendar, resulting in generally stronger safe-haven assets. XAU/USD trades comfortable above $2,670, moving one step closer to record highs in the $2,726 price zone.
Data-wise, US-based employers announced 38,792 cuts in December, a 33% decrease from the 57,727 cuts announced one month prior. According to the Challenger Job Cuts report, it is up 11% from the 34,817 cuts announced in the last month of 2023. The report adds to encouraging employment-related figures ahead of the Nonfarm Payrolls (NFP) report.
The December NFP report is expected to show that the US economy created 160,000 new positions, another solid figure. At the same time, the Unemployment Rate is foreseen to remain steady at 4.2%. If that’s the case, financial markets will likely welcome the headlines that would allow the Federal Reserve’s (Fed) recently adopted tighter path when they meet on January 28-29.
From a technical point of view, XAU/USD’s bullish potential has increased. The pair posted a higher high and a higher low for a third consecutive day while extending gains beyond all its moving averages. The 20 Simple Moving Average (SMA) lacks directional strength at around $2,638, while the 100 SMA nears the shorter one with a bullish slope from below. At the same time technical indicators head firmly north within positive levels, favoring a continued advance.
In the near term, and according to the 4-hour chart, XAU/USD is also poised to extend its advance. The pair currently develops above all its moving averages, with a bullish 20 SMA advancing beyond the longer ones. The 200 SMA stands directionless at $2,645.98, providing support. As per technical indicators, the Momentum indicator grind higher within positive levels, while the Relative Strength Index (RSI) indicator retreats modestly from near overbought readings, not enough to support a bearish movement.
Support levels: 2,664.10 2,645.90 2,632.70
Resistance levels: 2,678.20 2,692.15 2,726
According to gold trading company platforms, the price of gold has increased by 1.5% since the beginning of the new year. Similarly, the price of silver attempted to reach $31 per ounce. According to trades, the price of silver increased by 5% in the first trades of 2025.

Yesterday, the Federal Reserve released the minutes of the Federal Open Market Committee (FOMC) meeting last month. The meeting summary revealed two things: policymakers are concerned about the trade and immigration policies of President-elect Donald Trump, and officials are concerned about inflation risks. The meeting minutes added: “Almost all participants judged that the upside risks to the inflation outlook had increased.” And “as reasons for this judgment, participants cited stronger-than-expected recent readings on inflation and the potential implications of possible changes in trade and immigration policy.”
For his part, Trump has vowed to impose global tariffs and large levies on Chinese goods. He has also threatened to impose large tariffs on Canada, Mexico and countries involved in anti-dollar efforts.
At the last meeting of 2024, FOMC members voted to cut the US interest rate by another quarter point to a range of 4.25% and 4.5%. However, they now expect only one more quarter-point cut in the US interest rate this year, down from the initial estimate of four quarter-point cuts.
In general, investors widely believe the Fed will hit the pause button later this month. Ultimately, according to the December minutes, officials believe it would be wise to take a more cautious approach to normalizing US interest rates. Meanwhile, this would normally be bad news for gold and silver markets, precious metals remained positive as Treasury yields fell. The benchmark 10-year yield fell 1.2 basis points to 4.673%. furthermore, lower yields are good for gold prices because they reduce the opportunity cost of holding non-yielding bullion.
According to forex market trades, the US dollar is still hovering near its two-year high. The US Dollar Index (DXY), which measures the performance of the US currency against a basket of other major currencies, has risen to the resistance level of 109.06, its highest level in two years. As is well known, a stronger US dollar is a negative factor for dollar-denominated commodities as it makes them more expensive for foreign investors to buy.
Always keep gold in your trading portfolio and do not forget that it rose last year by 27 percent, supported by global geopolitical tensions, easing central bank policies, and their strong purchase of gold. These factors still exist.
In this regard, Goldman Sachs has postponed a target for gold prices to $3000 until mid-2026 after expecting gold to reach that level in the new year 2025. Furthermore, the bank reduced its forecast on the back of expectations of fewer cuts by the US Federal Reserve. Against this backdrop, bullish bets by hedge funds have fallen to their lowest level in six months, according to Commodity Futures Trading Commission data.
In general, the gold price index may remain in its current environment until the interaction with the US jobs report tomorrow, Friday, which is expected to show a moderate but still healthy US labour market. Moreover, the data is unlikely to change the view that the Federal Reserve will take a more cautious approach to cutting US interest rates in 2025 amid renewed concerns about inflation.
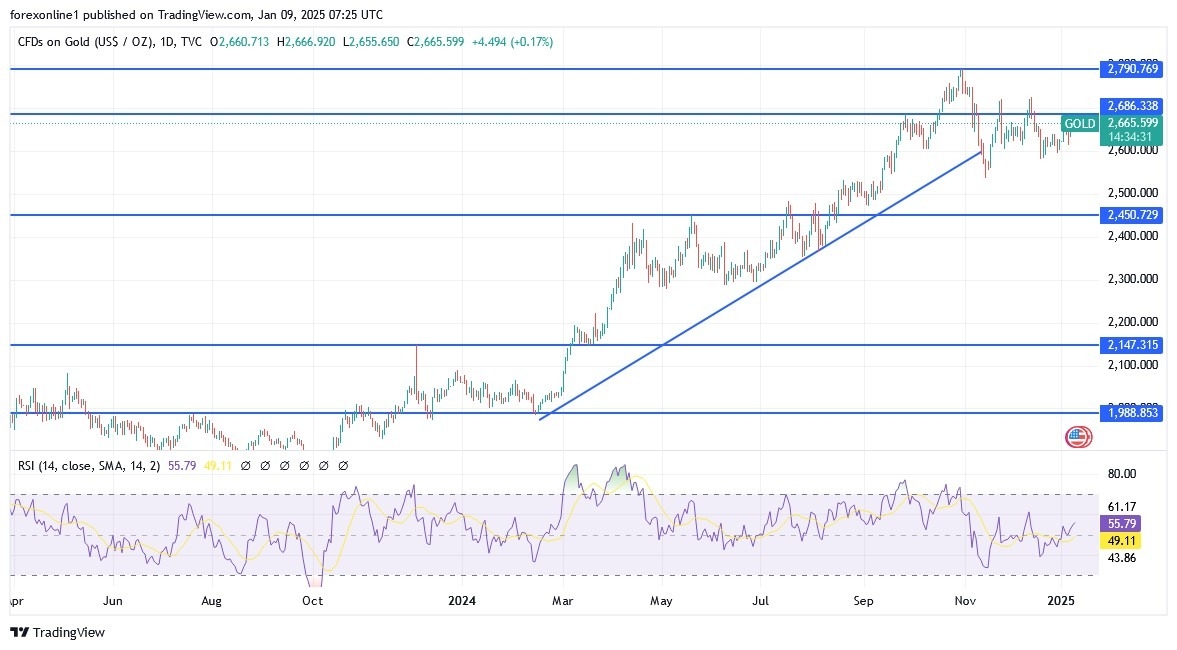
According to the daily chart and the forecasts of gold analysts today, the overall trend leans more towards the upside. Also, the bulls are cautiously approaching the psychological resistance level of $2700 per ounce, which could support further strong positive momentum for gold prices. The Relative Strength Index and the MACD on this period are turning upwards and there are opportunities for further gains before reaching strong overbought levels. Overall, I still prefer buying gold from any downward level. Currently, the closest support levels for gold prices are $2648, $2625, and $2600 per ounce.
Ready to trade today’s Gold prediction? Here’s a list of some of the best XAU/USD brokers to check out.
Silver prices (XAG/USD) continue their upward trend, extending the winning streak that began on January 1. The grey metal trades around $30.20 per troy ounce during the European hours on Thursday. A closer look at the daily chart suggests a developing bullish bias, with the XAG/USD pair pushing higher along nine- and 14-day Exponential Moving Averages (EMAs), signaling robust short-term price momentum.
The 14-day Relative Strength Index (RSI) has also climbed above the 50 level, reinforcing the bullish sentiment. A further increase in Silver price could indicate growing bullish momentum. However, the alignment of the nine-day EMA with the 14-day EMA still suggests the absence of a strong directional trend in the short-term price movement.
Silver price may face potential resistance at the psychological level of $31.00. A decisive break above this level could bolster bullish momentum, paving the way for the metal to target the two-month high of $32.28, last reached on December 9.
On the downside, immediate support is likely at the psychological level of $30.00, followed by the nine-day EMA at $29.83. A break below this level could weaken short-term momentum, potentially pushing the XAG/USD pair toward the four-month low of $29.82, recorded on December 19.
Silver is a precious metal highly traded among investors. It has been historically used as a store of value and a medium of exchange. Although less popular than Gold, traders may turn to Silver to diversify their investment portfolio, for its intrinsic value or as a potential hedge during high-inflation periods. Investors can buy physical Silver, in coins or in bars, or trade it through vehicles such as Exchange Traded Funds, which track its price on international markets.
Silver prices can move due to a wide range of factors. Geopolitical instability or fears of a deep recession can make Silver price escalate due to its safe-haven status, although to a lesser extent than Gold’s. As a yieldless asset, Silver tends to rise with lower interest rates. Its moves also depend on how the US Dollar (USD) behaves as the asset is priced in dollars (XAG/USD). A strong Dollar tends to keep the price of Silver at bay, whereas a weaker Dollar is likely to propel prices up. Other factors such as investment demand, mining supply – Silver is much more abundant than Gold – and recycling rates can also affect prices.
Silver is widely used in industry, particularly in sectors such as electronics or solar energy, as it has one of the highest electric conductivity of all metals – more than Copper and Gold. A surge in demand can increase prices, while a decline tends to lower them. Dynamics in the US, Chinese and Indian economies can also contribute to price swings: for the US and particularly China, their big industrial sectors use Silver in various processes; in India, consumers’ demand for the precious metal for jewellery also plays a key role in setting prices.
Silver prices tend to follow Gold’s moves. When Gold prices rise, Silver typically follows suit, as their status as safe-haven assets is similar. The Gold/Silver ratio, which shows the number of ounces of Silver needed to equal the value of one ounce of Gold, may help to determine the relative valuation between both metals. Some investors may consider a high ratio as an indicator that Silver is undervalued, or Gold is overvalued. On the contrary, a low ratio might suggest that Gold is undervalued relative to Silver.