The main tag of GoldPrice Articles.
You can use the search box below to find what you need.
[wd_asp id=1]
The main tag of GoldPrice Articles.
You can use the search box below to find what you need.
[wd_asp id=1]
Gold price is consolidating the previous rebound near $2,650 early Wednesday, awaiting the US ADP jobs report and the Minutes of the US Federal Reserve (Fed) December meeting for the next leg higher.
Following the latest upbeat US economic data releases, Gold price fails to sustain at higher levels, courtesy of the hawkish expectations surrounding the Fed. The JOLTS survey showed Tuesday that US job openings in November climbed to 8.098 million, outpacing forecasts for a 7.7 million growth and higher than October’s 7.839 million print.
Markets have priced out an interest rate cut by the Fed this month while the odds for a 25 basis points (bps) reduction in March stand at only 37%, according to the CME Group’s FedWatch Tool. The US Treasury bond yields continue to ride higher on the Trump trade optimism and hawkish Fed bets, limiting the upside attempts in the non-yielding Gold price.
US President-elect Donald Trump takes office on January 20, and his proposed tariffs and protectionist policies are seen as inflationary, calling for higher interest rates and a stronger US Dollar.
However, the US Dollar has paused its previous upswing, lending some support to Gold buyers. Nevertheless, China’s economic concerns and sagging physical Gold demand from India will continue to act as headwinds for the bright metal. Domestic Gold prices have surged due to the rapid depreciation of the Indian Rupee (INR) to record lows, making Gold purchases expensive for locals.
If risk aversion gathers pace amid renewed geopolitical tensions in the Middle East or tariff threats from incoming US President Donald Trump, global stocks will likely come under fresh selling pressure, lifting the haven demand for the Greenback and Gold price.
However, the upcoming US ADP Employment Change data and the Fed Minutes appear as the main event risks for Gold price in the session ahead. The US private sector is seen adding 140K jobs in December after reporting a 146K job gain in November. Surprisingly strong jobs data and hawkish Fed Minutes could reverberate hawkish Fed bets, negatively impacting the non-interest-bearing Gold price.
The daily chart shows that the 14-day Relative Strength Index (RSI) holds modestly flat, just above the 50 level, suggesting that the Gold price upside remains intact.
At the moment, Gold price defends the 50-day Simple Moving Average (SMA) at $2,646 after closing above that barrier on Tuesday.
Gold buyers must take out the strong resistance at $2,665 to revive the recovery from the previous month’s low of $2,583.
Further up, the December 13 high at $2,693 and the $2,700 level will challenge bearish commitments.
Conversely, if the 50-day SMA resistance-turned-support caves in, the next downside cap aligns near $2,634, where the 21-day SMA and the 100-day SMA close in.
A breach of the latter could expose Monday’s low of $2,615. The last line of defence for Gold buyers is seen at the December 30 low of $2,596.
FOMC stands for The Federal Open Market Committee that organizes 8 meetings in a year and reviews economic and financial conditions, determines the appropriate stance of monetary policy and assesses the risks to its long-run goals of price stability and sustainable economic growth. FOMC Minutes are released by the Board of Governors of the Federal Reserve and are a clear guide to the future US interest rate policy.
Next release: Wed Jan 08, 2025 19:00
Frequency: Irregular
Consensus: –
Previous: –
Source: Federal Reserve
Silver price posts solid gains as it bounces off the 200-day Simple Moving Average (SMA) of $29.89 and climbs past the $30.00 threshold, up by 0.43% at the time of writing. Although US economic data boosted the US dollar and has kept US yields higher, the grey metal has extended its uptrend.
From a technical perspective, Silver buyers are struggling to remain above the $30.00 figure for the second straight day. Although they reached a daily high of $30.38, a ‘tweezers-top’ candle chart pattern could pave the way for a pullback.
The Relative Strength Index (RSI) shifted bullishly but remained at around the 50 neutral levels. This suggests that neither buyers nor sellers are in charge.
For a bullish continuation, XAG/USD must clear the $30.40 an ounce barrier. Once surpassed, the next key resistance level would be the 50-day SMA at $30.64, followed by the 100-day SMA at $30.78. On further strength, the $31.00 would be exposed.
Conversely, If XAG/USD drops below the 200-day SMA, sellers could push the grey’s metal price lower. Key support levels would be the December 31 swing low of $28.78, followed by the September 6 daily low of $27.69.
Silver is a precious metal highly traded among investors. It has been historically used as a store of value and a medium of exchange. Although less popular than Gold, traders may turn to Silver to diversify their investment portfolio, for its intrinsic value or as a potential hedge during high-inflation periods. Investors can buy physical Silver, in coins or in bars, or trade it through vehicles such as Exchange Traded Funds, which track its price on international markets.
Silver prices can move due to a wide range of factors. Geopolitical instability or fears of a deep recession can make Silver price escalate due to its safe-haven status, although to a lesser extent than Gold’s. As a yieldless asset, Silver tends to rise with lower interest rates. Its moves also depend on how the US Dollar (USD) behaves as the asset is priced in dollars (XAG/USD). A strong Dollar tends to keep the price of Silver at bay, whereas a weaker Dollar is likely to propel prices up. Other factors such as investment demand, mining supply – Silver is much more abundant than Gold – and recycling rates can also affect prices.
Silver is widely used in industry, particularly in sectors such as electronics or solar energy, as it has one of the highest electric conductivity of all metals – more than Copper and Gold. A surge in demand can increase prices, while a decline tends to lower them. Dynamics in the US, Chinese and Indian economies can also contribute to price swings: for the US and particularly China, their big industrial sectors use Silver in various processes; in India, consumers’ demand for the precious metal for jewellery also plays a key role in setting prices.
Silver prices tend to follow Gold’s moves. When Gold prices rise, Silver typically follows suit, as their status as safe-haven assets is similar. The Gold/Silver ratio, which shows the number of ounces of Silver needed to equal the value of one ounce of Gold, may help to determine the relative valuation between both metals. Some investors may consider a high ratio as an indicator that Silver is undervalued, or Gold is overvalued. On the contrary, a low ratio might suggest that Gold is undervalued relative to Silver.
A continuation of the rally will be signaled on a move above yesterday’s high of 75.19. However, there is another potential resistance zone a little higher from around 75.78 to 76.47. It is important to recognize that the potential resistance zone is a confluence zone that includes the 200-Day MA at 75.85 and the 78.6% retracement level at 76.57.
Further, the 200-Day line has recently converged with the bottom boundary line of a large symmetrical triangle pattern. It is interesting that the rising trendline and 200-Day line have converged now that crude is approaching that price zone. This could represent more significant resistance than what has been seen so far during the rally since the lines have lined up.
Momentum, as shown in the relative strength index (RSI) oscillator can also be considered. Note that the indicator has reached its highest reading since April last year and it has not yet gone into overbought territory, above 70. This shows strength in demand and provides supporting evidence for further strengthening. A rise above a 70 reading will put the indicator into overbought territory as the price of crude oil is approaching the next higher resistance zone. Notice that that last overbought readings were in April 2024.
Despite the above potential bullish short-term thesis, resistance may continue to stop the ascent near current prices and lead to a pullback. In that scenario a decline below today’s low of 73.29 is a sign of weakness. Key price levels to watch for support would then include the interim swing high at 71.79 and the 20-Day MA, now at 70.94.
For a look at all of today’s economic events, check out our economic calendar.
The decline today triggered a bearish daily reversal on a drop below yesterday’s low of 3.50. And it sets up a potential continuation move to the downside as today’s high generated a lower swing high. Of course, follow through will be key. Note that natural gas may end the day below the 20-Day MA for only the second time since the 20-Day line was reclaimed in October. The first time was Friday. That information combined with today’s bearish reversal shows declining demand for natural gas and sellers getting more aggressive.
The two key near-term price levels for natural gas are today’s high at 3.74, also a swing high, and last Friday’s low at 3.33, also a swing low. A rise above the 3.74 swing high would trigger a bullish reversal and show strength that may grow. Until then it looks like price behavior may be signaling a deeper correction. A drop below today’s low signals a weakness, with a bearish trend continuation signal generated on a drop below last week’s low of 3.33.
Having said that, the recent trend high of 4.20 did reach a potential target zone that included the top channel line of a rising trend. Sellers clearly took back control from there leading to the first leg down (AB) from the top. It was followed by a two-day advance (BC) that likely ended today. This puts natural gas in prime position to keep falling. However, support levels noted above need to be broken first. As of today, the bearish correction has moved into the second leg down in a declining ABCD pattern.
For a look at all of today’s economic events, check out our economic calendar.
Spot Gold extended its gains beyond the $2,600 mark early on Tuesday, as investors turned cautious ahead of United States (US) first-tier data. XAU/USD changed course and trimmed most of its intraday gains after the country reported that the ISM Services Purchasing Managers’ Index (PMI) jumped to 54.1 in December from the previous 52.1. Additionally, the number of job openings on the last business day of November stood at 8.09 million, according to the Job Openings and Labor Turnover Survey (JOLTS), beating expectations and improving from the 7.83 million posted in October.
The US Dollar (USD) jumped with the news as stock markets turned south, with Wall Street dipping in the red, as the news spooked further away the odds for a Federal Reserve (Fed) interest rate cut. According to the CME FedWatch Tool, market participants no longer fully price in a Fed rate cut before July.
The same dismal mood prevents Gold from falling harder. The bright metal hovers around $2,650 in the mid-American session amid fresh safety demand.
Market players will now turn their eyes to US employment-related data, as the country will release the December ADP Employment Change report on Wednesday, ahead of Nonfarm Payrolls (NFP) figures on Friday.
The daily chart for the XAU/USD pair shows its neutral-to-bullish. Technical indicators stand directionless at around their midlines, while the bright metal seesaws around a flat 20 Simple Moving Average (SMA). Meanwhile, the 100 SMA keeps heading north, providing dynamic support at around $2,626.30, while the 200 SMA also retains its upward slope, albeit roughly $200 below the current level.
In the near term, and according to the 4-hour chart, Gold’s rally seems to be losing steam. XAU/USD still holds above all its moving averages, with the 20 SMA aiming to cross above the 200 SMA after already surpassing the 100 SMA. Technical indicators, on the other hand, turned modestly lower, although the Relative Strength Index (RSI) indicator holds at around 58, limiting the bearish potential of the pair.
Support levels: 2,626.30 2,614.45 2,596.00
Resistance levels: 2,649.50 2,665.10 2,678.85
The natural gas market has dropped a bit during the early hours on Tuesday as we continue to see a lot of noisy and choppy behavior. This does make a certain amount of sense because we are seeing a lot of cold weather issuance in the United States and I can tell you as somebody who lives in that part of the world, it is very cold right now. However, this is also a temporary thing. So, it becomes part of the cyclical trade. That’s really all it is.
Short-term pullbacks, I do think, have plenty of support underneath, especially near the 3.40 level. But I also would watch the four handle, because if we can break above there, then it’s likely that natural gas will go racing higher, perhaps to 4.5, maybe even 5.00. So, with all of that being said, I think this is a market that you remember the dips as buying opportunities, but you do have to pay attention to that 50-day EMA right around 3.20. As that rises, it creates a higher floor in the market. But sooner or later, we start to think about the idea of winter being over.
Silver price (XAG/USD) extends its winning streak for the fourth successive day, trading around $30.20 per troy ounce during the European hours on Tuesday. The price of the dollar-denominated grey metal gains momentum as a weaker US Dollar (USD) makes it more affordable for buyers using foreign currencies, thereby boosting Silver demand.
The US Dollar Index (DXY), which tracks the USD’s performance against six major currencies, remains under pressure for the third straight session following reports that the incoming Trump administration might adopt a more targeted approach in applying tariffs. The DXY falls to near 108.00 at the time of writing.
However, Trump refuted a Washington Post report suggesting his team was considering limiting the scope of his tariff plan to only cover specific critical imports. The US Dollar may find some support following President-elect Donald Trump’s comments that his tariff policy will not be scaled back.
US ISM Services Purchasing Managers Index (PMI) is set to be released on Tuesday. On Wednesday, markets will focus on the Minutes from the Federal Reserve’s (Fed) December policy meeting. Investors will closely monitor the US employment data for December, which is due later on Friday. This report could offer some hints about the Fed’s interest rate outlook in 2025.
Silver demand was further bolstered by a positive economic outlook in China, the world’s largest consumer of the metal. Beijing recently committed to adopting “more proactive” macroeconomic policies and lowering interest rates this year to drive economic growth.
Silver is a precious metal highly traded among investors. It has been historically used as a store of value and a medium of exchange. Although less popular than Gold, traders may turn to Silver to diversify their investment portfolio, for its intrinsic value or as a potential hedge during high-inflation periods. Investors can buy physical Silver, in coins or in bars, or trade it through vehicles such as Exchange Traded Funds, which track its price on international markets.
Silver prices can move due to a wide range of factors. Geopolitical instability or fears of a deep recession can make Silver price escalate due to its safe-haven status, although to a lesser extent than Gold’s. As a yieldless asset, Silver tends to rise with lower interest rates. Its moves also depend on how the US Dollar (USD) behaves as the asset is priced in dollars (XAG/USD). A strong Dollar tends to keep the price of Silver at bay, whereas a weaker Dollar is likely to propel prices up. Other factors such as investment demand, mining supply – Silver is much more abundant than Gold – and recycling rates can also affect prices.
Silver is widely used in industry, particularly in sectors such as electronics or solar energy, as it has one of the highest electric conductivity of all metals – more than Copper and Gold. A surge in demand can increase prices, while a decline tends to lower them. Dynamics in the US, Chinese and Indian economies can also contribute to price swings: for the US and particularly China, their big industrial sectors use Silver in various processes; in India, consumers’ demand for the precious metal for jewellery also plays a key role in setting prices.
Silver prices tend to follow Gold’s moves. When Gold prices rise, Silver typically follows suit, as their status as safe-haven assets is similar. The Gold/Silver ratio, which shows the number of ounces of Silver needed to equal the value of one ounce of Gold, may help to determine the relative valuation between both metals. Some investors may consider a high ratio as an indicator that Silver is undervalued, or Gold is overvalued. On the contrary, a low ratio might suggest that Gold is undervalued relative to Silver.
Copper prices saw impressive gains in 2024, even breaking the US$5 per pound mark in May. However, the red metal’s gains didn’t last, and by the end of the year copper had retreated back to the US$4 range.
The start of 2025 could be eventful, with Donald Trump returning to the Oval Office, a new stimulus package coming into effect in China and a continued push for greener technologies around the world.
What will these factors mean for copper prices in the new year? Will they rise, or can investors expect the base metal to remain rangebound? Here’s a look at what experts see coming for the important commodity.
Trump will be sworn in for his second term as US president on January 20.
During his campaign, he made bold promises that could shake up the American resource sector, pushing a “drill, baby, drill” mantra and committing to increasing oil production in the country.
When it comes to copper, Trump’s proposed changes to environmental regulations could have key implications. While the Biden administration has sought to toughen these rules, Trump will look to relax them.
In an email to the Investing News Network (INN), Eleni Joannides, Wood Mackenzie’s research director for copper, said changes to environmental regulations are likely to benefit the mining sector overall.
“The former president has already pledged to overturn a 20 year moratorium on mining in Northern Minnesota. This pro-mining approach means more mines could be permitted and put into production,” she said.
One project that was being planned before the Biden administration restricted access to federal lands in the Superior National Forest belongs to Twin Metals Minnesota, a subsidiary of Antofagasta (LSE:ANTO,OTC Pink:ANFGF). The company has been working to advance its underground copper, nickel, cobalt and platinum-metals group project since 2006, and has submitted plans to state and federal regulatory agencies.
Another copper-focused project that may benefit from the incoming Trump administration is Northern Dynasty Minerals’ (TSX:NDM,NYSEAMERICAN:NAK) controversial Pebble project in Alaska.
The company has been exploring the Bristol Bay region since acquiring the property in 2001, but the US Army Corps of Engineers denied approval in 2020; the Environmental Protection Agency did the same in 2021.
Northern Dynasty has been fighting these decisions at both the state and federal level. It reached the Supreme Court in January 2024, but was denied a hearing until the dispute is examined at the state level.
On December 20, Alaska Governor Mike Dunleavy added his support for the project when he petitioned the incoming president to issue an Alaska-specific executive order on his first day in office. The order would effectively reverse decisions made by the Biden administration, including the permitting of the Pebble project.
In addition to Pebble, projects like Rio Tinto (ASX:RIO,NYSE:RIO,LSE:RIO) and BHP’s (ASX:BHP,NYSE:BHP,LSE:BHP) Resolution, and Hudbay Minerals’ (TSX:HBM,NYSE:HBM) Copper World, both of which are in Arizona, may benefit from Trump’s plan to reduce permitting times on projects worth over US$1 billion.
Currently, large-scale operations like these can take up to 20 years to move from exploration to production in the US. Copper is considered a critical mineral for the energy transition, and is increasingly becoming a security concern as the US is largely dependent on China for its supply of copper.
As tensions continue to grow between the west and eastern nations like China and Russia, it may not take much to threaten markets for critical materials, including copper.
Trump has already promised to impose a 60 percent tariff on all goods coming from China.
A tariff on copper imports could upend the president-elect’s plans for the resource sector. It would increase the prices of copper imports and disrupt the overall economy.
“The risk is that the president-elect’s threatened tariffs, including 60 percent on China and 20 percent on all other nations, could derail global economic growth, lead to higher inflation and, with that, tighten monetary policy and also lead to a change in trade flows. Copper will suffer if demand takes a hit,” Joannides said.
“In addition, there is likely to be continued volatility in prices,” she added.
In its recent analysis of Trump’s policies, ING sees an overall negative impact on global metals demand.
The firm believes that many of his plans, including tariffs, will cause the US Federal Reserve take a longer-term approach to reducing interest rates, which could affect investment in large-scale copper projects.
S&P Global expressed a similar view after Trump’s win. Immediately after the election, copper prices sank 4 percent to fall under US$4.30, with the firm suggesting that is likely just the beginning. The organization notes that while the market may have already priced in Trump’s tariffs, a larger trade war could impact prices even further.
China’s faltering economy has been a major headwind for copper over the past several years.
The country’s housing market accounts for roughly 30 percent of global demand for the red metal, meaning that any shifts could have significant implications for the copper market.
The sector has been struggling for the past few years as the country deals with economic issues, including fallout from the COVID-19 pandemic, which caused disruptions to supply chains and a spike in unemployment.
Ultimately, economic factors struck China’s real estate sector, an important driver of the country’s gross domestic product; this caused the collapse of the nation’s top two developers, China Evergrande Group and Country Garden.
So far, the government’s attempts to stimulate the economy and jumpstart the beleaguered real estate sector have largely failed. In September, it announced measures aimed at property buyers, such as reducing interest rates for existing mortgages by 50 points and cutting the minimum downpayment requirement for homes to 15 percent.
Other changes introduced at the time include more help from the People’s Bank of China, which will provide a lending facility for state-owned firms to acquire unsold flats for affordable housing.
China followed this up with an announcement in November that it will provide additional support for local governments by increasing their debt-raising capacity by 6 trillion yuan over the next six years.
While these measures may not be felt for some time, kickstarting the Asian nation’s real estate sector could be a boon for copper producers and investors.
“If the Chinese real estate market were to post a recovery, this would see domestic demand for copper tick higher and could lead to a tighter supply and demand balance overall assuming all other things remain unchanged. This would underpin even higher prices than we are currently projecting,” said Joannides.
With copper demand projected to grow long term, supply-side concerns are rising. According to Joannides, there is already recognition that copper exploration has been underinvested over the past few years.
“We are seeing signs this could change. Much of the growth over the last five years has come from brownfield expansions rather than greenfield/new discoveries,” she explained to INN.
“Technology will likely help increase the chance of discovery, and broadly I would say that policymakers are now more supportive of mineral exploration as the push to secure critical raw materials supply has moved up the agenda.”
Joannides pointed to greenfield projects already in the pipeline, including Capstone Copper’s (TSX:CS,OTC Pink:CSCCF) Santo Domingo in Chile, Southern Copper’s (NYSE:SCCO) Tia Maria in Peru and Teck Resources’ (TSX:TECK.A,TECK.B,NYSE:TECK) Zarfanal in Peru.
There’s also Northmet, a Teck and Glencore (LSE:GLEN,OTC Pink:GLCNF) joint venture in Minnesota.
Rising copper prices could also increase the flow of money from the major companies into the junior space, where most of the exploration is currently occurring.
“Copper has become the standout strategic preference for the major mining companies. The risk-adjusted cost of developing organic copper assets is higher than the cost of acquiring them,” Joannides said.
This kind of acquisition activity could help reduce the development time of assets compared to companies starting exploration from scratch.
While copper supply and demand conditions are expected to remain tight in 2025, competing forces are at play.
One of the biggest factors is Trump’s return to the White House. If the president-elect takes action as quickly as he has promised, investors could soon gain insight on the long-term implications of his policies.
In terms of China, it will take time to get the property sector back to where it was before the pandemic; however, there may be sparks early in the year as new measures start to work their way through the market.
During 2025 it may be even more prudent than usual for investors to do their due diligence on copper and keep an eye on the forces that may affect the market.
Don’t forget to follow us @INN_Resource for real-time news updates!
Securities Disclosure: I, Dean Belder, hold shares of Northern Dynasty Minerals.
Editorial Disclosure: Los Andes Copper, Osisko Metals and Quetzal Copper are clients of the Investing News Network. This article is not paid-for content.
The Investing News Network does not guarantee the accuracy or thoroughness of the information reported in the interviews it conducts. The opinions expressed in these interviews do not reflect the opinions of the Investing News Network and do not constitute investment advice. All readers are encouraged to perform their own due diligence.
The views and opinions expressed herein are the views and opinions of the author and do not necessarily reflect those of Nasdaq, Inc.
Our platinum price prediction for 2025 is mildly bullish. Platinum is forecasted to move between lows of $880 and highs of $1,250. Platinum will only exceed $1,250 in case of stronger than expected industrial demand.
RELATED – Platinum Price Seasonality Charts Suggest An End Of Year Rally Could Be Underway?
Platinum, often referred to as a “precious metal with industrial strength,” is expected to significantly lag the yellow metal (gold) and grey metal (silver).
Platinum has unique properties and market dynamics that make it a fascinating case for analysis. However, the chart and leading indicator don’t look overly fascinating when it comes to price expectations in 2025.
Ultimately, however, platinum should react to the upside at a later stage in a matured gold and silver bull market. That might be in 2026 or 2027.
Platinum has a track record of following gold and silver, during a precious metals bull market, but as the laggard.
In this article, we explore key factors influencing platinum prices in order to conclude with a platinum price prediction for 2025 based on various scenarios.
As we approach 2025, it’s crucial to understand where platinum currently stands.
In 2024, platinum experienced a relatively volatile year with supply constraints driven by:
Those factors led to significant price movements.
The metal traded within a range, showing resilience but also facing headwinds from broader macroeconomic uncertainties.
Needless to say, as these factors may continue to influence the platinum market, we have to factor this in when analyzing the platinum price prediction scenarios for 2025.
Platinum’s supply is heavily concentrated, with South Africa accounting for nearly 70% of global production. This heavy reliance on a single region makes the platinum supply chain highly vulnerable to localized disruptions.
In recent years, factors such as labor strikes, energy shortages, and regulatory changes have impacted production levels, leading to supply squeezes.
These issues are likely to persist into 2025, keeping supply relatively tight.
On the demand side, platinum plays a crucial role in various industries.
The automotive sector is a significant consumer of platinum, primarily for catalytic converters in hybrid vehicles and the emerging hydrogen fuel cell market.
While the push towards green energy and decarbonization is expected to boost demand for platinum in hydrogen-related technologies, it is also clear that this green energy space has been tremendously weak in 2024.
Here is an illustration of an industrial trend that may potentially serve as a catalyst on platinum’s demand side – Hybrid cars throw lifeline to platinum metals:
Additionally, platinum is used in jewelry, electronics, and as a catalyst in various chemical processes, further diversifying its demand base.
Platinum is increasingly seen as a strategic investment asset.
Compared to gold and silver, platinum has a smaller market and often exhibits more volatility.
The green energy transition is a significant factor to watch. The use of platinum in hydrogen fuel cells and electrolysis processes is expected to grow as countries push towards carbon neutrality.
This shift could provide tailwinds for platinum demand in the coming years but only once strength returns in the green energy sector.
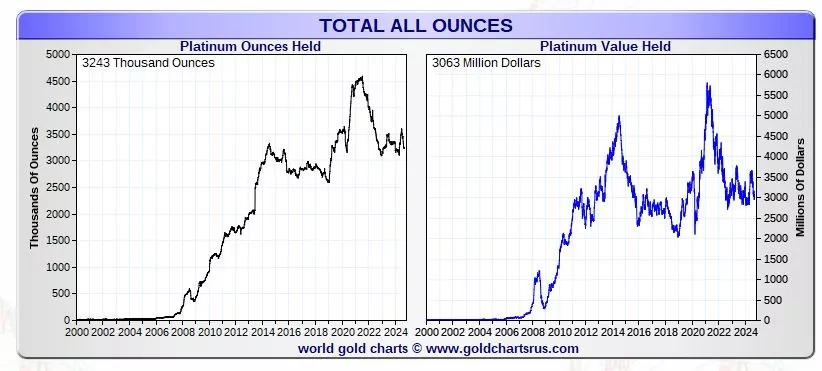
More important for now are trends in platinum exchange-traded fund (ETF) holdings.
As seen below, there is a very strong correlation between the price of platinum and platinum ounces held in ETFs, particularly since 2009. No surprise, in recent years total ounces held in ETFs are flat, similar to platinum’s price.
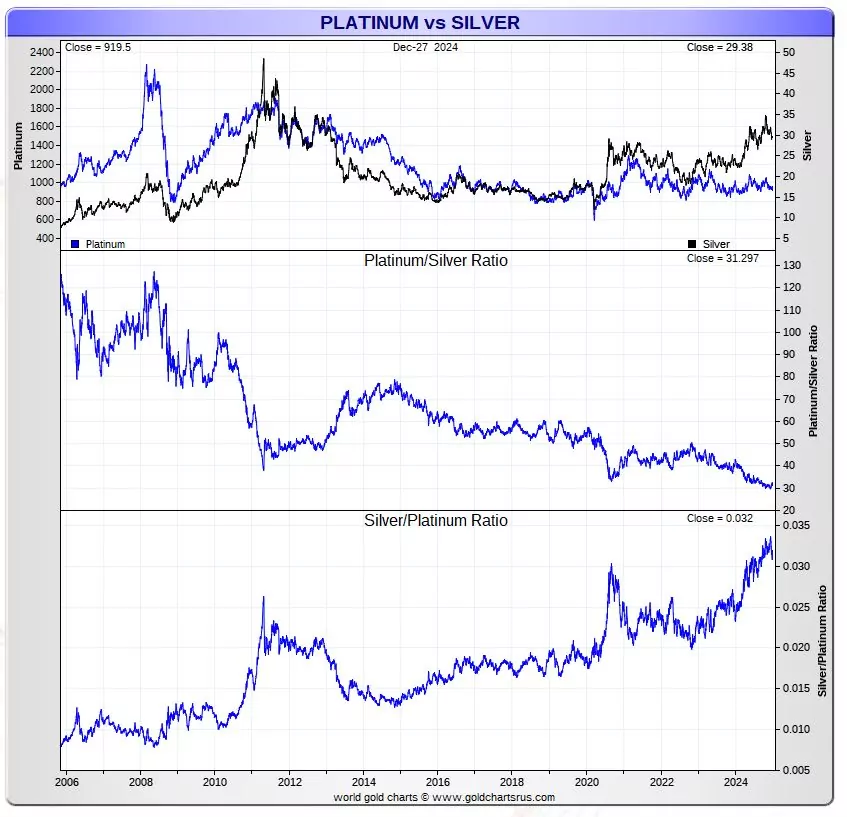
Platinum and silver, while both considered precious metals, often exhibit different price dynamics.
However, there is a historical correlation between the two, particularly during precious metals bull markets. Silver’s dual role as an industrial metal and a store of value can influence platinum prices.
Silver and platinum started diverging in 2024, as seen below, after they were strongly correlated between 2012 and 2023.
Our suspicion is that silver will need to stage a strong bull run before platinum will be ‘FOMOed’, and restore the decade long correlation.
January 3d – Platinum is weakening relative to silver. This relative underperformance may last for a little longer but history has shown that platinum will follow silver at some point in time. With a long term bullish silver prediction we believe platinum will also react to the upside although this may after 2025.
In 2025, if silver enters a strong bull market due to factors like inflation hedging, increased industrial demand, or speculative buying, platinum could benefit from a similar uptick in interest.
Monitoring the correlation between these two metals could offer valuable insights for investors considering platinum.
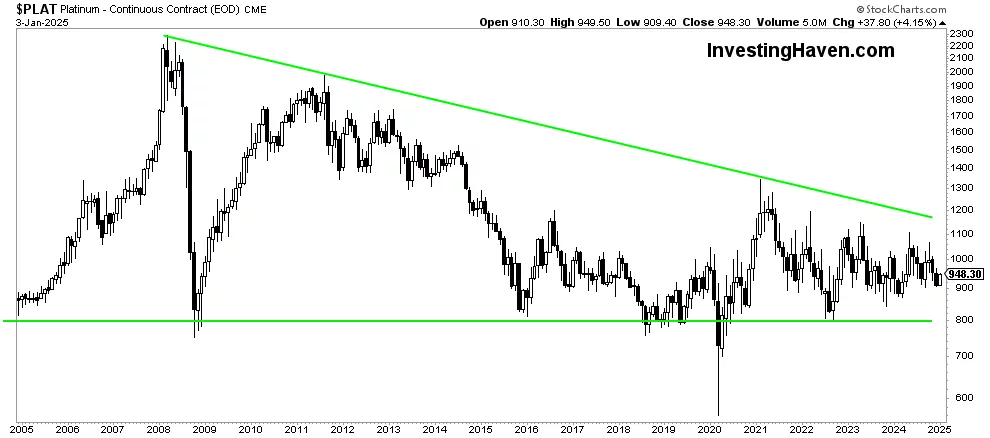
The secular platinum price chart has a long term triangle structure as seen on below chart.
The only positive attribute of this chart pattern is the higher highs in the last 2 years.
Until and unless $1,250 is cleared, there is no bull market in platinum.
January 3d – The long term chart pattern on platinum’s price chart starts looing pretty bullish. The triangle is bullish. It may take many months (even quarters) until the bullish nature of this pattern materializes. For a confirmed bullish breakout the following conditions need to be in place: platinum needs to move above the long term falling trendline, remain there for at least 3 months with closing prices above the falling trendline.
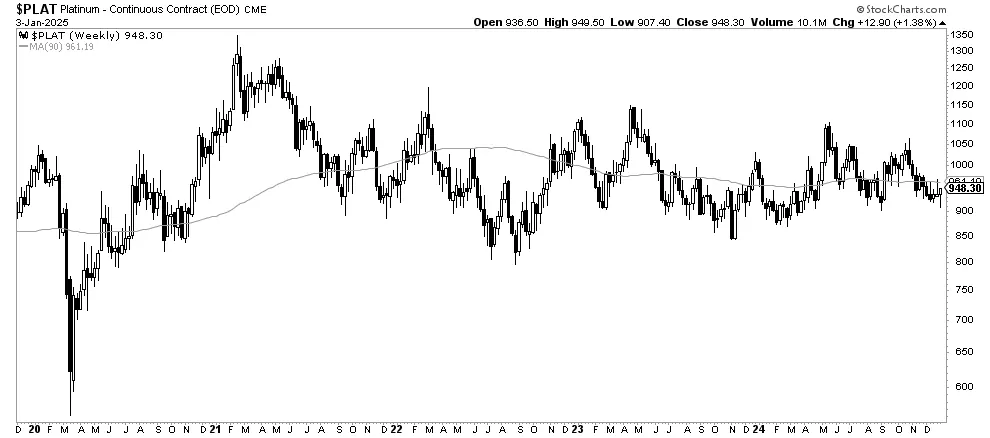
The weekly platinum price chart with its 90 week moving average illustrates our point made above.
January 3d – The consolidation on platinum’s weekly chart is orderly. In fact, this consolidation starts looking very bullish. When combining the data outlined above with the consolidation shown below, we conclude that any catalyst can spark a fire on the platinum chart. There has to be a demand side catalyst in 2025 though.
Based on the factors discussed, we can outline several potential scenarios for platinum prices in 2025:
This is our expected platinum price prediction scenario. Platinum prices remain relatively stable, trading sideways. The market could see moderate growth in demand from green energy technologies. It will not be enough to cause a significant price surge. Probability: 45%.
Should the green energy space become attractive again from an investing perspective, platinum prices could rise to around $1,250 per ounce. This scenario assumes steady supply-side challenges. It also suggests a moderate increase in investment demand. Probability: 35%.
In a highly optimistic case, a strong surge in demand could see platinum prices reaching $1,500 per ounce. Even in case the price of silver would rise strongly, which would be consistent with our silver forecast, we believe platinum will be lagging until 2026 or 2027. Probability: 10%.
Conversely, if demand growth weakens, platinum prices could drop below $800 per ounce. Probability: 10%.
Platinum’s price outlook for 2025 is shaped by a combination of supply constraints, growing demand from green energy sectors, investor sentiment, platinum ETF demand, and its correlation with silver.
The market presents several potential scenarios, ranging from sideways trading to a significant price rally or decline.
As always, investors should keep an eye on the evolving dynamics of the platinum market, especially its relationship with silver and its role in the green energy transition, to make informed investment decisions.
Gold price is battling the short-term critical barrier at around $2,635 early Tuesday, consolidating the two-day corrective decline from three-week highs of $2,665. Gold traders refrain from placing fresh directional bets ahead of the top-tier US ISM Services PMI and JOLTS Job Openings data.
Despite Monday’s two-way price movement, Gold price remains confined in a familiar range as traders weigh the latest reports surrounding incoming US President Donald Trump’s tariff plans and the US economic data releases for a clear direction heading into Friday’s US Nonfarm Payrolls data release.
Gold price reversed the Asian bounce and fell as low as $2,615 in the European session on Monday on fading China’s stimulus optimism and sagging physical Gold demand from India. The rising domestic Gold prices due to the depreciation of the Indian Rupee (INR) to record low dampened demand for the bright metal from the world’s no. 2 Gold consumer.
Further, Goldman Sachs pushed back its forecast of Gold reaching $3,000 per ounce, initially expected by the end of 2025. This also exerted downward pressure on Gold price.
However, Gold price found fresh buyers in American trading after the US Dollar (USD) fell steeply across the board following a report from the Washington Post (WaPo) that Trump’s aides were exploring plans that would apply tariffs only on sectors seen as critical to US national or economic security.
Trump quickly denied the report in a post on his Truth Social platform, which allowed the Greenback to recover some ground, prompting Gold price to settle in the red.
Later this Tuesday, speculations around Trump’s tariff plans, the US jobs data and the broader market sentiment will play a pivotal role in the Gold price action. Meanwhile, a speech by Richmond Federal Reserve (Fed) President Thomas Barkin on the economic forecast will be closely scrutnized for gauging the Fed next policy move.
The daily chart shows that the 14-day Relative Strength Index (RSI) trades listlessly at the 50 level, leaving Gold price gyrating in a narrow range.
In doing so, Gold price clings to the 21-day Simple Moving Average (SMA) at $2,636 after failing to sustain above it on a daily closing basis on Monday.
The immediate support is now seen at the 100-day SMA at $2,627, below which the door will open for a retest of the previous week’s low of $2,596.
Ahead of that, the previous day’s low of $2,615 will offer some support to Gold buyers.
If Gold buyers regain control above the 50-day SMA barrier at $2,648, the next relevant topside barrier is seen at the three-week high of $2,665.
Further up, the $2,700 level will challenge bearish committments.
JOLTS Job Openings is a survey done by the US Bureau of Labor Statistics to help measure job vacancies. It collects data from employers including retailers, manufacturers and different offices each month.