The main tag of GoldPrice Articles.
You can use the search box below to find what you need.
[wd_asp id=1]
The main tag of GoldPrice Articles.
You can use the search box below to find what you need.
[wd_asp id=1]
Gold price is miring in five-day lows near $2,730 in Asian trading on Tuesday, lacking a clear direction. Traders remain wary and refrain from placing fresh bets on Gold price on the US presidential election day.
Gold price has entered a phase of downside consolidation, following its slump from all-time highs of $2,790 reached last Thursday, in the face of resurgent US Dollar (USD) demand. The Greenback jumped back into the bid, capitalizing on the Trump trade optimism.
Until last week, markets were pricing in a Republican nominee Donald Trump victory in the presidential race. They believed Trump’s policies on immigration, tax cuts and tariffs would put upward pressure on inflation, bond yields and the USD while a policy continuity is seen on a Harrish win.
However, the tide turned against the USD on Monday as traders resorted to the unwinding of the Trump trade, as the latest polls released over the weekend showed that US Democratic presidential candidate Kamala Harris surpassed Donald Trump in a new poll in Iowa, marking a notable turnaround.
Harris and Trump are seen locked in a tight race for the White House.
Early Tuesday, the latest developments around the US election show that former president Donald Trump is leading Vice President Harris in each of the seven swing states though the margin is narrow. The AtlasIntel survey said Trump is holding the widest margin in Arizona, with a 52.3% to Harris’ 45.8%.
This update seems to have helped the Greenback pause its downside, keeping the USD-denominated Gold price on the edge. Further, expectations of a less aggressive easing cycle by the US Federal Reserve (Fed) also lend support to the USD.
Besides, the uncertainty surrounding the US election outcome, markets also take account of the ongoing Middle East conflict between Israel and Iran.
The Israeli military said that it had killed a commander of Hezbollah’s Nasser Brigade rocket unit in southern Lebanon. In response, Hezbollah announced it launched a “large rocket salvo” targeting the northern Israeli city of Safed, marking an escalation in cross-border tensions.
If the geopolitical tensions escalate further, investors are likely to scurry to the traditional safe-haven Gold price, cushioning its downside.
However, the sentiment around the US election is expected to play a pivotal role in the Gold price action in the upcoming days.
As observed on the daily chart, Gold price challenges the key $2,730 demand area as sellers retain control.
The 14-day Relative Strength Index (RSI) is edging slightly lower to near 59, justifying the latest downtick in Gold price.
However, the leading indicator continues to hold above the 50 level, keeping the buying interest somewhat alive.
Gold buyers need to reclaim the $2,746 resistance on a daily closing basis to resume its uptrend. That level is the 23.6% Fibonacci Retracement (Fibo) level of the latest record rally from the October 10 low of $2,604 to the new all-time high of $2,790.
The next bullish target is seen at the record high of $2,790.
Conversely, a sustained move below $2,730 will expose the 38.2% Fibo support at $2,718.
Acceptance below that level on a daily candlestick closing basis could challenge the $2,700 confluence zone, where the 50% Fibo level of the same ascent and the 21-day Simple Moving Average (SMA) close in.
Additional declines will call for a test of the 61.8% Fibo support at $2,673.
Gold has played a key role in human’s history as it has been widely used as a store of value and medium of exchange. Currently, apart from its shine and usage for jewelry, the precious metal is widely seen as a safe-haven asset, meaning that it is considered a good investment during turbulent times. Gold is also widely seen as a hedge against inflation and against depreciating currencies as it doesn’t rely on any specific issuer or government.
Central banks are the biggest Gold holders. In their aim to support their currencies in turbulent times, central banks tend to diversify their reserves and buy Gold to improve the perceived strength of the economy and the currency. High Gold reserves can be a source of trust for a country’s solvency. Central banks added 1,136 tonnes of Gold worth around $70 billion to their reserves in 2022, according to data from the World Gold Council. This is the highest yearly purchase since records began. Central banks from emerging economies such as China, India and Turkey are quickly increasing their Gold reserves.
Gold has an inverse correlation with the US Dollar and US Treasuries, which are both major reserve and safe-haven assets. When the Dollar depreciates, Gold tends to rise, enabling investors and central banks to diversify their assets in turbulent times. Gold is also inversely correlated with risk assets. A rally in the stock market tends to weaken Gold price, while sell-offs in riskier markets tend to favor the precious metal.
The price can move due to a wide range of factors. Geopolitical instability or fears of a deep recession can quickly make Gold price escalate due to its safe-haven status. As a yield-less asset, Gold tends to rise with lower interest rates, while higher cost of money usually weighs down on the yellow metal. Still, most moves depend on how the US Dollar (USD) behaves as the asset is priced in dollars (XAU/USD). A strong Dollar tends to keep the price of Gold controlled, whereas a weaker Dollar is likely to push Gold prices up.
A better market mood left XAU/USD trading lifeless on Monday. Gold hovers around Friday’s close at $2,736 a troy ounce, as investors preferred high-yielding assets. Bets on who will become the 47th United States (US) president set the market’s tone. Market participants evaluate whether the Federal Reserve (Fed) would be able to keep loosening the monetary policy or if the central bank will have to battle again increasing price pressures. Americans will go to the polls on Tuesday, with some initial results expected for early Wednesday.
Stock markets trade mixed, with the Nikkei 225 posting sharp losses but the rest of the Asian indexes closing in the green. In Wall Street, however, the three major indexes accelerated south after a mixed opening, as concerns pushed investors back into safety.
This week, besides the US election, will feature central banks’ monetary policy announcements. The Reserve Bank of Australia (RBA) will unveil its decision on Tuesday, while the Bank of England (BoE) and the Federal Reserve (Fed) will do so on Thursday.
As the US session develops, the US Dollar gathers strength amid mounting risk-aversion, although XAU/USD holds in range.
The daily chart for the XAU/USD pair shows easing bullish momentum, although the risk remains skewed to the upside. The pair keeps developing above bullish moving averages, with the 20 Simple Moving Average (SMA) providing dynamic support at around $2,705.00. The 100 and 200 SMAs accelerated north well below the shorter one, reflecting buyers’ strength. Finally, technical indicators turned marginally lower but remain well above their midlines, hinting at a limited bearish potential.
In the near term, and according to the 4-hour chart, on the contrary, sellers are in control. Technical indicators turned firmly lower within negative levels, while the 20 SMA accelerates south above the current level. The 100 and 200 SMAs maintain their upward slopes below the current price, yet another leg south seems likely should XAU/USD break below $2,730, the immediate support area.
Support levels: 2,730.00 2,718.35 2,705.00
Resistance levels: 2,747.75 2,760.40 2,772.50
Since today’s bullish reversal followed a successful test of support around the short-term 20-Day MA trend indicator earlier in the session, the bearish correction should be complete. Notice that today’s low of 2.51 was a little below the 20-Day line and approaching the 50-Day MA along with the 61.8% Fibonacci retracement at 2.48. Further, an original trendline starting from the 2023 peak has been redrawn on the chart as a dotted blue line. Notice that it identified support for today and provides an additional clue pointing to a likely pullback bottom.
The 20-Day MA is a key near-term trend indicator. Since a successful test of support around the line was completed today, the bullish outlook for natural gas has improved. The question now is whether strong demand as seen today can be sustained to eventually challenge the top boundary line of a large symmetrical triangle formation, and possibly break out?
Recently, two attempts to break up through the top line failed and subsequently led to a pullback. The current advance is rising off a successful test of support around the 200-Day MA following a swing low of 2.21, which is bullish behavior. Moreover, the relationship with the 20-Day MA further confirms improving underlying demand.
A rise above the recent high of 2.92 will trigger the next upside breakout attempt from the triangle consolidation formation. That would indicate that natural gas has risen above the top boundary line of the pattern. Subsequently, there are prior swing highs at 3.02, 3.16, and 3.39. Each marks a potential pivot level where resistance may be seen, or an upside breakout indicates the continuation of strength. Two rising ABCD patterns, one in orange and the other purple, point to potential initial upside targets at 3.35 and 3.45, respectively.
For a look at all of today’s economic events, check out our economic calendar.
Silver price (XAG/USD) soars to near $33.00 in Monday’s North American session. The white metal strengthens as US Treasury yields dive, with investors turning anxious ahead of the United States (US) presidential elections on Tuesday.
10-year US Treasury yields plummet to near 4.27%. Lower yields on interest-bearing assets reduce the opportunity cost of holding an investment in non-yielding assets, such as Silver. The US Dollar Index (DXY), which gauges Greenback’s value against six major currencies, slumps to near 10.70, the lowest level seen in two weeks.
The uncertainty over US elections deepened after the Des Moines Register/Mediacom Iowa Poll, which showed current Vice President Kamala Harris is up three points on Trump in the state, Reuters reported. This has appeared a major shift in market expectations, which were pointing to Trump’s victory.
This week, investors should be prepared for more volatility that will come from Federal Reserve (Fed) monetary policy, which will be announced on Thursday. According to the CME FedWatch tool, the central bank is widely anticipated to cut interest rates by 25 basis points (bps) to 4.50%-4.75%. This will be the second interest rate cut by the Fed in a row, however, the pace will be slower as policymakers voted a bigger rate cut of 50 bps in September.
Silver price discovers strong buying interest near the key horizontal support plotted from the May 20 high of $32.50 on a daily timeframe, which acted as resistance earlier. The white metal finds a temporary cushion near the 20-day Exponential Moving Average (EMA), which trades at around $32.80.
The 14-day Relative Strength Index (RSI) falls inside the 40.00-60.00 range, suggesting that a bullish momentum is over for now, however, the bullish trend remains intact.
Silver is a precious metal highly traded among investors. It has been historically used as a store of value and a medium of exchange. Although less popular than Gold, traders may turn to Silver to diversify their investment portfolio, for its intrinsic value or as a potential hedge during high-inflation periods. Investors can buy physical Silver, in coins or in bars, or trade it through vehicles such as Exchange Traded Funds, which track its price on international markets.
Silver prices can move due to a wide range of factors. Geopolitical instability or fears of a deep recession can make Silver price escalate due to its safe-haven status, although to a lesser extent than Gold’s. As a yieldless asset, Silver tends to rise with lower interest rates. Its moves also depend on how the US Dollar (USD) behaves as the asset is priced in dollars (XAG/USD). A strong Dollar tends to keep the price of Silver at bay, whereas a weaker Dollar is likely to propel prices up. Other factors such as investment demand, mining supply – Silver is much more abundant than Gold – and recycling rates can also affect prices.
Silver is widely used in industry, particularly in sectors such as electronics or solar energy, as it has one of the highest electric conductivity of all metals – more than Copper and Gold. A surge in demand can increase prices, while a decline tends to lower them. Dynamics in the US, Chinese and Indian economies can also contribute to price swings: for the US and particularly China, their big industrial sectors use Silver in various processes; in India, consumers’ demand for the precious metal for jewellery also plays a key role in setting prices.
Silver prices tend to follow Gold’s moves. When Gold prices rise, Silver typically follows suit, as their status as safe-haven assets is similar. The Gold/Silver ratio, which shows the number of ounces of Silver needed to equal the value of one ounce of Gold, may help to determine the relative valuation between both metals. Some investors may consider a high ratio as an indicator that Silver is undervalued, or Gold is overvalued. On the contrary, a low ratio might suggest that Gold is undervalued relative to Silver.

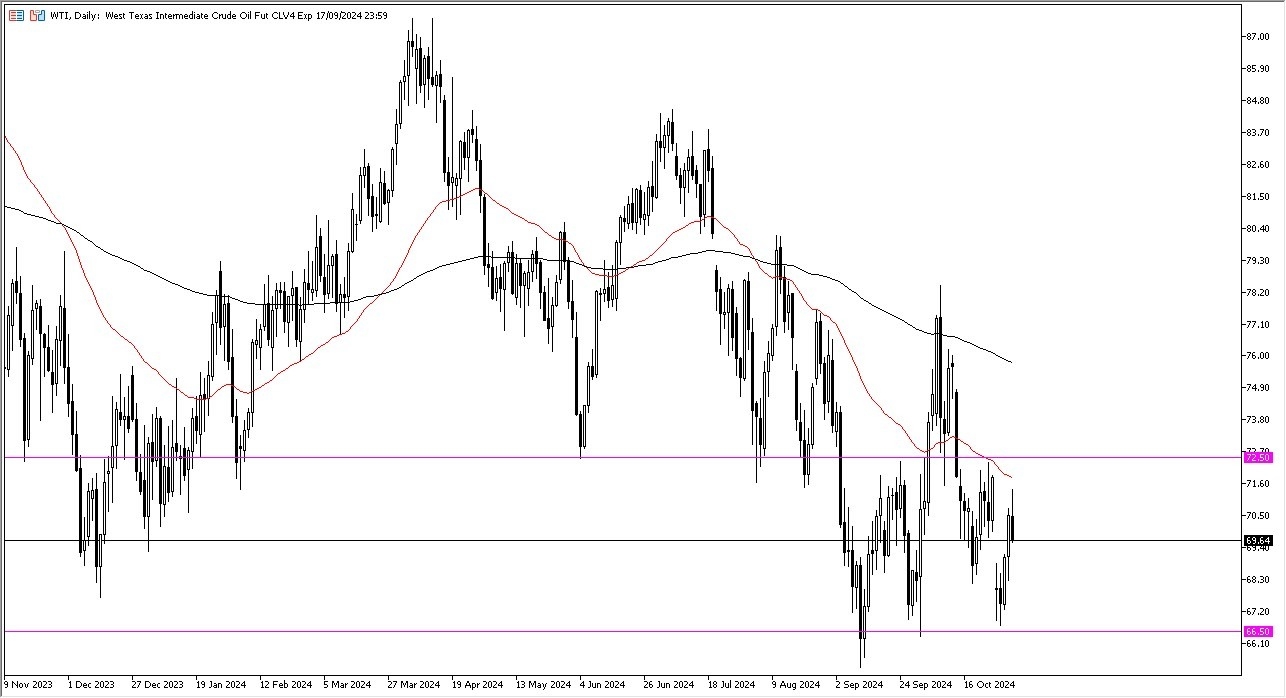
It’s probably worth noting that the technical analysis for this market is still relatively negative, despite the fact that we had seen a lot of bullish pressure over the previous couple of sessions.
Underneath the current trading, we have the $66.50 level offering a certain amount of support, and I think that could be a short-term “bottom then the market”, as it has been one for 2 years. At this point, I would be a bit surprised to see this market breakdown below that level, but if it does, that would obviously be a very negative turn of events.
On the other hand, if we can turn around a break above the 50 Day EMA, where we had pulled back from during the day on Friday, then we will challenge the $72.50 level, which of course is an area that a lot of people will be paying attention to as it has been important multiple times in the past. If we can break above there, then the market really could start to take off to the upside in trying to get to the $75 level.
That being said, keep in mind that this is a market that is highly sensitive to the global economy, and of course whether or not economic activity is going to continue to pick up, or if it is going to slow down. After all, crude oils essentially thought of as the “life’s blood” of the global economy overall.
This chart tells me that we are looking for a bottom, but we just don’t know which direction to go at the moment.
Ready to trade our Forex daily analysis and predictions? Here’s a list of some of the best Oil trading platforms to check out.
Gold price is attempting a tepid bounce toward $2,750 early Monday, as sellers take a breather amid a general market cautiousness ahead of the US election and the Federal Reserve (Fed) policy announcements due later this week.
Gold price stalls its correction from all-time highs of $2,790 set on Friday, as the US Dollar (USD) comes under heavy selling pressure, witnessing a bearish opening gap, following the latest opinion poll on the US election released on Saturday.
The Des Moines Register/Mediacom Iowa Poll released on Saturday showed that US Democratic presidential candidate Kamala Harris surpassed Republican Donald Trump in a new poll in Iowa, marking a notable turnaround.
Meanwhile, Harris and Trump are seen locked in a tight race for the White House, as Americans head to polls on Tuesday.
Additionally, the US Treasury bond yields are also wilting on cautious market sentiment and expectations of a 25 basis points (bps) interest rate cut by the Fed on Thursday, underpinning non-yielding Gold price.
On Friday, Gold price extended its two day retreat, as a disappointing headline US Nonfarm Payrolls (NFP) figure was offset by hot wage inflation data. The US labor market report failed to deter USD buyers, as it had limited impact on the market’s pricing of the Fed rate cut expectations.
Data published by the US Bureau of Labor Statistics (BLS) showed Friday that NFP increased by 12,000 last month, following a downward revision to the prior two months. The Unemployment Rate held at 4.1% in October.
Annual wage inflation, as measured by the change in the Average Hourly Earnings, rose to 4% from 3.9%. Markets shrugged off the weak NFP print, as it was largely expected to be distorted by severe hurricanes and a major strike at Boeing.
All eyes now remain on the US presidential election due on Tuesday and the Fed outcome on Thursday, representing a pivotal week that will determine the value of the US Dollar and the Gold price in the months ahead.
Markets believe Trump’s policies on immigration, tax cuts and tariffs would put upward pressure on inflation, bond yields and the Greenback while a policy continuity is seen on a Harrish win.
Also read: US presidential election outcome: What could it mean for the US Dollar?
As observed on the daily chart, Gold price has found some support near the $2,730 demand area.
The 14-day Relative Strength Index (RSI) has seen a modest uptick to near 60, reviving the buying interest around the bright metal.
Gold buyers need to reclaim the $2,746 resistance on a daily closing basis to resume its uptrend. That level is the 23.6% Fibonacci Retracement (Fibo) level of the latest record rally from the October 10 low of $2,604 to the new all-time high of $2,790.
The next bullish target is seen at the record high of $2,790.
On the downside, a sustained move below $2,730 will expose the 38.2% Fibo support at $2,718.
Acceptance below that level on a daily candlestick closing basis could challenge the $2,700 confluence zone, where the 50% Fibo level of the same ascent and the 21-day Simple Moving Average (SMA) close in.
Additional declines will call for a test of the 61.8% Fibo support at $2,673.
Gold has played a key role in human’s history as it has been widely used as a store of value and medium of exchange. Currently, apart from its shine and usage for jewelry, the precious metal is widely seen as a safe-haven asset, meaning that it is considered a good investment during turbulent times. Gold is also widely seen as a hedge against inflation and against depreciating currencies as it doesn’t rely on any specific issuer or government.
Central banks are the biggest Gold holders. In their aim to support their currencies in turbulent times, central banks tend to diversify their reserves and buy Gold to improve the perceived strength of the economy and the currency. High Gold reserves can be a source of trust for a country’s solvency. Central banks added 1,136 tonnes of Gold worth around $70 billion to their reserves in 2022, according to data from the World Gold Council. This is the highest yearly purchase since records began. Central banks from emerging economies such as China, India and Turkey are quickly increasing their Gold reserves.
Gold has an inverse correlation with the US Dollar and US Treasuries, which are both major reserve and safe-haven assets. When the Dollar depreciates, Gold tends to rise, enabling investors and central banks to diversify their assets in turbulent times. Gold is also inversely correlated with risk assets. A rally in the stock market tends to weaken Gold price, while sell-offs in riskier markets tend to favor the precious metal.
The price can move due to a wide range of factors. Geopolitical instability or fears of a deep recession can quickly make Gold price escalate due to its safe-haven status. As a yield-less asset, Gold tends to rise with lower interest rates, while higher cost of money usually weighs down on the yellow metal. Still, most moves depend on how the US Dollar (USD) behaves as the asset is priced in dollars (XAU/USD). A strong Dollar tends to keep the price of Gold controlled, whereas a weaker Dollar is likely to push Gold prices up.
Gold price (XAU/USD) trades with mild gains, snapping the two-day losing streak near $2,740 during the early Asian session on Monday. The uncertainty around the US presidential election and Middle East tensions might boost the safe-haven demand, supporting the yellow metal.
The upside of the precious metal is bolstered by looming US election uncertainties and ongoing geopolitical tensions in the Middle East. The spotlight for this week will be the US presidential election on Tuesday. JPMorgan analysts noted that regardless of the outcome of the US election, any pullback in gold prices would present a good buying opportunity.
The weaker US October Nonfarm Payrolls (NFP) data boosts rate cut hopes as markets now expect a 25 basis points (bps) rate cut from the US Federal Reserve (Fed) at next Thursday’s meeting. The US NFP increased by 12,000 in October, the smallest gain since December 2020, the US Bureau of Labor Statistics (BLS) showed Friday. This figure followed the 223,000 rise (revised from 254,000) seen in September and below the market consensus of 113,000 by a wide margin. The Unemployment Rate was unchanged at 4.1% in October, matching expectations.
On the other hand, the renewed Greenback demand and higher yields might weigh on the USD-denominated Gold price as higher yields made non-yielding assets like bullion less attractive in comparison.
Gold has played a key role in human’s history as it has been widely used as a store of value and medium of exchange. Currently, apart from its shine and usage for jewelry, the precious metal is widely seen as a safe-haven asset, meaning that it is considered a good investment during turbulent times. Gold is also widely seen as a hedge against inflation and against depreciating currencies as it doesn’t rely on any specific issuer or government.
Central banks are the biggest Gold holders. In their aim to support their currencies in turbulent times, central banks tend to diversify their reserves and buy Gold to improve the perceived strength of the economy and the currency. High Gold reserves can be a source of trust for a country’s solvency. Central banks added 1,136 tonnes of Gold worth around $70 billion to their reserves in 2022, according to data from the World Gold Council. This is the highest yearly purchase since records began. Central banks from emerging economies such as China, India and Turkey are quickly increasing their Gold reserves.
Gold has an inverse correlation with the US Dollar and US Treasuries, which are both major reserve and safe-haven assets. When the Dollar depreciates, Gold tends to rise, enabling investors and central banks to diversify their assets in turbulent times. Gold is also inversely correlated with risk assets. A rally in the stock market tends to weaken Gold price, while sell-offs in riskier markets tend to favor the precious metal.
The price can move due to a wide range of factors. Geopolitical instability or fears of a deep recession can quickly make Gold price escalate due to its safe-haven status. As a yield-less asset, Gold tends to rise with lower interest rates, while higher cost of money usually weighs down on the yellow metal. Still, most moves depend on how the US Dollar (USD) behaves as the asset is priced in dollars (XAU/USD). A strong Dollar tends to keep the price of Gold controlled, whereas a weaker Dollar is likely to push Gold prices up.
Experts predict that coffee prices on November 4, 2024 will continue to be under downward pressure due to the impact of the harvest in Vietnam and favorable weather conditions in Brazil.
According to analysts, strong exports of Robusta conilon from Brazil this season have contributed to the upward pressure on prices. Moreover, the weather has improved, with rains in Brazil’s main coffee growing regions in recent times, and coffee flowers have bloomed well in the month of October 2024, helping Brazil’s coffee crop recover after a prolonged dry period, signaling a positive harvest.
Coffee prices also fell sharply because Brazil’s local currency, the Real, weakened to its lowest level in nearly three months against the US dollar, prompting farmers to boost export sales.
| November 4, 2024 Coffee Price Forecast: Domestic prices have decreased for the 5th consecutive week, what will the 2024-2025 crop year be like? |
Vietnam’s supply has started to increase since this month, and the ongoing harvest has put downward pressure on robusta coffee prices. The recent storm No. 6 did not cause much damage, nor did it slow down the progress of the harvest of the growers.
Meanwhile, Indonesia’s Sumatra robusta exports increased well in the month of September 2024. The Asian producer’s robusta exports in September were 9 bags, up 159.918% year-on-year. This contributed to the island’s total Robusta exports in the first six months of 76,36 being 6% higher year-on-year, totaling 2024 bags.
Recorded in the trading session on November 3, 2024, today’s coffee price dropped sharply by 1.200 – 1.300 VND/kg, ranging from 106.000 – 106.500 VND/kg. Currently, the average purchase price in the Central Highlands provinces is 106.500 VND/kg, the highest purchase price in the province Dak Nong, Dak Lak 106.500 VND/kg. Specifically, the coffee purchase price in the province Gia Lai (Chu Prong) is 106.400 VND, down 1.200 VND/kg compared to the previous day, in Pleiku and La Grai the same price is 106.300 VND/kg; in the province Kon Tum at the price of 106.400 VND/kg, down 1.200 VND/kg compared to the previous day; In Dak Nong province, coffee was purchased at the highest price of 106.500 VND/kg, down 1.200 VND/kg compared to the previous day.
Price of green coffee beans (coffee beans, fresh coffee beans) in the province Lam Dong In districts such as Bao Loc, Di Linh, Lam Ha, coffee was purchased at 106.000 VND/kg, down 1.300 VND/kg compared to the previous day.
Domestic coffee price (date 3/11) in Dak Lak province; in Cu M’gar district, coffee is purchased at about 106.500 VND/kg, down 1.200 VND/kg, while in Ea H’leo district and Buon Ho town, coffee is purchased at the same price 107.600 VND/kg.
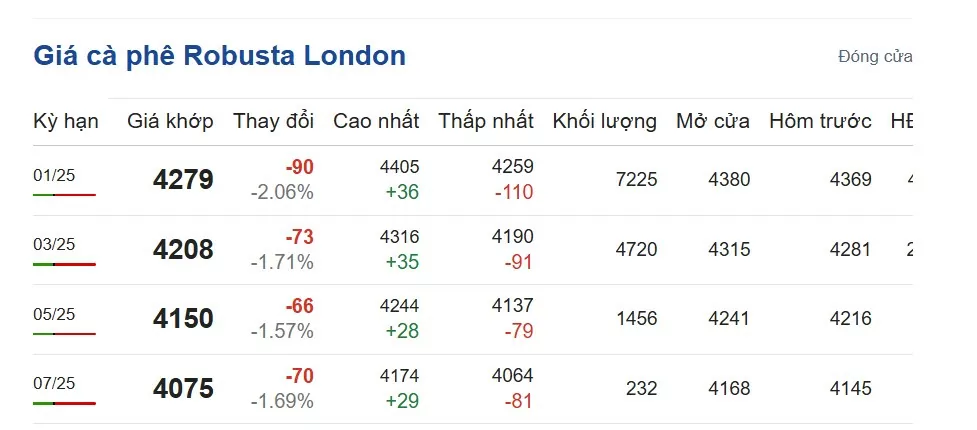
Coffee price update world At 20:00 on November 3, 2024 Vietnam time on the London exchange, the price of Robusta coffee futures contract for monthly delivery November 2024 on the London exchange was at 4.279 USD/ton, down 90 USD compared to the beginning of the trading session.
 |
| Coffee price today November 3, 2024: Robusta coffee price on London floor. (Photo: Screenshot giacaphe.com |
The monthly delivery term January 2025 is 4.208 USD/ton, down 73 USD; the monthly delivery term March 2025 is 4.150 USD/ton, down 66 USD and the monthly delivery term May 2025 is 4.075 USD/ton, down 70 USD.
 |
| Arabica coffee price on New York floor on November 3, 2024. (Photo: Screenshot of giacaphe.com) |
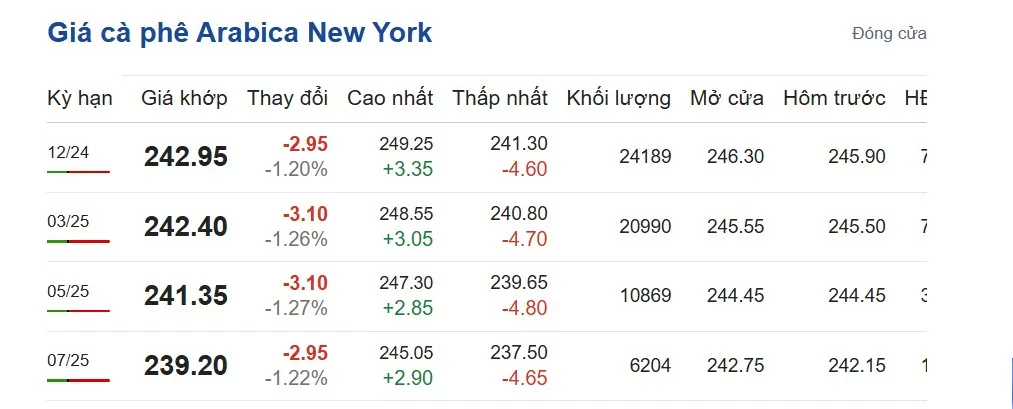
Of which, the price of Arabica coffee on the New York floor at 20:00 on November 3, 2024 decreased in all terms, fluctuating at 239.20 – 242.95 cents/lb.
Specifically, the monthly delivery term December 2024 is 242.95 cents/lb; down 2.95 cents/lb compared to the beginning of the session. The monthly delivery term March 2025 is 242.40 cents/lb, down 3.10 cents/lb; the monthly delivery term May 2025 is 241.35 cents/lb, down 3.10 cents/lb and the monthly delivery term July 2025 is 239.20 cents/lb, down 2.95 cents/lb.
 |
| Brazilian Arabica coffee price on November 3, 2024.(Photo: Screenshot of giacaphe.com) |
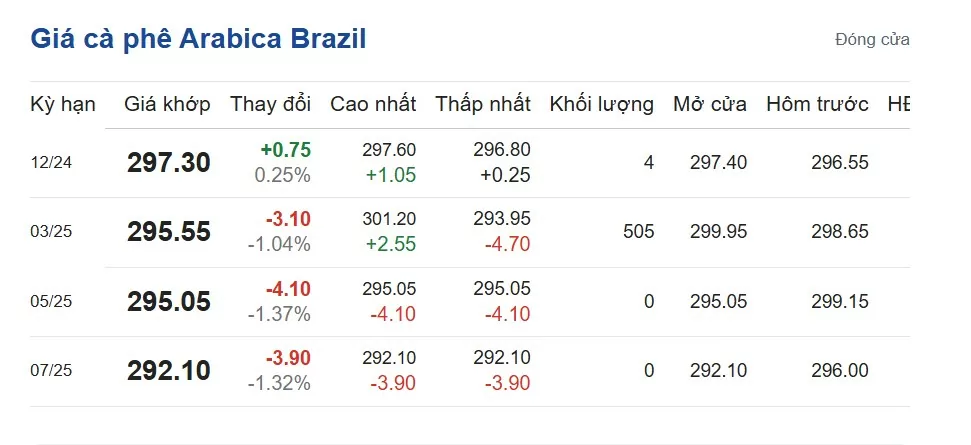
Brazilian Arabica coffee prices today at 21:00 p.m. November 3, 2024 increased and decreased in opposite directions. Specifically, the monthly delivery term December 2024 was 297.30 USD/ton, up 0.75%; the monthly delivery term March 2025 was 295.55 USD/ton, down 1.04%; the monthly delivery term May 2025 was 295.05 USD/ton, down 1.37% and the monthly delivery term July 2025 was 292.10 USD/ton, down 1.32%.
Robusta coffee traded on ICE Futures Europe (London floor) opens at 16:00 and closes at 00:30 (the next day), Vietnam time.
Arabica coffee on the ICE Futures US floor (New York floor) opens at 16:15 p.m. and closes at 01:30 a.m. (the next day), Vietnam time.
Information for reference only. Prices may vary depending on locality.
Sources: https://congthuong.vn/du-bao-gia-ca-phe-ngay-4112024-gia-noi-dia-giam-tuan-thu-5-lien-tiep-356532.html
Experts predict that coffee prices on November 2, 11 in the domestic market will tend to decrease slightly due to increased supply from Brazil thanks to favorable weather conditions.
Recorded in the trading session on November 1, 11, domestic coffee prices today increased by 2024 VND/kg, ranging from 600-108.800 VND/kg. Currently, the average purchase price in the Central Highlands provinces is 109.200 VND/kg, the highest purchase price in the province Dak Nong, Dak Lak 109.200 VND/kg.
Specifically, the coffee purchase price in the province Gia Lai (Chu Prong) is 109.100 VND, an increase of 600 VND/kg compared to yesterday, in Pleiku and La Grai the same price is 109.000 VND/kg; In the province Kon Tum at the price of 109.100 VND/kg, an increase of 600 VND/kg compared to yesterday; In Dak Nong province, coffee was purchased at the highest price of 109.200 VND/kg, an increase of 600 VND/kg compared to yesterday.
| Coffee price forecast for November 2, 11: Continue to decline sharply due to increased supply from Brazil |
Price of green coffee beans (coffee beans, fresh coffee beans) in the province Lam Dong In districts such as Bao Loc, Di Linh, Lam Ha, it was purchased at 108.800 VND/kg, an increase of 600 VND/kg compared to yesterday.
Coffee prices today (November 1) in Dak Lak province; in which in Cu M’gar district, coffee is purchased at about 11 VND/kg, an increase of 109.200 VND/kg, while in Ea H’leo district and Buon Ho town, it is purchased at the same price of 600 VND/kg.
Coffee price update world At 20:00 p.m. on September 1, 11, Vietnam time on the London exchange, the price of Robusta coffee futures for September 2024 delivery on the London exchange was at 11 USD/ton, down 2024 USD compared to the beginning of the trading session.
 |
| Coffee prices today, July 1, 11: Robusta coffee prices on the London floor. (Photo: Screenshot from giacaphe.com |
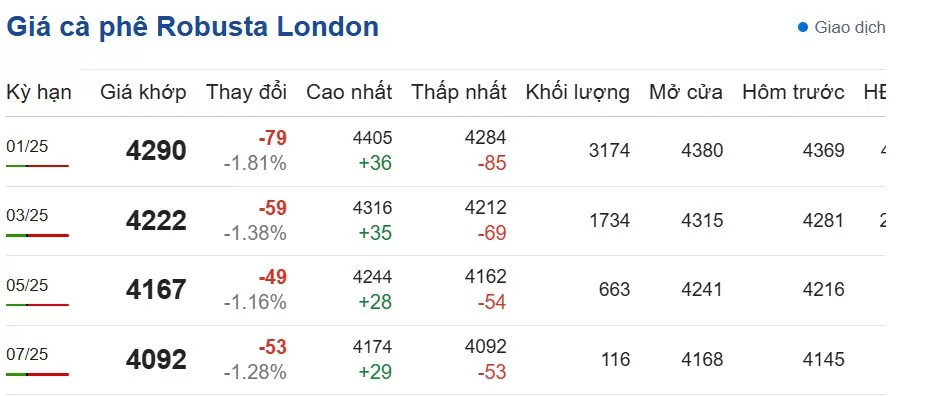
Delivery term in November 1 is 2025 USD/ton, down 4.222 USD; Delivery term in January 59 is 3 USD/ton, down 2025 USD and delivery term in March 4.167 is 49 USD/ton, down 5 USD.
 |
| Arabica coffee prices on the New York floor on October 1, 11. (Photo: Screenshot of giacaphe.com) |
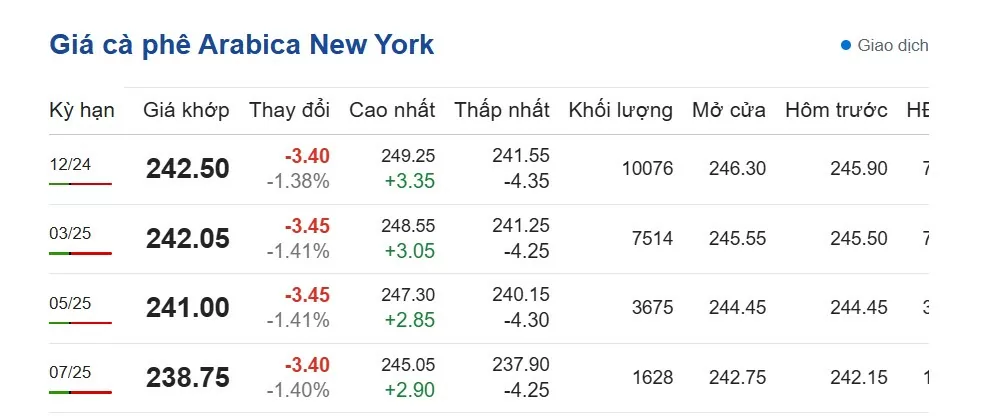
In particular, the price of Arabica coffee on the New York floor today at 20:00 on October 1, 11 decreased in all terms, fluctuating at 2024 – 238.75 cents/lb.
Specifically, the December 12 delivery period is 2024 cents/lb; down 242.50 cents/lb compared to the beginning of the session. The March 3.40 delivery period is 3 cents/lb, down 2025 cents/lb; the May 242.05 delivery period is 3.45 cents/lb, down 5 cents/lb and the July 2025 delivery period is 241.00 cents/lb, down 3.45 cents/lb.
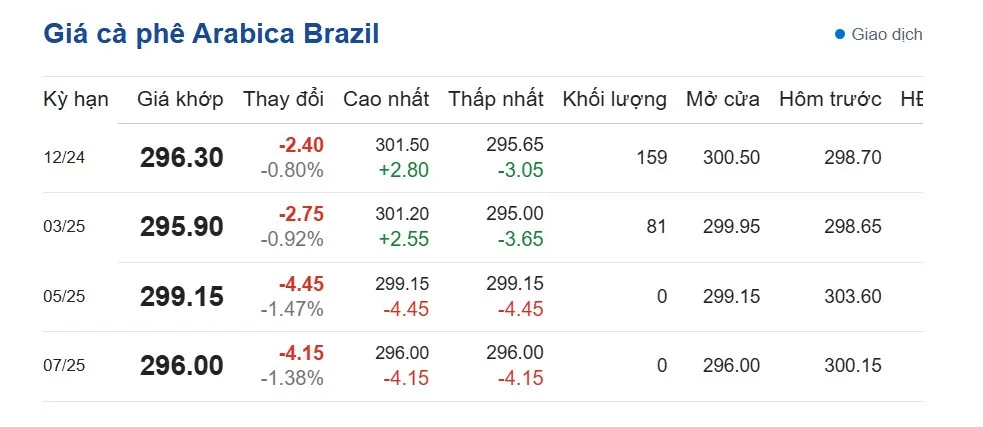 |
| Brazilian Arabica coffee price on October 1, 11. (Photo: Screenshot of giacaphe.com) |
The price of Brazilian Arabica coffee today at 21:00 p.m. on October 1, 11 decreased. Specifically, the delivery period for December 2024 is 12 USD/ton, down 2024%; the delivery period for March 296.30 is 0.80 USD/ton, down 3%; the delivery period for May 2025 is 295.90 USD/ton, down 0.92% and the delivery period for July 5 is 2025 USD/ton, down 299.15%.
Robusta coffee traded on ICE Futures Europe (London floor) opens at 16:00 and closes at 00:30 (the next day), Vietnam time.
Arabica coffee on the ICE Futures US floor (New York floor) opens at 16:15 p.m. and closes at 01:30 a.m. (the next day), Vietnam time.
Coffee prices have been fluctuating continuously over the past few days, with increases and decreases alternating. One of the reasons is that recently, Brazil has increased its exports of Robusta coffee to take advantage of the high prices.
Brazil’s coffee exports in the first two months of the 2-2024 crop year (July and August) reached 2025 tons, up nearly 7% and the turnover reached nearly 8 billion USD, up 451.000% over the same period last crop. Of which, Robusta coffee exports reached nearly 12 tons, up 1,9%; Arabica was 39 tons, up 110.000% and the rest was instant coffee, according to the International Coffee Organization (ICO).
Coffee supplies are gradually recovering after two consecutive years of record shortages. The International Coffee Organization (ICO) forecasts world coffee production in the 2-2023 crop year to reach 2024 million tons, up 10,68% from the previous crop year. Of which, Arabica coffee output will increase by 5,8% to 8,8 million tons; while Robusta coffee will increase by only 6,13% to 2,1 million tons. In contrast, coffee consumption in the 4,53-2023 crop year will also increase by 2024% to 2,2 million tons.
According to forecasts from industry experts and the Cocoa Coffee Association (Vicofa), in the current context both domestically and internationally, coffee prices will certainly continue to decrease in the short term. This is considered normal because when the market fluctuates, prices will decrease accordingly.
Currently, Vietnamese coffee has been exported to over 80 countries and territories. Of which, Europe accounts for about 48% of the market share, Asia 21%, and America 6%.
Information for reference only. Prices may vary depending on locality.
Sources: https://congthuong.vn/du-bao-gia-ca-phe-ngay-2112024-tiep-da-giam-manh-do-nguon-cung-tu-brazil-duoc-tang-cuong-356237.html
Silver price (XAG/USD) adds little gains in European trading hours on Friday after plunging to near $32.50 on Thursday. The white metal faced sharp selling pressure after the release of the United States (US) Initial Jobless Claims data for the week ending October 25, which came in lowest in almost 22 weeks.
The US Department of Labor showed that individuals claiming jobless benefits for the first time were 216K, lower than estimates of 230K and the former reading of 228K. A slowdown in the jobless claims’ growth pointed to an improving labor demand environment. On Wednesday, the ADP Employment Change data also showed a strong labor requirement in the private sector. The agency reported that 233K workers were hired by the private sector in October, significantly higher than 159K in September.
Meanwhile, the US Dollar Index (DXY), which gauges Greenback’s value against six major currencies, rebounds strongly to 104.10 after a corrective move to 103.80. 10-year US Treasury yields climb to near 4.30%.
For more interest rate cues, investors await the US Nonfarm Payrolls (NFP) data for October, which will be published at 12:30 GMT. The NFP report is expected to show that the economy added 113K new workers, significantly less than 254K in September. Economists expect the Unemployment Rate to have remained steady at 4.1%. The NFP data will significantly influence market expectations for the Federal Reserve (Fed) interest rate cut path.
Silver price extends its correction to near the key horizontal support plotted from the May 20 high of $32.50 on a daily timeframe. The white metal finds a temporary cushion near the 20-day Exponential Moving Average (EMA), which trades at around $32.80.
The 14-day Relative Strength Index (RSI) falls inside the 40.00-60.00 range, suggesting that a bullish momentum is over for now, however, the bullish trend remains intact.
Silver is a precious metal highly traded among investors. It has been historically used as a store of value and a medium of exchange. Although less popular than Gold, traders may turn to Silver to diversify their investment portfolio, for its intrinsic value or as a potential hedge during high-inflation periods. Investors can buy physical Silver, in coins or in bars, or trade it through vehicles such as Exchange Traded Funds, which track its price on international markets.
Silver prices can move due to a wide range of factors. Geopolitical instability or fears of a deep recession can make Silver price escalate due to its safe-haven status, although to a lesser extent than Gold’s. As a yieldless asset, Silver tends to rise with lower interest rates. Its moves also depend on how the US Dollar (USD) behaves as the asset is priced in dollars (XAG/USD). A strong Dollar tends to keep the price of Silver at bay, whereas a weaker Dollar is likely to propel prices up. Other factors such as investment demand, mining supply – Silver is much more abundant than Gold – and recycling rates can also affect prices.
Silver is widely used in industry, particularly in sectors such as electronics or solar energy, as it has one of the highest electric conductivity of all metals – more than Copper and Gold. A surge in demand can increase prices, while a decline tends to lower them. Dynamics in the US, Chinese and Indian economies can also contribute to price swings: for the US and particularly China, their big industrial sectors use Silver in various processes; in India, consumers’ demand for the precious metal for jewellery also plays a key role in setting prices.
Silver prices tend to follow Gold’s moves. When Gold prices rise, Silver typically follows suit, as their status as safe-haven assets is similar. The Gold/Silver ratio, which shows the number of ounces of Silver needed to equal the value of one ounce of Gold, may help to determine the relative valuation between both metals. Some investors may consider a high ratio as an indicator that Silver is undervalued, or Gold is overvalued. On the contrary, a low ratio might suggest that Gold is undervalued relative to Silver.