The main tag of GoldPrice Articles.
You can use the search box below to find what you need.
[wd_asp id=1]
The main tag of GoldPrice Articles.
You can use the search box below to find what you need.
[wd_asp id=1]
This week, data indicated a significant shift in U.S. inflation trends. Consumer prices were unchanged in May for the first time in nearly two years, and producer prices unexpectedly declined. Consequently, traders adjusted their expectations for interest rate cuts, now pricing in about 52 basis points of cuts by December, up from 37 basis points last week. This shift was primarily driven by softer inflation data, contrasting with earlier pessimism following a stronger-than-expected jobs report.
The Federal Reserve’s recent policy meeting, where it maintained current interest rates, showcased a median “dot plot” projecting just one quarter-point cut. Despite this conservative projection, the market’s reaction suggests a broader anticipation of monetary easing, enhancing gold’s attractiveness as a non-yielding asset.
European markets experienced volatility, particularly in France, due to political instability. This uncertainty, combined with cautious sentiment on Wall Street, has contributed to renewed interest in gold. Investors are increasingly seeking safe havens amidst geopolitical tensions in Europe and the Middle East, and significant central bank purchases, notably from China, are further supporting gold prices.
Spot gold is currently trading around $2,300 per ounce, after reaching a record high of $2,449.89 on May 20. The metal has gained over 11% year-to-date. Analysts point to strong physical demand and central bank purchases as key drivers. However, retail investment demand, such as from exchange-traded funds in the U.S., has yet to fully rebound.
Looking ahead, gold’s outlook remains bullish, although a climb to $3,000 per ounce appears unlikely in the short term. The fundamental case for gold is robust, supported by expectations of monetary easing and geopolitical uncertainties. Analysts foresee prices potentially reaching $2,600 to $2,700 per ounce this year, driven by continued central bank buying and safe-haven demand.
The upcoming weeks will be critical as investors seek clarity on the Federal Reserve’s interest rate decisions and monitor geopolitical developments. With the U.S. elections approaching and ongoing turmoil in Europe, additional market volatility is expected. While substantial gains have been made, surpassing the $3,000 mark would require a significant surge, given the substantial growth already witnessed this year.

Natural gas markets initially tried to rally on Friday but gave back gains as the 50 Day EMA has offered resistance. The market has been negative during the Friday session, and it looks as if the $7.00 level is going to offer a certain amount of support from a psychological and structural standpoint. If we do break down below the $7.00 level, then the market is likely to go looking to reach the $6.00 level underneath, which the 200 day EMA is currently trying to overcome.
If you have been watching these videos for the last several days, you know that I mentioned that the massive candlestick on Tuesday is the type of candlestick that rarely happens in a vacuum, therefore it’s likely that we will see more downward pressure. Ultimately, it’s not until we break above the $8.00 level that you have to look at this as a market that should show strength. Ultimately, I think we are in the midst of a major shakeup, and it is worth noting that the volatility had been getting strong over the last several weeks, so it’s not a huge surprise to see that we had broken down.
Whether or not we are going to melt down is a completely different question, so that being said I think that short-term traders will continue to short this market. If we break down below the $7.00 level, then I anticipate that pressure will pick up, and we will start to see a lot of momentum flow into this market to the downside. After all, this has been an extraordinarily crowded trade for some time.
For a look at all of today’s economic events, check out our economic calendar.
This article was originally posted on FX Empire
Hanoi (VNA) – The Ministry of Agriculture and Rural Development said that Vietnam’s coffee output in the 2023–2024 crop year is estimated to decrease by 20% compared to the previous crop year, to 1.47 million tonnes, the lowest in four years, putting pressure on Robusta supply in the world market.
Due to the impact of climate change, the dry season comes earlier than usual in Vietnam, and prolonged hot weather causes water levels at dams in some provinces to rapidly decrease. Fears that drought could affect crops have caused domestic coffee prices to increase sharply in the past week.
The price of coffee bean in the Central Highlands and southern provinces soared by 1,500 VND (0.059 USD) per kg, bringing the domestic purchase price of coffee bean to 114,500 – 116,000 VND per kg.
Over the past years, coffee prices were low, prompting many farmers to gradually switch to higher value crops. However, this year’s coffee prices are experiencing a record high, and it’s expected to be an opportunity to motivate farmers to restore coffee growing area.
According to the Ministry of Agriculture and Rural Development, Vietnam exported 756,000 tonnes of coffee, earning nearly 2.57 billion USD in the first four months of the year, up 5.4% in volume and 57.9% in value from the same period last year./.
Holiday money – where to buy it, how to avoid fees, and one thing you must not do
By Brad Young and Katie Williams, from the Money team
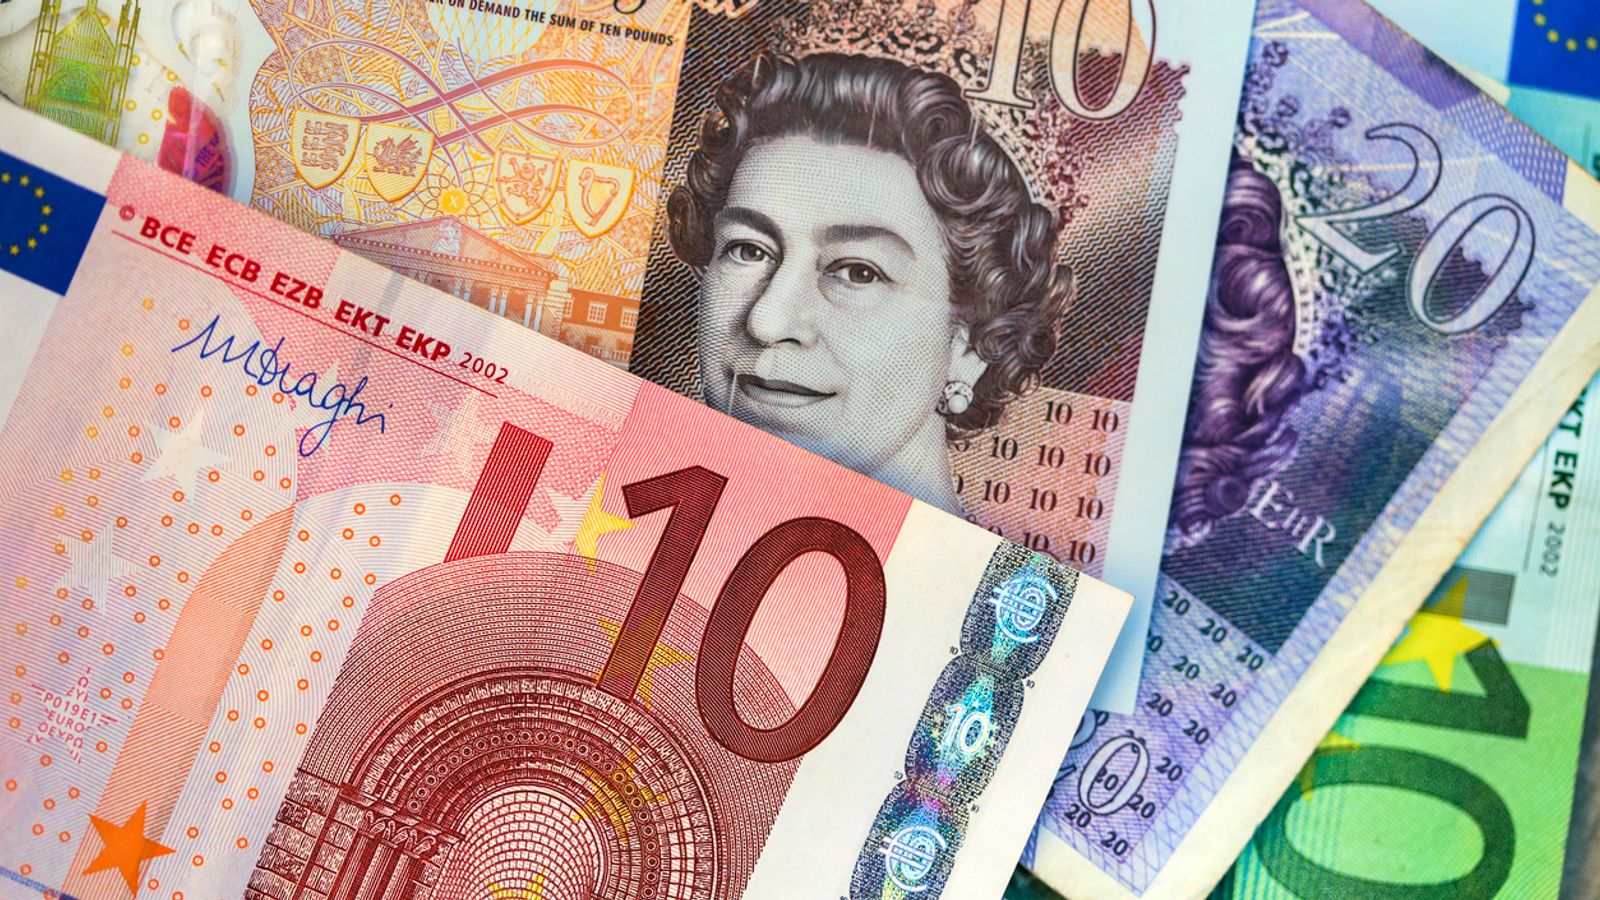
UK residents spend billions of pounds abroad each year, but it can be difficult to know how to make sterling go as far as possible.
With summer fast approaching, so too are the opportunities to splash out on holidays, so the Money team spoke with three travel experts to find out when, where and how to pay abroad.
CREDIT CARD
“The cheapest way to spend overseas is often on plastic, if you’ve got the right plastic,” said James Jones, head of consumer affairs at Experian.
“Using credit and debit cards can be a great way to get the very best exchange rates.”
He said rates offered by currency exchange shops are usually “much less attractive” than those offered on some cards, which were much closer to the rates the banks use themselves.
Fees could wipe out any gains
But it’s essential to be aware of things like non-sterling transaction fees, cash withdrawal fees and credit card interest.
So shop around for a card with travel rewards, Mr Jones said – and do this before your trip.
“You probably need to give yourself, ideally, six weeks.”
Extra protection
When you book a trip between £100 and £30,000, try and pay for some of it on a credit card to get “extra protection” under section 75 of the Consumer Credit Act, said Mr Jones.
That means the card provider is jointly responsible with the retailer if something goes wrong, such as arriving at a hotel only to find it has closed down.
If you are using a credit card, make sure you are can pay it off in full to avoid interest charges, said Sean Tipton from the Association of British Travel Agents (ABTA).
One trap you must not falling into
An increasingly common trap when paying with card (credit or debit) is being presented with the option to pay in the local currency or in pounds, said Mr Jones and Mr Tipton.
While paying in sterling might “seem like a wonderful convenience” you will ultimately be paying “quite a bit more for the purchase”, Mr Jones said.
If you pay in pounds, the local retailer’s bank sets the exchange rate, but if you pay in the local currency, your UK bank sets the rate.
DEBIT CARDS
“Some service providers don’t apply fees for overseas use on their regular UK debit cards,” says Moneyfacts – but you must always check as some incur big fees.
Alternatively, “some service providers offer specialist travel debit cards that don’t impose non-sterling transaction fees and cash withdrawal fees”.
PREPAID TRAVEL CARDS
If you’re looking to avoid a credit check, prepaid cards can be loaded with multiple currencies and work like a debit card, without being connected to your bank.
“Typically, prepaid travel cards will offer competitive or even no charges for foreign usage, which can make them a cheaper alternative to using a normal credit or debit card while on holiday,” says MoneyFacts.
One of the most popular prepaid cards, Revolut, uses its own exchange rates, which might not always be the best you can find – and while it is fee free on weekdays, there are charges at weekends, so do your research.
Also be aware – prepaid cards do not offer purchase protection like a credit card and aren’t regulated by the Financial Conduct Authority.
CASH
“Don’t rely solely on a card – it can backfire on you if you do,” said Mr Tipton.
Some taxis only take cash, leaving you to face hefty charges withdrawing from an ATM.
In some countries, like Argentina, it can be difficult to get money out of ATMs without a local bank account, Mr Tipton said.
Mr Jones added: “If you’re in a very remote part of the world that actually doesn’t have many ATMs and maybe where cash is king, then that might dictate what you need to do.”
Where and when to get cash
“I’d strongly recommend [to] get some cash out in the UK,” said Mr Tipton.
It can be difficult to find a bureau de change in some developing nations, and ATMs have “started introducing quite hefty charges” across the board, he said.
The exceptions are countries with really high inflation rates, where it may make more sense to get cash out when you arrive, he added.
When to exchange currency really depends on the destination, said Laura Plunkett, head of travel money at the Post Office.
“Exchange rates change frequently, so if you have time, do your homework and lock in a rate when it is good.”
What is a good exchange rate for Europe?
Some 80% of British holidays abroad take place in the Eurozone, said Mr Tipton.
The rate has remained “fairly stable”, but if you see the pound increasing in value that may be the time to buy a larger amount of Euros for a couple of years in advance, he added.
Mr Tipton said 1.2 to the pound is a “pretty healthy” time to buy, but “it is a bit of a lottery”.
Every year the pound gets stronger against the South African rand, and the same in Argentina, where the peso is “unbelievably weak”, Mr Tipton suggested.
In store or online?
“Most online suppliers will insist on a minimum order value that might be too high for some people, and you’ll have to make sure that you’re home for when it’s delivered,” said Ms Plunkett.
“But typically, rates are better online if that’s an option for you.”
Holiday money – where to buy it, how to avoid fees, and one thing you must not do
By Brad Young and Katie Williams, from the Money team
UK residents spend billions of pounds abroad each year, but it can be difficult to know how to make sterling go as far as possible.
With summer fast approaching, so too are the opportunities to splash out on holidays, so the Money team spoke with three travel experts to find out when, where and how to pay abroad.
CREDIT CARD
“The cheapest way to spend overseas is often on plastic, if you’ve got the right plastic,” said James Jones, head of consumer affairs at Experian.
“Using credit and debit cards can be a great way to get the very best exchange rates.”
He said rates offered by currency exchange shops are usually “much less attractive” than those offered on some cards, which were much closer to the rates the banks use themselves.
Fees could wipe out any gains
But it’s essential to be aware of things like non-sterling transaction fees, cash withdrawal fees and credit card interest.
So shop around for a card with travel rewards, Mr Jones said – and do this before your trip.
“You probably need to give yourself, ideally, six weeks.”
Extra protection
When you book a trip between £100 and £30,000, try and pay for some of it on a credit card to get “extra protection” under section 75 of the Consumer Credit Act, said Mr Jones.
That means the card provider is jointly responsible with the retailer if something goes wrong, such as arriving at a hotel only to find it has closed down.
If you are using a credit card, make sure you are can pay it off in full to avoid interest charges, said Sean Tipton from the Association of British Travel Agents (ABTA).
One trap you must not falling into
An increasingly common trap when paying with card (credit or debit) is being presented with the option to pay in the local currency or in pounds, said Mr Jones and Mr Tipton.
While paying in sterling might “seem like a wonderful convenience” you will ultimately be paying “quite a bit more for the purchase”, Mr Jones said.
If you pay in pounds, the local retailer’s bank sets the exchange rate, but if you pay in the local currency, your UK bank sets the rate.
DEBIT CARDS
“Some service providers don’t apply fees for overseas use on their regular UK debit cards,” says Moneyfacts – but you must always check as some incur big fees.
Alternatively, “some service providers offer specialist travel debit cards that don’t impose non-sterling transaction fees and cash withdrawal fees”.
PREPAID TRAVEL CARDS
If you’re looking to avoid a credit check, prepaid cards can be loaded with multiple currencies and work like a debit card, without being connected to your bank.
“Typically, prepaid travel cards will offer competitive or even no charges for foreign usage, which can make them a cheaper alternative to using a normal credit or debit card while on holiday,” says MoneyFacts.
One of the most popular prepaid cards, Revolut, uses its own exchange rates, which might not always be the best you can find – and while it is fee free on weekdays, there are charges at weekends, so do your research.
Also be aware – prepaid cards do not offer purchase protection like a credit card and aren’t regulated by the Financial Conduct Authority.
CASH
“Don’t rely solely on a card – it can backfire on you if you do,” said Mr Tipton.
Some taxis only take cash, leaving you to face hefty charges withdrawing from an ATM.
In some countries, like Argentina, it can be difficult to get money out of ATMs without a local bank account, Mr Tipton said.
Mr Jones added: “If you’re in a very remote part of the world that actually doesn’t have many ATMs and maybe where cash is king, then that might dictate what you need to do.”
Where and when to get cash
“I’d strongly recommend [to] get some cash out in the UK,” said Mr Tipton.
It can be difficult to find a bureau de change in some developing nations, and ATMs have “started introducing quite hefty charges” across the board, he said.
The exceptions are countries with really high inflation rates, where it may make more sense to get cash out when you arrive, he added.
When to exchange currency really depends on the destination, said Laura Plunkett, head of travel money at the Post Office.
“Exchange rates change frequently, so if you have time, do your homework and lock in a rate when it is good.”
What is a good exchange rate for Europe?
Some 80% of British holidays abroad take place in the Eurozone, said Mr Tipton.
The rate has remained “fairly stable”, but if you see the pound increasing in value that may be the time to buy a larger amount of Euros for a couple of years in advance, he added.
Mr Tipton said 1.2 to the pound is a “pretty healthy” time to buy, but “it is a bit of a lottery”.
Every year the pound gets stronger against the South African rand, and the same in Argentina, where the peso is “unbelievably weak”, Mr Tipton suggested.
In store or online?
“Most online suppliers will insist on a minimum order value that might be too high for some people, and you’ll have to make sure that you’re home for when it’s delivered,” said Ms Plunkett.
“But typically, rates are better online if that’s an option for you.”
The next area to watch for support activity is around the uptrend line and it was reached today. But if the line fails to hold the next lower price zone is around 2.84 to 2.82, consisting of a crossover of two trendlines and the 50% retracement, respectively. The uptrend line is a relatively short-term line having defined support of the rising trend starting from the April swing low of 1.58. It is used as a guide and is not so reliable without confirming evidence.
Given that the angle of ascent has been relatively steep, an adjustment to a lower slope angle would be common and healthy for the trend. Rising trends that start steep will eventually reach a point where demand can no longer support the price momentum and they will adjust to a lower slope. Alternatively, uptrends that start with a low slope angle typically see the angle increase as the trend progresses. Frequently, there are three angles that might be observed in either scenario.
What about the weekly time frame? The weekly chart is about to close the week with a bearish shooting star pattern. But before being alarmed notice that three weeks ago ended with a similar candlestick pattern. It was followed by a resumption of the uptrend after a brief drop below the bearish week. That was followed by a three-week continuation of the uptrend until this week’s high of 3.16.
The breakout of the bull pennant just got started and if it follows through it projects an initial target up to 3.78. That target is above the 2023 high of 3.64. Nonetheless, the main point is that there looks to be more upside in natural gas for the current trend. The target may be reached or not, but it is supportive of a continuation higher above this week’s high once the retracement is complete.
For a look at all of today’s economic events, check out our economic calendar.
U.S. crude oil was on pace Friday to break a three-week losing streak as analysts see a tighter market heading into the third quarter.
Oil prices are up more than 3% this week as summer fuel demand is expected to reduce inventories in the coming weeks, even though the season has gotten off to a tepid start.
Here are today’s energy prices:
Matt Smith, lead oil analyst at Kpler, said the risk is to the upside for oil prices, though gains will be fairly limited.
“You kind of got the bullish argument that we’re going into summer, refinery runs are going to be super strong drawing down inventories,” Smith told CNBC’s “Squawk Box” Friday.
“We could get up to $90, but we’ll come back down again,” Smith said. “We’re not going to $95, by no means are we going to $100 per barrel here.”
Though the market has largely shrugged off geopolitical risk and refocused on fundamentals, RBC Capital Markets cautioned investors to keep a close eye on an increasingly precarious situation on the Israel-Lebanon border.
“We are closely watching whether Benny Gantz’s departure from the Israeli wartime cabinet will tip the scales in favor of a ground operation aimed at pushing Hezbollah back from the border,” Helima Croft, head of global commodity strategy, told RBC clients in a note Thursday.
Oil remains well below annual highs set in April but has regained ground after a sell-off last week that pushed prices to four-month lows after OPEC+ unveiled plans to increase production in the fourth quarter.
Still, the cartel is keeping all output cuts in place until October, and has rolled two tranches of reductions over until the end of 2025.
“We stay with our tactical long crude recommendation, as our expectations for rising seasonal summer demand and lesser step-up in supply remain intact,” Deutsche Bank analyst Michael Hsueh told clients in a note Thursday.
Deutsche sees the oil supply deficit expanding to nearly 1 million barrels per day in the third quarter, which should support Brent prices rising to the mid-to-upper $80s per-barrel range.
“It would only take a minor overshoot to bring Brent to around USD 90/bbl at some point during the second half,” Hsueh told clients.
Citigroup also sees a tighter market in the third quarter, though it will likely enter a surplus in 2025 on solid production growth and slowing demand, according to the bank.
“When we’re looking at the fundamental picture going into 3Q whether its oil, copper or gold, it looks very solid driven by seasonal increases in demand,” Jeff Currie, an energy analyst at Carlyle, told “Squawk Box” Thursday.
“The supply situation given the recent OPEC meeting points to a tighter 3Q,” Currie said.
Recent Today in Energy analysis of natural gas markets is available on the EIA website.
(For the week ending Wednesday, June 12, 2024)
Daily spot prices by region are available on the EIA website.
More storage data and analysis can be found on the Natural Gas Storage Dashboard and the Weekly Natural Gas Storage Report.
See also:
| Spot Prices ($/MMBtu) | Thu, 06-Jun |
Fri, 07-Jun |
Mon, 10-Jun |
Tue, |
Wed, |
|---|---|---|---|---|---|
| Henry Hub |
|
2.44 |
2.63 |
2.72 |
2.80 |
| New York |
|
1.17 |
1.32 |
1.35 |
1.79 |
| Chicago |
|
1.52 |
1.84 |
1.82 |
2.23 |
| Cal. Comp. Avg.* |
|
1.55 |
1.76 |
1.81 |
1.76 |
| *Avg. of NGI’s reported prices for: Malin, PG&E Citygate, and Southern California Border Avg. | |||||
| Data source: NGI’s Daily Gas Price Index | |||||


| U.S. natural gas supply – Gas Week: (6/6/24 – 6/12/24) | |||
|---|---|---|---|
|
Average daily values (billion cubic feet) |
|||
|
this week |
last week |
last year |
|
| Marketed production |
112.5 |
112.8 |
116.1 |
| Dry production |
99.3 |
99.6 |
102.7 |
| Net Canada imports |
5.8 |
5.4 |
5.1 |
| LNG pipeline deliveries |
0.1 |
0.1 |
0.1 |
| Total supply |
105.2 |
105.1 |
107.8 |
|
Data source: S&P Global Commodity Insights |
|||
| U.S. natural gas consumption – Gas Week: (6/6/24 – 6/12/24) | |||
|---|---|---|---|
|
Average daily values (billion cubic feet) |
|||
|
this week |
last week |
last year |
|
| U.S. consumption |
68.6 |
67.5 |
68.3 |
| Power |
37.8 |
36.1 |
37.0 |
| Industrial |
21.6 |
21.8 |
21.8 |
| Residential/commercial |
9.2 |
9.6 |
9.6 |
| Mexico exports |
7.0 |
6.9 |
6.7 |
| Pipeline fuel use/losses |
8.6 |
8.5 |
8.8 |
| LNG pipeline receipts |
12.9 |
13.2 |
11.6 |
| Total demand |
97.1 |
96.1 |
95.4 |
|
Data source: S&P Global Commodity Insights |
|||


| Rigs | |||
|---|---|---|---|
|
|
Change from |
||
|
last week
|
last year
|
||
| Oil rigs |
|
|
|
| Natural gas rigs |
|
|
|
| Note: Excludes any miscellaneous
rigs |
|||
| Rig numbers by type |
|
|
|
|---|---|---|---|
|
|
Change from |
||
|
last week
|
last year
|
||
| Vertical |
|
|
|
| Horizontal |
|
|
|
| Directional |
|
|
|
| Data source: Baker Hughes Company | |||
| Working gas in underground storage | ||||
|---|---|---|---|---|
| Stocks billion cubic feet (Bcf) |
||||
| Region |
|
|
change |
|
| East |
|
|
|
|
| Midwest |
|
|
|
|
| Mountain |
|
|
|
|
| Pacific |
|
|
|
|
| South Central |
|
|
|
|
| Total |
|
|
|
|
|
R=Revised. Working gas stocks were revised to reflect resubmissions of data during the five-week period from May 3, 2024, to May 31, 2024, increasing stocks by 6 Bcf to 9 Bcf for each week during this period. The reported revisions caused the stocks for May 31, 2024, to change from 2,893 Bcf to 2,900 Bcf, and working gas stocks for the week ending May 24, 2024, changed from 2,795 Bcf to 2,804 Bcf. As a result, the implied net change between the weeks ending May 31, 2024, and May 24, 2024, changed from 98 Bcf to 96 Bcf. More information about the revised working gas levels can be found at: https://ir.eia.gov/ngs/ngshistory.xls.
|
||||
| Working gas in underground storage | |||||
|---|---|---|---|---|---|
| Historical comparisons | |||||
|
Year ago |
5-year average |
||||
| Region |
Stocks (Bcf) |
% change |
Stocks (Bcf) |
% change |
|
| East |
|
|
|
|
|
| Midwest |
|
|
|
|
|
| Mountain |
|
|
|
|
|
| Pacific |
|
|
|
|
|
| South Central |
1,102 |
5.2 |
989 |
17.2 |
|
| Total |
2,610 |
13.9 |
2,401 |
23.9 |
|
| Data source: U.S. Energy Information Administration Form EIA-912, Weekly Underground Natural Gas Storage Report
Note: Totals may not equal sum of components because of independent rounding. |
|||||
| Temperature – heating & cooling degree days (week ending Jun 06) | ||||||||
|---|---|---|---|---|---|---|---|---|
|
|
HDDs |
CDDs |
||||||
| Region |
Current total |
Deviation from normal |
Deviation from last year |
Current total |
Deviation from normal |
Deviation from last year |
||
| New England |
12 |
-16 |
-36 |
12 |
7 |
1 |
||
| Middle Atlantic |
7 |
-13 |
-13 |
21 |
6 |
6 |
||
| E N Central |
12 |
-12 |
4 |
24 |
0 |
-12 |
||
| W N Central |
7 |
-14 |
7 |
36 |
6 |
-23 |
||
| South Atlantic |
4 |
-2 |
1 |
66 |
6 |
13 |
||
| E S Central |
2 |
-3 |
2 |
62 |
9 |
-1 |
||
| W S Central |
0 |
-1 |
0 |
95 |
11 |
16 |
||
| Mountain |
16 |
-18 |
-11 |
49 |
11 |
22 |
||
| Pacific |
11 |
-13 |
-13 |
15 |
-1 |
12 |
||
| United States |
8 |
-11 |
-4 |
42 |
5 |
5 |
||
|
Data source: National Oceanic and Atmospheric Administration Note: HDDs=heating degree days; CDDs=cooling degree days |
||||||||
Average temperature (°F)
7-day mean ending Jun 06, 2024

Data source: National Oceanic and Atmospheric Administration
Deviation between average and normal temperature (°F)
7-day mean ending Jun 06, 2024
Data source: National Oceanic and Atmospheric Administration
Monthly U.S. dry shale natural gas production by formation is available in the Short-Term Energy Outlook.
After a volatile Wednesday, the US Dollar recovered the ground lost following United States (US) first-tier events, pushing higher even against the safe-haven Gold in a risk-averse environment. XAU/USD trades below $2,300 a troy ounce, trimming weekly gains.
The US Dollar turned lower mid-European morning following the release of encouraging US inflation-related data. The US Bureau of Labor Statistics (BLS) reported that the Producer Price Index (PPI) rose 2.2% YoY in May, easing from the 2.3% increase posted in April and below expectations for a 2.5% advance. On a monthly basis, the PPI declined by 0.2%.
The optimism was short-lived as US indexes turned sharply lower after the opening, pushing the Greenback higher across financial boards. At the time being, only the Nasdaq Composite trades in the green, up a modest 0.29%. The Dow Jones Industrial Average is the worst performer, down 225 points.
The upcoming Asian session will bring the Bank of Japan’s (BoJ) monetary policy decision. Market participants speculate the central bank will probably leave interest rates unchanged, although policymakers may also announce a reduction in bond purchases.
The daily chart for XAU/USD shows that the risk of a bearish breakout has increased. The pair is trading below a firmly bearish 20 Simple Moving Average (SMA), while technical indicators resumed their slides within negative levels, in line with another leg lower. The 100 and 200 SMAs keep heading higher well below the current level, although they remain too far to become relevant. The weekly low at $2,286.69 is the immediate support level.
In the near term, and according to the 4-hour chart, the bearish case is even stronger. XAU/USD accelerated south after sliding below a now flat 20 SMA. Furthermore, the 100 SMA is crossing below the 200 SMA, both far above the shorter one. Finally, technical indicators crossed their midlines into negative territory, and maintain firmly bearish slopes, reflecting persistent selling interest.
Support levels: 2,286.70 2,271.90 2,258.30
Resistance levels: 2,308.80 2,321.55 2,333.10
An uptrend line marks dynamic support for the current advance that began from the April 25 swing low. Also, the downtrend line identifies a price area for potential support. If the uptrend line is broken the downtrend line is the next line to watch for possible support. The two lines cross at a price of 2.84, marking another price to watch. That price area can be watched along with this week’s low of 2.86.
A little lower is the important 20-Day MA at 2.75. Notice that the 20-Day line has now converged with the top boundary line of the pennant pattern. Each is marking a similar price support area. It is also interesting that the day the 20-Day MA hit the bottom boundary line of the pennant on June 6, was the day of the pennant breakout. Although it closed weak, the next day’s upside continuation made up for it.
Given the strong bullish behavior of natural gas during the current ascent, higher targets remain in sight. At the same time, the relative strength index momentum oscillator (RSI) is beginning to show signs of a bearish divergence. It is still early though but should be watched as the trend progresses.
Given today’s pullback, a rally above the day’s high of 3.09 provides a sign of strength. The next higher target zone, above the nearby 3.18 to 3.20 Fibonacci confluence zone, is the 3.39 swing high from early-January. Nevertheless, a decisive breakout above this week’s high of 3.16 has a good chance of exceeding that swing high eventually, if not on the first approach.
For a look at all of today’s economic events, check out our economic calendar.