The main tag of GoldPrice Articles.
You can use the search box below to find what you need.
[wd_asp id=1]
The main tag of GoldPrice Articles.
You can use the search box below to find what you need.
[wd_asp id=1]
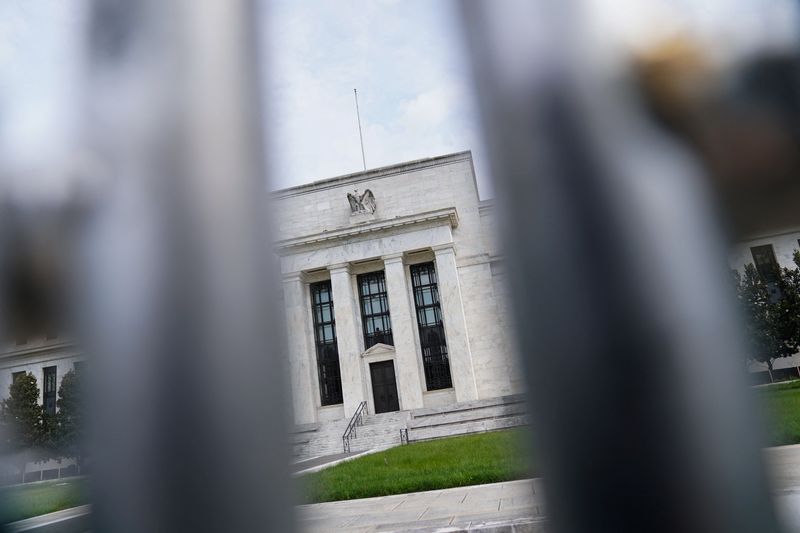
“National economic activity continued to expand from early April to mid-May,” though overall outlooks “grew somewhat more pessimistic amid reports of rising uncertainty and greater downside risks,” the Fed said in its Beige Book economic report, based on anecdotal information collected by the Fed’s 12 reserve banks through May 20.
In a sign of cooling in the labor market, the majority of districts noted “better labor availability, though some shortages remained in select industries or areas,” the Fed’s beige book showed, and flagged the slowing wage growth.
“Several districts reported that wage growth was at pre-pandemic historical averages or was normalizing toward those rates,” the report added.
Against the backdrop of cooling wage growth, retail spending was flat to up slightly, reflecting “lower discretionary spending and heightened price sensitivity among consumers,” according to the report.
On the inflation front, meanwhile, prices increased at a modest pace over the period, the report noted, with “price growth is expected to continue at a modest pace in the near term.”
Typically speaking, this is a fairly weak time of year. So, it’s a bit of a stretch to think that we’re just suddenly going to take off to the upside, but there is a certain amount of geopolitical concerns out there. After all, the land-worn Ukraine has gone nowhere, and therefore, natural gas could continue to be a major issue. If we can take out the $3.50 level, this is a market that can really take off, but right now I’m not really looking for that. I think we’re in the process of building a base.
For a look at all of today’s economic events, check out our economic calendar.
The U.S. Department of Labor reported on Thursday that unemployment insurance claims increased by 229,000 in the week ending June 1, higher than expected. This, combined with the ADP report on private-sector employment, indicates a cooling U.S. labor market, solidifying bets for a September Fed rate cut.
The yield on the 10-year U.S. Treasury bond is near its lowest level in two months, undermining the dollar and supporting gold prices. Despite the strong bullish sentiment in global equity markets, traders remain cautious ahead of the crucial U.S. employment data release.
The Nonfarm Payrolls (NFP) report is expected to show that the U.S. economy added 185,000 jobs in May, up from 175,000 previously, with the unemployment rate steady at 3.9%.
Average Hourly Earnings will also be closely watched for their impact on inflation and the Fed’s future policy decisions, which will help determine the next direction for XAU/USD.
Gold prices (XAU/USD) are expected to remain bullish, trading at $2,376.58, up 0.20%, as they approach key highs amid growing anticipation of Federal Reserve interest rate cuts. Positive momentum is supported by weak U.S. economic indicators and dovish expectations. Maintaining above the pivot point of $2,364 indicates a bullish outlook.
-US producer prices increased more than expected in April amid strong gains in the costs of services and goods, indicating that inflation remained elevated early in the second quarter. Borrowing costs in the US have been stuck at high levels since last July as the government aims to quash sticky inflation.
-Federal Reserve Chair Jerome Powell said he expects US inflation to continue declining through 2024 but warned his confidence in those decreases has fallen after prices rose more quickly than expected through the first quarter.
Analysts said that although no operational disruptions have been reported, Canada’s 3.3 million barrel per day production capacity was “very likely to be affected. The International Energy Agency (IEA) will gauge the supply-demand dynamics and the weekly US oil and its bi-products inventory data from EIA on Wednesday – ahead to beginning of the summer driving season in US.
You are on Mint! India’s #1 news destination (Source: Press Gazette). To learn more about our business coverage and market insights Click Here!
In turn, the rise in coffee prices has caused a notable increase in the cost of a range of products, with coffee chains and producers passing rising costs onto consumers. For instance, shops in London have now started charging customers more than £5 for a takeaway coffee.
Kanica Goel, senior analyst at The Smart Cube, explained further:
“The primary factor driving this price hike is supply concerns in the key coffee producing regions – Brazil and Vietnam – which together account for 55% and 50% of global coffee production and exports, respectively.”
In March 2024, Brazil’s Minas Gerais region, which accounts for roughly 30% of the country’s arabica crop, received 235% higher rainfall compared to the historical average during the period. Subsequently, in April 2024, the region received no rainfall and is likely to witness dryness in May as well; this will likely damage coffee crops in the country.
In Vietnam – the world’s largest producer of robusta coffee beans – drought conditions could lead to a 20% year-over-year (YoY) drop in coffee production in the marketing year 2023/24 (October 2023 – September 2024), resulting in the smallest crop in the last four years.
Coffee prices are now hitting 45 year highs. Data from the International Coffee Organization indicates that the wholesale price index for robust beans was up 17% in April. This is the highest level robust has traded at since 1979.
“Additionally, low inventories in Q4 2023 and Q1 2024 also exerted upwards pressure on prices,” said Goel.
On 21st February, robusta coffee inventories fell to a record low of 1,958 lots and arabica coffee inventories fell to a 24-year low of 224,066 bags as of 30th November.
Port congestions, shipping delays and geopolitical unrest further aggravated supply concerns supporting the price hike. “What’s more, ongoing supply apprehension arising from the excessive dryness in Brazil and Southeast Asia is prompting investors and traders to increase short coverings, which might keep prices elevated in the next one-two months,” said Goel.
The El Nino climate pattern, which has also been making itself felt in the cocoa market, is partly to blame here. Vietnam and Brazil have both been victims of unusual weather patterns, with drier weather in Vietnam in particular driving prices up. A prolonged heatwave in Vietnam into March is likely to play havoc with the next crop. Farmgate prices for coffee in Vietnam were setting new highs last month.
According to GlobalData, total global coffee production is going to come in under initial projections to the tune of over 4m bags. Antonio Baravelle, CEO of coffee group Lavazza, said he was sacrificing his group’s profitability this year to help keep consumer prices down, but admitted the company is facing major challenges, as it is squeezed by raw materials prices.
The ICO said that coffee consumption has been increasing globally, but demand has now far exceeded supply. Existing reserves of green coffee beans are being rapidly denuded as the coffee industry seeks to avoid the high prices in the futures market.
Spot Gold trades with a bullish bias on Thursday, reaching fresh two-week highs just below the $2,380 mark. The bright metal accelerated north early in the American session after the European Central Bank (ECB) monetary policy announcement and United States (US) employment data.
The ECB and trimmed the three main rates by 25 basis points (bps) each, as expected, with the interest rate on the main refinancing operations, the interest rates on the marginal lending facility and the deposit facility coming down to 4.25%, 4.5% and 3.75%, respectively. The accompanying statement, however, was hawkish, as policymakers refused to anticipate additional cuts in the upcoming meetings. Across the pound, US Weekly Unemployment Claims rose more than anticipated in the week ended May 31, increasing to 229K vs the 220K expected.
The focus now shifts to US Nonfarm Payrolls (NFP). The country will release the May monthly report on Friday, which is expected to show that the US economy added 185K jobs in the month, above the 175K gained in April. Additionally, the Unemployment Rate is foreseen stable at 3.9%, while Average Hourly Earnings, a measure of wage inflation, are expected to have ticked up by 0.3% in the month from the previous 0.2%. A strong labor report could provide the US Dollar with bullish momentum, but speculative interest will likely sell it back after the dust settles.
XAU/USD is up for a second consecutive day and trading near the aforementioned high. The risk skews to the upside, although additional confirmations are needed. In the daily chart, the pair is holding above a mildly bullish 20 Simple Moving Average (SMA), while the longer ones keep heading north far below the current level. Technical indicators, however, diverge as the Momentum indicator edges modestly lower below its 100 level, while the Relative Strength Index (RSI) indicator advances around 55.
The near-term picture is bullish. In the 4-hour chart, XAU/USD aims north above all its moving averages, surpassing a flat 100 SMA for the first time since April 23. At the same time, the 20 SMA gains upward traction and crosses above the 200 SMA, both at around $2,345. Finally, technical indicators aim firmly north within positive levels, reflecting persistent buying interest.
Support levels: 2,355.20 2,445.90 2,333.60
Resistance levels: 2,381.80 2,394.25 2,408.60
You have reached your limit of 5 free articles for this month.
Access all our articles, insights, and analysts.
Your coupon code
Spot Gold trades with a bullish bias on Thursday, reaching fresh two-week highs just below the $2,380 mark. The bright metal accelerated north early in the American session after the European Central Bank (ECB) monetary policy announcement and United States (US) employment data.
The ECB and trimmed the three main rates by 25 basis points (bps) each, as expected, with the interest rate on the main refinancing operations, the interest rates on the marginal lending facility and the deposit facility coming down to 4.25%, 4.5% and 3.75%, respectively. The accompanying statement, however, was hawkish, as policymakers refused to anticipate additional cuts in the upcoming meetings. Across the pound, US Weekly Unemployment Claims rose more than anticipated in the week ended May 31, increasing to 229K vs the 220K expected.
The focus now shifts to US Nonfarm Payrolls (NFP). The country will release the May monthly report on Friday, which is expected to show that the US economy added 185K jobs in the month, above the 175K gained in April. Additionally, the Unemployment Rate is foreseen stable at 3.9%, while Average Hourly Earnings, a measure of wage inflation, are expected to have ticked up by 0.3% in the month from the previous 0.2%. A strong labor report could provide the US Dollar with bullish momentum, but speculative interest will likely sell it back after the dust settles.
XAU/USD is up for a second consecutive day and trading near the aforementioned high. The risk skews to the upside, although additional confirmations are needed. In the daily chart, the pair is holding above a mildly bullish 20 Simple Moving Average (SMA), while the longer ones keep heading north far below the current level. Technical indicators, however, diverge as the Momentum indicator edges modestly lower below its 100 level, while the Relative Strength Index (RSI) indicator advances around 55.
The near-term picture is bullish. In the 4-hour chart, XAU/USD aims north above all its moving averages, surpassing a flat 100 SMA for the first time since April 23. At the same time, the 20 SMA gains upward traction and crosses above the 200 SMA, both at around $2,345. Finally, technical indicators aim firmly north within positive levels, reflecting persistent buying interest.
Support levels: 2,355.20 2,445.90 2,333.60
Resistance levels: 2,381.80 2,394.25 2,408.60
Spot Gold trades with a bullish bias on Thursday, reaching fresh two-week highs just below the $2,380 mark. The bright metal accelerated north early in the American session after the European Central Bank (ECB) monetary policy announcement and United States (US) employment data.
The ECB and trimmed the three main rates by 25 basis points (bps) each, as expected, with the interest rate on the main refinancing operations, the interest rates on the marginal lending facility and the deposit facility coming down to 4.25%, 4.5% and 3.75%, respectively. The accompanying statement, however, was hawkish, as policymakers refused to anticipate additional cuts in the upcoming meetings. Across the pound, US Weekly Unemployment Claims rose more than anticipated in the week ended May 31, increasing to 229K vs the 220K expected.
The focus now shifts to US Nonfarm Payrolls (NFP). The country will release the May monthly report on Friday, which is expected to show that the US economy added 185K jobs in the month, above the 175K gained in April. Additionally, the Unemployment Rate is foreseen stable at 3.9%, while Average Hourly Earnings, a measure of wage inflation, are expected to have ticked up by 0.3% in the month from the previous 0.2%. A strong labor report could provide the US Dollar with bullish momentum, but speculative interest will likely sell it back after the dust settles.
XAU/USD is up for a second consecutive day and trading near the aforementioned high. The risk skews to the upside, although additional confirmations are needed. In the daily chart, the pair is holding above a mildly bullish 20 Simple Moving Average (SMA), while the longer ones keep heading north far below the current level. Technical indicators, however, diverge as the Momentum indicator edges modestly lower below its 100 level, while the Relative Strength Index (RSI) indicator advances around 55.
The near-term picture is bullish. In the 4-hour chart, XAU/USD aims north above all its moving averages, surpassing a flat 100 SMA for the first time since April 23. At the same time, the 20 SMA gains upward traction and crosses above the 200 SMA, both at around $2,345. Finally, technical indicators aim firmly north within positive levels, reflecting persistent buying interest.
Support levels: 2,355.20 2,445.90 2,333.60
Resistance levels: 2,381.80 2,394.25 2,408.60
Coffee prices recovered from early losses on Wednesday and posted moderate gains. Forecasts for limited rainfall in Brazil until late next week sparked some short covering in coffee futures. Coffee prices initially moved lower Wednesday on a rebound in ICE coffee inventories after ICE-monitored arabica coffee inventories on Tuesday rose to a 1-year high.
Dryness in Brazil could reduce coffee yields, which would be bullish for prices. Somar Meteorologia reported Monday that Brazil’s Minas Gerais region received no rainfall or 0% of the historical average in the past week, the second consecutive week the area has received no rainfall. Minas Gerais accounts for about 30% of Brazil’s arabica crop.
Coffee prices have a negative carryover from last Friday when the International Coffee Organization (ICO) reported that global Mar coffee exports rose +8.1% y/y to 12.99 million bags and Oct-Mar global coffee exports were up +10.4% y/y at 69.16 million bags.
Coffee prices rallied sharply in April, with arabica coffee posting a new 2-year high and nearest-futures (K24) robusta coffee posting a new all-time high. Coffee prices surged on coffee crop concerns in Brazil and Vietnam. Robusta coffee surged to a new record high on fears that excessive dryness in Vietnam will limit the country’s robusta coffee production.
Tight robusta coffee supplies from Vietnam, the world’s largest producer of robusta coffee beans, are a bullish factor. On March 26, Vietnam’s agriculture department projected that Vietnam’s coffee production in the 2023/24 crop year would drop by -20% to 1.472 MMT, the smallest crop in four years, due to drought. Also, the Vietnam Coffee Association said that Vietnam’s 2023/24 coffee exports would drop -20% y/y to 1.336 MMT. In addition, Marex Group Plc forecasts a global 2024/25 robusta coffee deficit of -2.7 million bags due to reduced output in Vietnam.
Coffee inventories have rebounded from historically low levels. ICE-monitored robusta coffee inventories on February 21 fell to a record low of 1,958 lots, although they recovered to a 5-month high last Friday of 4,059 lots. Also, ICE-monitored arabica coffee inventories fell to a 24-year low of 224,066 bags on November 30, but they recovered to a 1-year high Tuesday of 701,423 bags.
There has recently been some bearish export news. Cecafe reported on April 10 that Brazil’s Mar green coffee exports jumped +41% y/y to 3.9 million bags. Brazil is the world’s largest producer of arabica coffee beans. Also, Brazil’s exporter group Comexim, on February 1, raised its Brazil 2023/24 coffee export estimate to 44.9 million bags from a previous estimate of 41.5 million bags. In a bearish factor for robusta, Vietnam’s General Statistics Office reported last Monday that Vietnam’s Apr coffee exports rose +3.9% y/y to 170,000 MT, and Vietnam’s Jan-Apr coffee exports are up +5.4% y/y to 756,000 MT.
This past year’s El Nino weather event has been bullish for coffee prices. An El Nino pattern typically brings heavy rain to Brazil and drought to India, negatively impacting coffee crop production. The El Nino event has brought drought to Vietnam’s coffee areas this year, according to an official from Vietnam’s Institute of Meteorology, Hydrology, and Climate Change.
In a bearish factor, the International Coffee Organization (ICO) projected last Friday that 2023/24 global coffee production would climb +5.8% y/y to 178 million bags due to an exceptional off-biennial crop year. ICO also projects global 2023/24 coffee consumption will rise +2.2% y/y to 177 million bags, resulting in a 1 million bag coffee surplus.
The USDA’s Foreign Agriculture Service (FAS), in its biannual report released on December 21, projected that world coffee production in 2023/24 will increase +4.2% y/y to 171.4 million bags, with a +10.7% increase in arabica production to 97.3 million bags, and a -3.3% decline in robusta production to 74.1 million bags. The USDA’s FAS forecasts that 2023/24 ending stocks will fall by -4.0% to 26.5 million bags from 27.6 million bags in 2022-23. The USDA’s FAS projects that Brazil’s 2023/24 arabica production would climb +12.8% y/y to 44.9 mln bags due to higher yields and increased planted acreage. The USDA’s FAS also forecasts that 2023/24 coffee production in Colombia, the world’s second-largest arabica producer, will climb +7.5% y/y to 11.5 mln bags.
More Coffee News from Barchart
On the date of publication, Rich Asplund did not have (either directly or indirectly) positions in any of the securities mentioned in this article. All information and data in this article is solely for informational purposes. For more information please view the Barchart Disclosure Policy here.
The views and opinions expressed herein are the views and opinions of the author and do not necessarily reflect those of Nasdaq, Inc.
OPEC is expected to extend the output cuts into 2H 2024 in an effort to stave off a surplus and support crude prices already contending with fragile Chinese economic outlook and rising non-OPEC supplies. The shift to a virtual meeting indicated that there might be no major policy changes. Markets have already discounted such an outcome and thus don’t see any major impact on prices post the policy.
Oil prices have given up most of the middle east geo-political risk premium seen in April amid lack of supply disruptions, other than isolated events at the Red sea. Without the disruption of actual barrels of oil, any gains might be capped. The odds of a direct conflict between Iran and Israel or US is also very minimal ahead of the US presidential election in November.
Elevated inflation in US and resilience in the economy have prompted Fed officials to be more hawkish this quarter and swaps are now expecting only a single quarter point rate cut this year, during Q4. EIA expects global oil demand to slightly outpace supply this year, leading to a small deficit of around 100 kbpd. Q4 is generally a period of lower demand. Chinese economic recovery will be crucial for oil demand.
OPEC is likely to extend the curbs through the second half of this year and might start unwinding from early 2025. Crude is expected to trade in a range of $70 – $90 per bbl this year, with OPEC keeping a floor under prices. Even though oil demand is expected to see an uptick from June amid the onset of summer driving season in northern hemisphere, we are not expecting any sustained increase in prices above $100 per bbl, amid higher interest rates, Chinese economic uncertainty and US elections.
OPEC+ crude output represents about 41 per cent of global oil production. The group’s main objective is to regulate the supply of oil to the global market. The leaders are Saudi Arabia and Russia, which produce and nine million and 9.3 million bpd of oil respectively. Angola, which joined OPEC in 2007, quit the bloc at the start of this year, citing disagreements over production levels. Ecuador quit OPEC in 2020 and Qatar in 2019.
You are on Mint! India’s #1 news destination (Source: Press Gazette). To learn more about our business coverage and market insights Click Here!
An upside breakout of the pennant is indicated on a decisive rally above yesterday’s high of 2.83. Once the recent trend high of 2.92 is broken to the upside, a bullish breakout of the declining trend channel will also occur. If that happens, the prior swing high of 3.39 becomes the next higher target, followed by the 2023 peak at 3.64. Higher up is the target derived from the measuring objective of the pennant pattern. Its target is 3.78.
The pennant pattern is in an interesting position, holding support of the 20-Day and 200-Day MAs, while further testing resistance at the top trendline. It has the potential to lead to an explosive rally in natural gas. The pullback from the recent trend high has been minor, not even reaching the 38.2% Fibonacci retracement.
This is a sign of strength as buyers could have been waiting for lower prices to get more aggressive. As the price of natural gas consolidates within the pennant pattern it is building up energy for the next swing. The 0.95-point rally prior to the consolidation left a clue as to what may come next. Typically, a bull flag has the potential to match or exceed the rally prior to the consolidation pattern occurring.
On the downside, maintaining support above the 20-Day MA, currently at 2.545, is key to the current environment. The 20-Day MA showed strength recently as it rose above the 200-Day line recently after being below it since February 2. Notice that the 20-Day line is close to converging with the bottom boundary line of the pennant pattern. Following lower interim support levels being tested, natural would likely be headed towards an eventual test of support around 2.25 to 2.23. That first level is the 50% retracement.