The main tag of GoldPrice Articles.
You can use the search box below to find what you need.
[wd_asp id=1]
The main tag of GoldPrice Articles.
You can use the search box below to find what you need.
[wd_asp id=1]
You have reached your limit of 5 free articles for this month.
50% OFF and access to ALL our articles and insights.
Your coupon code
Spot Gold retreated from an intraday high of $2,319.79, with XAU/USD now trading below $2,310.00. Financial markets maintained the wait-and-see stance throughout Tuesday, as the macroeconomic calendar had nothing relevant to offer, and with first-tier events coming on Wednesday. Asian and European shares finished the day in the red and weighed on American indexes, which maintained the US Dollar on the winning side amid prevalent risk-aversion.
Investors await to hear from United States (US) policymakers, as the Federal Open Market Committee (FOMC) is undergoing a two-day meeting and will announce the outcome on Wednesday. The US central bank is widely anticipated to keep the Fed funds rate at the current rate of 5.25%-5.50%, and a rate cut is not seen until September at the earliest. Inflation has ticked marginally higher in the first quarter of the year, while the labor market remains tight, pushing the Federal Reserve (Fed) into maintaining a hawkish stance.
Ahead of the FOMC announcement, the country will release the May Consumer Price Index (CPI), foreseen up 0.1% MoM and 3.4% YoY, the latter matching the April reading. The figures tend to impact the FX board, despite the Fed’s preference to look at the Personal Consumption Expenditures (PCE) Price Index when making monetary policy decisions.
The daily chart for XAU/USD shows that bears retain control. The Momentum indicator bounced within negative levels, advancing but below its midline, while the Relative Strength Index (RSI) indicator aims to resume its slide at around 44. At the same time, the pair is trading below its 20 Simple Moving Average (SMA), while the longer moving averages maintain their upward slopes far below the current level.
In the near term, according to the 4-hour chart, the technical picture favors a downward extension. A firmly bearish 20 SMA cap advances while extending its slide below the 100 and 200 SMAs. Finally, technical indicators gain downward traction between negative levels, although not strong enough to suggest a break below the recent lows.
Support levels: 2,300.00 2,286.60 2,272.90
Resistance levels: 2,315.50 2,328.40 2,342.35
Spot Gold retreated from an intraday high of $2,319.79, with XAU/USD now trading below $2,310.00. Financial markets maintained the wait-and-see stance throughout Tuesday, as the macroeconomic calendar had nothing relevant to offer, and with first-tier events coming on Wednesday. Asian and European shares finished the day in the red and weighed on American indexes, which maintained the US Dollar on the winning side amid prevalent risk-aversion.
Investors await to hear from United States (US) policymakers, as the Federal Open Market Committee (FOMC) is undergoing a two-day meeting and will announce the outcome on Wednesday. The US central bank is widely anticipated to keep the Fed funds rate at the current rate of 5.25%-5.50%, and a rate cut is not seen until September at the earliest. Inflation has ticked marginally higher in the first quarter of the year, while the labor market remains tight, pushing the Federal Reserve (Fed) into maintaining a hawkish stance.
Ahead of the FOMC announcement, the country will release the May Consumer Price Index (CPI), foreseen up 0.1% MoM and 3.4% YoY, the latter matching the April reading. The figures tend to impact the FX board, despite the Fed’s preference to look at the Personal Consumption Expenditures (PCE) Price Index when making monetary policy decisions.
The daily chart for XAU/USD shows that bears retain control. The Momentum indicator bounced within negative levels, advancing but below its midline, while the Relative Strength Index (RSI) indicator aims to resume its slide at around 44. At the same time, the pair is trading below its 20 Simple Moving Average (SMA), while the longer moving averages maintain their upward slopes far below the current level.
In the near term, according to the 4-hour chart, the technical picture favors a downward extension. A firmly bearish 20 SMA cap advances while extending its slide below the 100 and 200 SMAs. Finally, technical indicators gain downward traction between negative levels, although not strong enough to suggest a break below the recent lows.
Support levels: 2,300.00 2,286.60 2,272.90
Resistance levels: 2,315.50 2,328.40 2,342.35
The increase in production will be led by the Permian, according to the EIA, and Eagle Ford.
This production outlook remains unchanged from the May version of the Short-Term Energy Outlook. Meanwhile, weekly U.S. crude oil production data published by the Energy Administration Information has held at an average of13.1 million barrels per day every week for the last twelve weeks.
For their global oil production outlook, the EIA sees OPEC+ largely adhering to its production targets announced earlier this month. While OPEC+ extended its production cuts, “our expectation is that OPEC+ crude oil production will follow these new targets until 2025. At that time, we expect that some OPEC+ producers will keep production below the targets in an effort to limit global oil inventory builds,” the EIA said in its report.
While crude oil production forecasts have held steady, pricing forecasts have not. In terms of pricing, the EIA is now forecasting Brent crude oil prices to average $84 per barrel in 2024, up from an average of $82 per barrel in 2023 and $101 per barrel in 2022. The EIA’s previous report forecast 2024 Brent spot pricing at $88.
For next year, the EIA held its Brent price forecast steady at $85 per barrel.
For natural gas, the report anticipates Henry Hub natural gas spot prices to average $2.50 per million British thermal units (MMBtu) in 2024-steady on 2023 levels but up from the $2.20/MMBtu forecasted for 2024 last month, with the agency forecasting U.S. marketed natural gas production increasing by 2% next year. For 2025, the EIA anticipates $3.20/MMBtu for natural gas.
By Julianne Geiger for Oilprice.com
More Top Reads From Oilprice.com:
Here are today’s energy prices:
OPEC is projecting oil demand growth of 2.2 million barrels per day for 2024 and 1.8 million bpd in 2025, according to the group’s monthly report. The oil producers see global economic growth of 2.8% this year and 2.9% in 2025.
OPEC expects the services sector to maintain stable momentum and drive economic growth in the second half of the year, “particularly supported by travel and tourism, with a consequent positive impact on oil demand.”
John Evans, analyst at oil broker PVM, said traders appeared to be “buying the dip” after many investors abandoned their long positions in the wake of the OPEC+ production decision.
“After oil prices experienced a bearish confluence of events, shook out much length and toyed with being oversold, there is almost an inevitability in the rally back to current levels,” Evans said in a note.
Money managers cut their net long position in Brent by 69% week over week to the lowest level since 2014 in the wake of the OPEC+ decision, according to JPMorgan.
Despite the bearish sentiment last week, Goldman Sachs forecast the market will enter into a deficit on summer fuel demand that will push Brent back up to $86 per barrel in the third quarter.
Phil Flynn, senior market analyst at the Price Futures Group, said “the market seemed to awaken” to the fact that the world is “sleepwalking into a global oil supply deficit” given OPEC’s production cuts remain in place for now and rig counts are falling in the U.S.
Traders are looking ahead to the conclusion of the Federal Reserve meeting and U.S. inflation data for May on Wednesday. The International Energy Agency will release its monthly oil market report the same day.
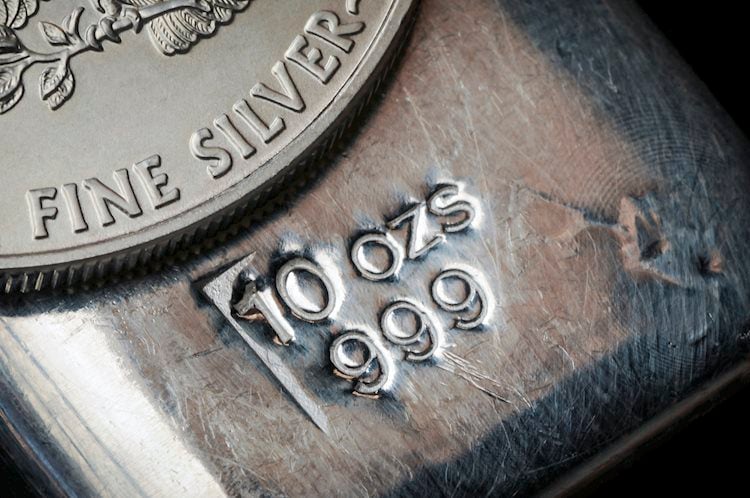
Silver price (XAG/USD) extends its downside to near the crucial support of $29.00 in Tuesday’s European session. The white metal weakens as the US Dollar (USD) and bond yields have performed strongly across the board due to a sharp decline in market expectations that the Federal Reserve (Fed) will start reducing interest rates from the September meeting.
Investors see the Fed lowering its key borrowing rates only once this year as fears for price pressures remaining persistent have deepened. The US Dollar Index (DXY) turns sideways after printing a fresh four-week high near 105.40. 10-year US Treasury yields have edged down to 4.44% in the London session but hold its strong recovery from 4.27%.
The next major triggers for the Silver price will be the May United States Consumer Price Index (CPI) data and the Fed’s interest rate decision. The CPI data will indicate whether the disinflation process is intact or has stalled. In the first quarter, the CPI report indicated that price pressures were higher than expected, while in April, they declined expectedly.
Meanwhile, the Fed’s decision is expected to remain status quo for the seventh time in a row as policymakers lack evidence that inflation is on course to return to the desired rate of 2%. Investors will focus on the Fed’s dot plot, which will indicate where policymakers see the federal fund rate heading. The CME FedWatch tool shows that 30-day Fed Fund Rate pricing data suggest only one rate-cut move this year.
Silver price trades close to the neckline of the Head and Shoulder (H&S) chart pattern, which is marked from May 24 low at $30.05 on a four-hour timeframe. A breakdown of the above-mentioned chart pattern results in a bearish reversal.
The near-term outlook remains uncertain after a bearish crossover of 20 and 50-day Exponential Moving Averages (EMAs) near $30.50.
The 14-period Relative Strength Index (RSI) has slipped into the 20.00-40.00 range, suggesting that the momentum has leaned toward the downside.
(This story was corrected on June 11 at 10:55 GMT to say, in the technical analysis section, that the neckline of the Head and Shoulders chart pattern is marked from the May 24 low at $30.05, not from the April 9 high at 1.0885.)
XAU/USD consolidates its recent losses around the $2,300 threshold on Monday, as fears fuel demand for the US Dollar and Gold. The pair plummeted on Friday, initially hit by news that the People’s Bank of China (PBoC) paused gold purchases in May after 18 months of buying and later amid resurgent US Dollar demand on the back of a stronger-than-anticipated Nonfarm Payrolls (NFP) report.
Over the weekend, the focus was on the European Parliament election, which saw a significant increase in votes for far-right parties, pushing financial markets into risk-averse mode at the beginning of the week. XAU/USD posted an intraday low of $2,287.65, holding above Friday’s bottom. European indexes settled in the red, although the better tone of Wall Street has helped XAU/USD recover some ground, now trading at around$2,310. Somehow, fears receded, although caution prevails.
The macroeconomic calendar had nothing relevant to offer, with the focus on first-tier events scheduled for later this week. Next Wednesday, the United States (US) will start the day by publishing the May Consumer Price Index (CPI), while the Federal Reserve (Fed) will announce its decision on monetary policy and fresh economic projections later in the day. The Bank of Japan (BoJ) monetary policy decision is also scheduled for this week, alongside monthly employment data from the United Kingdom (UK) and Australia.
The daily chart for XAU/USD shows its trading at the lower end of Friday’s range, with the risk still skewed to the downside. Technical indicators are bouncing just modestly from near oversold readings, without enough strength to anticipate another leg higher. At the same time, XAU/USD develops well below a flat 20 Simple Moving Average (SMA) while the longer ones maintain their upward slopes far below the current level.
In the near term, and according to the 4-hour chart, the technical picture is quite similar. Technical indicators are correcting oversold conditions but remain well into negative territory and with limited upward strength. At the same time, XAU/USD develops below all its moving averages, with the 20 SMA gaining downward traction below the longer ones, limiting the chances of a steeper recovery.
Support levels: 2,300.00 2,286.60 2,272.90
Resistance levels: 2,315.50 2,328.40 2,342.35
Today’s pullback follows three up days culminating in a long-term trendline breakout confirmed by last week’s close above the line. In addition, there was a bull breakout of a shorter-term pennant trend continuation pattern last week as well. The breakouts just began, so there should be more upside to go. However, how the price of natural gas behaves around key price levels will provide clues. All breakouts can fail and some follow through faster than others.
The pennant breakout should help maintain upward momentum (faster) as the long-term breakout of the trendline progresses (slower). Pullbacks should recover quickly and not retrace too deep. The area around support of the declining trendline is key for the bullish outlook to be maintained in the near term. However, if there is a daily close below the trendline, the risk of a deeper retracement rises.
There are several price areas to watch for support below the trendline. First, there is the top boundary line of the pennant. Thursday’s low is at 2.79 and be used as a guide as well since it bounced off support of the top boundary line. Further down is the 20-Day MA at 2.64 currently, and the 200-Day MA at 2.46.
On the upside, there is a target derived from the bull pennant up at 3.78. It remains to be seen whether that target will eventually be reached, and it could take a little time. Interim price targets include the swing high from January at 3.39 and the 2023 peak at 3.64. There is also the completion of an 88.6% Fibonacci retracement at 3.18.
For a look at all of today’s economic events, check out our economic calendar.
Goldman Sachs analysts forecast Brent crude to rise to $86 per barrel in the third quarter. They cite robust summer transport demand as a key factor, projecting a third-quarter deficit of 1.3 million barrels per day (bpd). Additionally, energy consultancy FGE anticipates oil prices reaching the mid-$80s in the third quarter. These projections suggest that the market’s current pessimism might be overdone, especially with expected declines in oil inventories in the coming weeks.
Despite ongoing OPEC+ production cuts, oil inventories have been rising. The latest data showed an increase in U.S. crude and gasoline stocks. Concerns are mounting over OPEC+’s plan to unwind some production cuts from October, potentially adding to the rising supply and exerting downward pressure on prices. The recent OPEC+ meeting has contributed to a bearish sentiment, with crude prices falling last week despite reassurances from key members like Saudi Arabia and Russia.
The strengthening dollar has also weighed on oil prices. The dollar rallied following a robust U.S. jobs report, leading investors to reassess the likelihood of near-term interest rate cuts. A stronger dollar makes oil more expensive for holders of other currencies, dampening demand. The euro, conversely, weakened after French President Emmanuel Macron called for a snap parliamentary election, further bolstering the dollar.
Various economic indicators have sent mixed signals to the oil market. The European Central Bank’s recent interest rate cut, the first since 2019, aims to address uncertain inflation, though high borrowing costs could slow economic activity and reduce oil demand. Meanwhile, China’s latest trade data showed a drop in oil imports despite strong export growth, highlighting ongoing demand concerns.
Given the expected rise in summer transport demand and projected inventory declines, the short-term outlook for oil prices appears cautiously bullish. However, the market’s response will depend heavily on concrete signals of tightening from inventory data and the impact of the strong dollar. Traders should watch for further updates on OPEC+ production plans and global economic developments to gauge the market’s direction.
You have reached your limit of 5 free articles for this month.
Access all our articles, insights, and analysts.
Your coupon code
XAU/USD consolidates its recent losses around the $2,300 threshold on Monday, as fears fuel demand for the US Dollar and Gold. The pair plummeted on Friday, initially hit by news that the People’s Bank of China (PBoC) paused gold purchases in May after 18 months of buying and later amid resurgent US Dollar demand on the back of a stronger-than-anticipated Nonfarm Payrolls (NFP) report.
Over the weekend, the focus was on the European Parliament election, which saw a significant increase in votes for far-right parties, pushing financial markets into risk-averse mode at the beginning of the week. XAU/USD posted an intraday low of $2,287.65, holding above Friday’s bottom. European indexes settled in the red, although the better tone of Wall Street has helped XAU/USD recover some ground, now trading at around$2,310. Somehow, fears receded, although caution prevails.
The macroeconomic calendar had nothing relevant to offer, with the focus on first-tier events scheduled for later this week. Next Wednesday, the United States (US) will start the day by publishing the May Consumer Price Index (CPI), while the Federal Reserve (Fed) will announce its decision on monetary policy and fresh economic projections later in the day. The Bank of Japan (BoJ) monetary policy decision is also scheduled for this week, alongside monthly employment data from the United Kingdom (UK) and Australia.
The daily chart for XAU/USD shows its trading at the lower end of Friday’s range, with the risk still skewed to the downside. Technical indicators are bouncing just modestly from near oversold readings, without enough strength to anticipate another leg higher. At the same time, XAU/USD develops well below a flat 20 Simple Moving Average (SMA) while the longer ones maintain their upward slopes far below the current level.
In the near term, and according to the 4-hour chart, the technical picture is quite similar. Technical indicators are correcting oversold conditions but remain well into negative territory and with limited upward strength. At the same time, XAU/USD develops below all its moving averages, with the 20 SMA gaining downward traction below the longer ones, limiting the chances of a steeper recovery.
Support levels: 2,300.00 2,286.60 2,272.90
Resistance levels: 2,315.50 2,328.40 2,342.35
XAU/USD consolidates its recent losses around the $2,300 threshold on Monday, as fears fuel demand for the US Dollar and Gold. The pair plummeted on Friday, initially hit by news that the People’s Bank of China (PBoC) paused gold purchases in May after 18 months of buying and later amid resurgent US Dollar demand on the back of a stronger-than-anticipated Nonfarm Payrolls (NFP) report.
Over the weekend, the focus was on the European Parliament election, which saw a significant increase in votes for far-right parties, pushing financial markets into risk-averse mode at the beginning of the week. XAU/USD posted an intraday low of $2,287.65, holding above Friday’s bottom. European indexes settled in the red, although the better tone of Wall Street has helped XAU/USD recover some ground, now trading at around$2,310. Somehow, fears receded, although caution prevails.
The macroeconomic calendar had nothing relevant to offer, with the focus on first-tier events scheduled for later this week. Next Wednesday, the United States (US) will start the day by publishing the May Consumer Price Index (CPI), while the Federal Reserve (Fed) will announce its decision on monetary policy and fresh economic projections later in the day. The Bank of Japan (BoJ) monetary policy decision is also scheduled for this week, alongside monthly employment data from the United Kingdom (UK) and Australia.
The daily chart for XAU/USD shows its trading at the lower end of Friday’s range, with the risk still skewed to the downside. Technical indicators are bouncing just modestly from near oversold readings, without enough strength to anticipate another leg higher. At the same time, XAU/USD develops well below a flat 20 Simple Moving Average (SMA) while the longer ones maintain their upward slopes far below the current level.
In the near term, and according to the 4-hour chart, the technical picture is quite similar. Technical indicators are correcting oversold conditions but remain well into negative territory and with limited upward strength. At the same time, XAU/USD develops below all its moving averages, with the 20 SMA gaining downward traction below the longer ones, limiting the chances of a steeper recovery.
Support levels: 2,300.00 2,286.60 2,272.90
Resistance levels: 2,315.50 2,328.40 2,342.35
Drivers are getting a bit of a break at the gas station: The national average price of regular unleaded has slipped to $3.47 per gallon, after peaking at almost $3.70 earlier this year. Fuel demand has been a bit weaker than normal for this time of year, and crude oil prices have pulled back, leading to lower costs at the retail level. That’s good news for the summer travel season and for tamping down overall inflation.
Profit and prosper with the best of expert advice on investing, taxes, retirement, personal finance and more – straight to your e-mail.
Profit and prosper with the best of expert advice – straight to your e-mail.
To continue reading this article
please register for free
This is different from signing in to your print subscription
Why am I seeing this? Find out more here
Silver price recovers the previous session’s losses, trading around $29.50 per troy ounce during Monday’s Asian hours. The better-than-expected US employment data released on Friday has caused traders to delay their expectations of a Fed rate cut. This sentiment has put pressure on non-yielding assets like Silver.
According to the US Bureau of Labor Statistics (BLS), May’s US Nonfarm Payrolls (NFP) increased by 272,000, up from 165,000 in April. The stronger employment data has attracted buyers to the US Dollar (USD), which has dampened the demand for Silver by making the commodity more expensive for buyer countries using other currencies.
The US Dollar Index (DXY), which measures the value of the US Dollar (USD) against six major currencies, continues to rise due to higher US Treasury yields. The DXY extends gains to near 105.20 with 2-year and 10-year yields on US Treasury bonds standing at 4.88% and 4.44%, respectively, at the time of writing.
A strong US jobs report could cause the Federal Reserve to keep higher rates for an extended period. According to the CME FedWatch Tool, the probability of a Fed rate cut of at least 25 basis points in September has decreased to nearly 48.0%, down from 54.8% a week ago.
However, Rabobank suggested in its report that the Fed may cut rates in September and December, more likely because of a deteriorating economy. This is because they think that the US economy is entering a stagflationary phase with persistent inflation and an economic slowdown that is likely to end in a mild recession later this year.