
Category: Crypto News, News
Why is Cardano going down today?
- Cardano’s price is falling on Tuesday as it faces rejection around $0.624 and traders engaged in profit-taking following the recent rally.
- Technical indicators show signs of weakness in upward momentum as the RSI exits from the overbought territory.
- ADA’s NPL chart shows spikes, suggesting that holders are realizing profits and increasing the selling pressure.
Cardano (ADA) price extends its decline for a second consecutive session on Wednesday, trading down by more than 7% at around $0.53 after rallying over 80% the previous week. The main reason for the decline is that traders are taking profits, while technical indicators suggest further downside is likely.
Why is Cardano going down today?
Cardano price is falling more than 7% on Wednesday after a 6.9% fall on Tuesday. The decline can broadly be attributed to profit-taking activity, on-chain data shows.

Santiment’s Network Realized Profit/Loss (NPL) indicator – a widely used metric to gauge profit-taking activity – posted the strongest spike since mid-March, signaling the highest profit-taking activity in at least eight months following the approximately 80% rally seen last week. The metric rose from 9.58 million on Saturday to 93.96 million on Monday, almost 10 times. Such a spike is increasing the selling pressure on Cardano.
Cardano Network Realized Profit/Loss chart. Source: Santiment
Cardano’s technical outlook shows signs of bullish exhaustion as the Relative Strength Index (RSI) has exited the overbought threshold and trades at 67 on the daily chart, a clear sell signal.
Moreover, ADA faced multiple rejections of around $0.624 this week and has declined more than 12% since Tuesday, adding more credence to its fall.
If Cardano continues to decline, it could extend the correction by an additional 16% to retest its next daily support at $0.448.

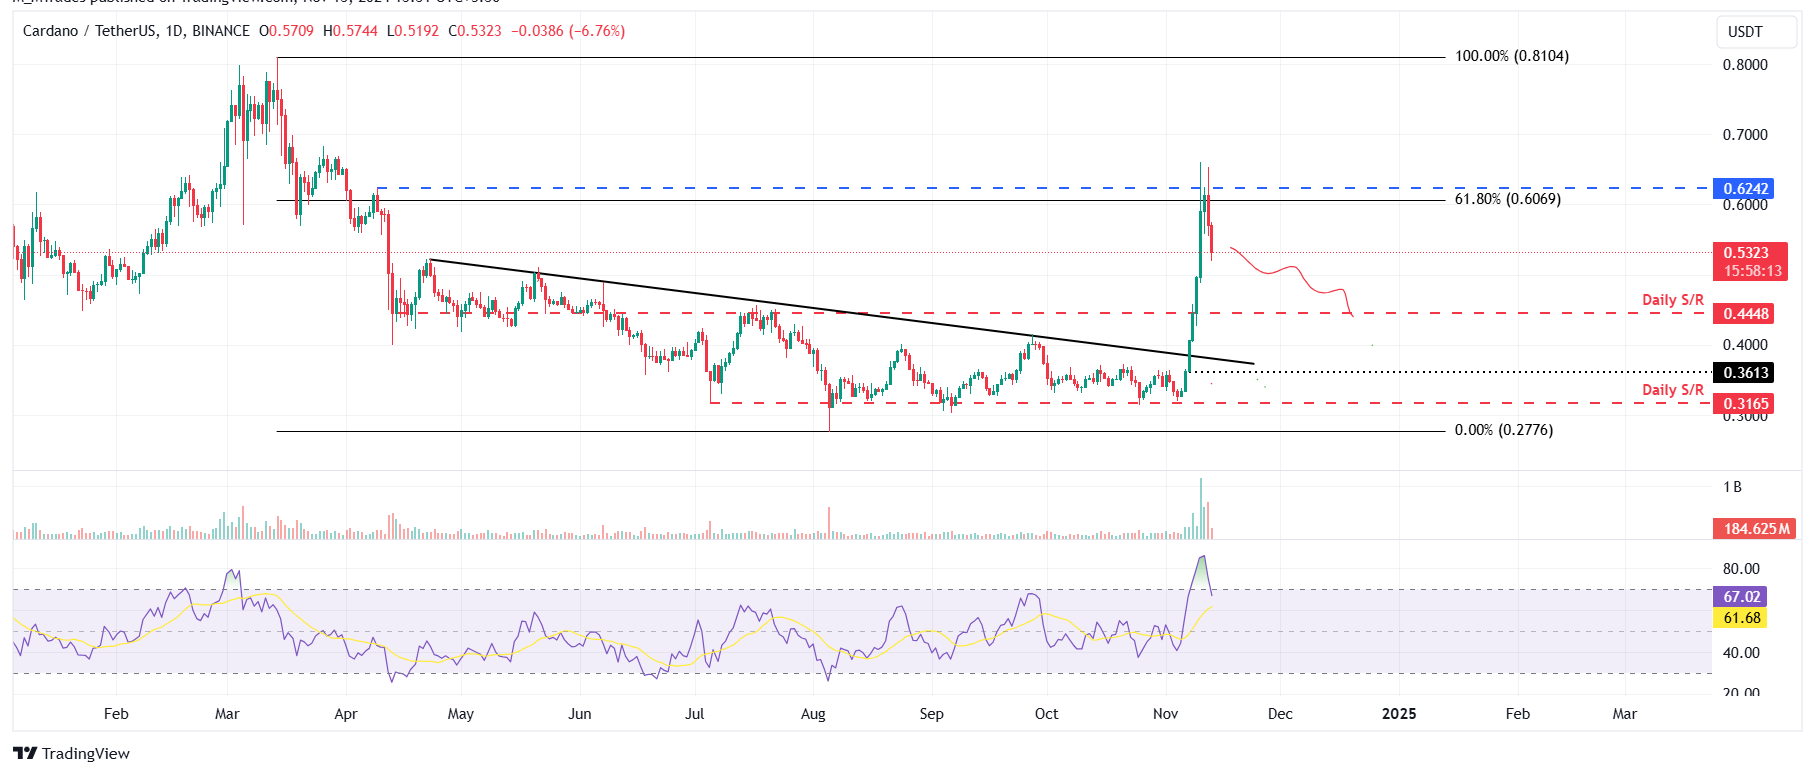
ADA/USDT daily chart
Traders’ price outlook for Cardano turns bearish
Coinglass data shows that ADA’s long-to-short ratio is at 0.84 on Wednesday, the lowest level in one month. A figure below one suggests that more traders are betting on Cardano’s price to fall.
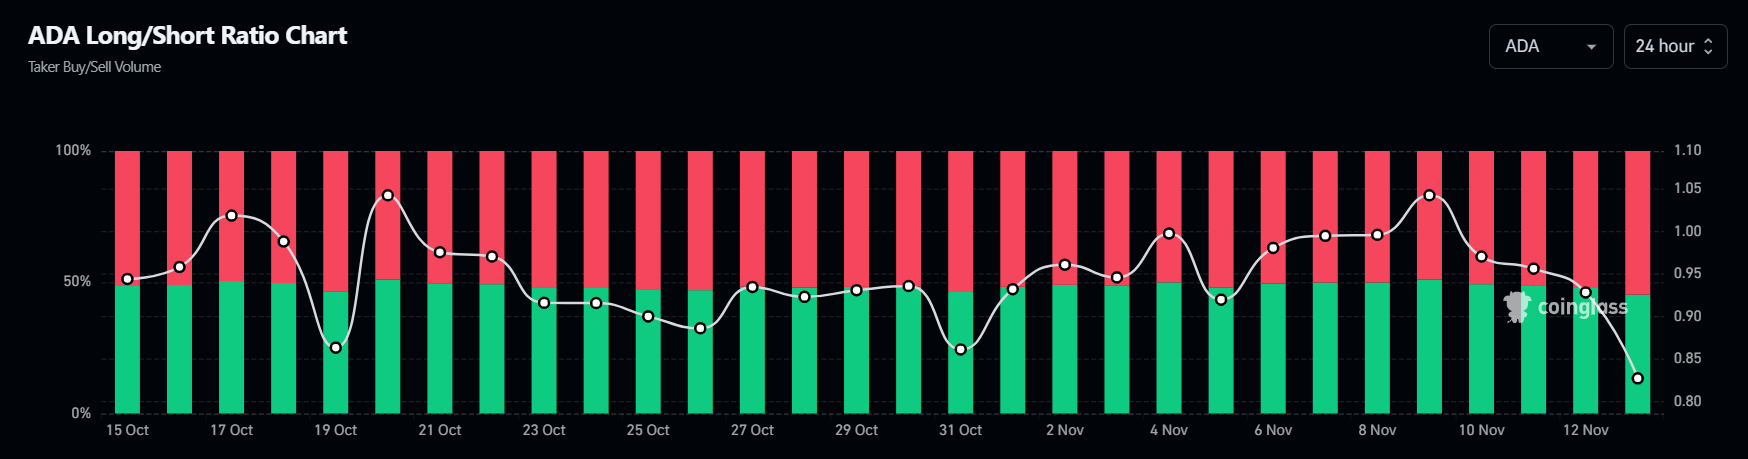
ADA long-to-short ratio chart. Source: Coinglass
Cryptocurrency metrics FAQs

Written by : Editorial team of BIPNs
Main team of content of bipns.com. Any type of content should be approved by us.


Share this article: