About Editorial team of BIPNs

Main team of content of bipns.com. Any type of content should be approved by us.
23 06, 2025

Global Probiotics Market Surges Amid Rising Demand for Gut

By |2025-06-23T09:52:20+03:00June 23, 2025|Dietary Supplements News, News|0 Comments


Probiotics Market

The Global Probiotics Market reached USD 62.4 billion in 2022 and is expected to reach USD 108.0 billion by 2031 and is expected to grow with a CAGR of 7.1% during the forecast period 2024-2031.

The Probiotics Market, as examined by DataM Intelligence, provides a thorough industry overview enriched with detailed insights, historical data, and essential statistics. The report extensively explores market dynamics and competitive landscapes, featuring profiles of leading companies, their product offerings, pricing strategies, financials, growth plans, and geographic footprint.

Unlock exclusive insights with our detailed sample report (Corporate Email ID to get priority access) @ https://datamintelligence.com/download-sample/probiotics-market?sz

The Probiotics Market refers to the global industry focused on products containing live microorganisms, primarily beneficial bacteria and yeast, which, when consumed in adequate amounts, offer health benefits. These products are widely used in functional foods, animal feed, and beverages to support gut health, immunity, and overall well-being, driven by increasing consumer awareness of preventive healthcare.

Prominent Industry players in the Probiotics Market

The prominent players in Probiotics market research report are: Koninklijke DSM N.V., Evolve BioSystems, Inc., Nature’s Bounty Co., Lifeway Foods, Inc., Danone S.A, Yakult Honsha Co., Ltd., BioGaia AB, CHR. Hansen Holding A/S, Lallemand Inc., and The Procter & Gamble Company.

The companies are primarily focusing on strategies such as new product launches to penetrate the fastest-growing emerging markets across the world.

Industry News

On January 27, 2021, Wellbeing Nutrition (WBN), a leading plant-based nutrition brand in India, introduced its Probiotic + Prebiotic formula. This clinically-studied, plant-based supplement is designed to support gut health, addressing a range of digestive concerns naturally and effectively.

On February 18, 2021, Probi, a probiotics specialist, entered a semi-exclusive agreement with Perrigo, a global player in over-the-counter wellness. The collaboration aimed to bring science-backed probiotic solutions for digestive and immune health to 14 European countries. Under the agreement, Perrigo launched three probiotic dietary supplements utilizing Probi’s clinically supported strains.

Speak to Our Senior Analyst and Get Customization in the report as per your requirements @ https://datamintelligence.com/customize/probiotics-market

Market Segments

By Ingredient: Bacteria, Yeast.

By Application: Functional Food and Beverages, Fermented Vegetables, Dietary Supplements, Animal Feed.

By Distribution Channel; Online, Hypermarkets and Supermarkets, Drug Stores, Others.

The Probiotics industry is undergoing swift expansion, fueled by breakthroughs in medical technology, growing demand for cutting-edge therapies, and an increasing emphasis on patient-centric care. As the sector advances, in-depth market analysis is essential to track evolving trends, regulatory developments, and new opportunities.

Regions Covered:

The global Probiotics Market report focuses on six major regions: North America, South America, Europe, Asia Pacific, the Middle East, and Africa.

☞ North America – US, Canada, Mexico

☞ Europe- Germany, Russia, UK, France, Italy, Rest of Europe

☞ Asia Pacific- China, India, Japan, Australia, Rest of Asia Pacific

☞ South America- Brazil, Argentina, Colombia, Rest of South America

☞ Middle East and Africa- Saudi Arabia, UAE, Oman, Bahrain, Qatar, Kuwait, Israel

FAQs:

✒ What is driving the growth of the Probiotics Market?

✒ Who are the prominent players in the Probiotics Market?

✒ How is the regulatory landscape affecting the Probiotics Market?

✒ What regions are expected to see the highest growth?

✒ What are the key challenges faced by the Probiotics Market?

Stay informed with the latest industry insights-start your subscription now: https://www.datamintelligence.com/reports-subscription

Looking for Full Report? Get it Here: https://www.datamintelligence.com/buy-now-page?report=probiotics-market?sz

Contact Us –

Company Name: DataM Intelligence

Contact Person: Sai Kiran

Email: Sai.k@datamintelligence.com

Phone: +1 877 441 4866

Website: https://www.datamintelligence.com

About Us –

DataM Intelligence is a Market Research and Consulting firm that provides end-to-end business solutions to organizations from Research to Consulting. We, at DataM Intelligence, leverage our top trademark trends, insights and developments to emancipate swift and astute solutions to clients like you. We encompass a multitude of syndicate reports and customized reports with a robust methodology.

Our research database features countless statistics and in-depth analyses across a wide range of 6300+ reports in 40+ domains creating business solutions for more than 200+ companies across 50+ countries; catering to the key business research needs that influence the growth trajectory of our vast clientele.

This release was published on openPR.



Source link

23 06, 2025

Here’s How High XRP Could Reach in 15 to 25 Years

By |2025-06-23T09:44:05+03:00June 23, 2025|Crypto News, News|0 Comments

Given its utility and prominence in the crypto market, many see XRP as one of the digital assets likely to endure over the coming decades.

As a result, projections about XRP’s future price are both high and ambitious. Currently trading around $2, many have speculated that the coin could reach as high as $10,000 in the coming decades.

This article compiles commentary from various experts on where XRP’s price could be in 15 years (2040) and 25 years (2050).

How High XRP Could Go in 15 Years

According to Matthew Brienen, COO of CryptoCharged, XRP could be trading as high as $1,000 during the 2040s. He expressed this in a viral video, highlighting XRP’s utility in the multi-trillion-dollar cross-border payment market.

This would represent a massive 46,411% increase from XRP’s current price of around $2.15. Moreover, such a valuation would imply a market cap of approximately $60 trillion, assuming the circulating supply remains around 60 million tokens.

Notably, analysts at the crypto exchange Changelly agree with Brienen’s perspective. They have projected prices as high as $1,456 for XRP by November 2040. This would mark a 66,997.5% return on investment (ROI) from today’s price.

However, the exchange also noted that if this four-digit valuation does not materialize, XRP could still average in the triple-digit range. Their lowest projected price for XRP by 2040 is $181.72. This would still represent an 8,352% ROI from today’s value, a substantial return.

Telegaon analysts also share a bullish outlook. They forecast a minimum price of $119 and a maximum value of $160.34 for XRP in the next 15 years.

Implications for Investors

For investors holding 10,000 XRP (worth about $21,500 today), even the most conservative estimates suggest that the portfolio could rise to over $1.2 million. In the most ambitious scenarios, the investment could grow to more than $14 million.

How High XRP Could Go in 25 Years

Looking further ahead, XRP’s long-term outlook becomes even more optimistic. According to Changelly, the minimum projected price for XRP by 2050 is $1,389.58. For holders of 10,000 XRP, this would equate to a portfolio worth nearly $14 million in a conservative scenario.

Interestingly, Changelly’s analysis suggests that XRP could reach a maximum of $2,355 by 2050, an astonishing 108,448.4% increase from today’s price.

On the other hand, Telegaon’s analysts offer more modest projections. They forecast a maximum price of $285.56 for XRP by 2050. While this is significantly lower than Changelly’s estimate, it would still result in considerable gains. At that price, a 10,000 XRP portfolio would be worth approximately $3 million.

Will XRP Reach These Prices?

While there’s no guarantee that XRP will hit any of these projected prices, the overall consensus is optimistic that it will be significantly higher than its current value over the next few decades. Several factors could contribute to XRP’s growth:

  • Utility: XRP’s role in cross-border payments continues to be a key driver.
  • Institutional Adoption: Increasing interest from financial institutions adds legitimacy and demand.
  • Market Maturation: As the broader crypto market matures, XRP could benefit from more stable and widespread use.

Numerous financial institutions have included XRP in their treasury reserves, with collective holdings estimated at over $1 billion.

DisClamier: This content is informational and should not be considered financial advice. The views expressed in this article may include the author’s personal opinions and do not reflect The Crypto Basic opinion. Readers are encouraged to do thorough research before making any investment decisions. The Crypto Basic is not responsible for any financial losses.

Source link

23 06, 2025

XAU/USD’s struggle with $3,400 extends amid Middle East escalation

By |2025-06-23T07:55:38+03:00June 23, 2025|Forex News, News|0 Comments


  • Gold price closes in the bullish opening gap as sellers fight back control early Monday.
  • US Dollar strengthens on risk aversion due to the US involvement in the Israel-Iran conflict.
  • Gold price falls back to the critical 21-day SMA support at $3,351, with the bullish daily RSI.

Gold price has come under moderate selling pressure and reverts toward $3,350 early Monday, having faced rejection just shy of the $3,400 threshold.

Gold price awaits US PMIs, Fedspeak amid Middle East woes

In doing so, Gold price filled in the bullish opening gap of about $25, led by the market’s reaction to the weekend news of the US military involvement in the Israel-Iran conflict.

Early Sunday, US President Donald Trump announced that the United States (US) carried out airstrikes on three of Iran’s most critical nuclear sites, Fordow, Natanz and Isfahan.

In response, Supreme Leader Ayatollah Khamenei warned that American involvement would bring “irreparable damage.”

Markets fret over the Israel-Iran conflict translating into a wider Middle East regional war if Iran opts to retaliate with the closure of the Strait of Hormuz, which is the key passage of oil exports.

This nervousness has strengthened the haven demand for the US Dollar (USD), weighing on the USD-denominated Gold price.

Further, markets seem to believe that Iran may refrain from escalating the conflict by way of blocking the Strait of Hormuz even though its parliament has approved such a move.

This narrative appears to have reinforced selling in Oil prices, rendering negative for the inflation-hedge Gold price. Markets believed the Middle East escalation-driven surge in Oil price could stoke inflationary fears worldwide.

Attention now turns to the preliminary readings of S&P Global PMI data, especially from the Euro area and the US to gauge the health of the economies globally.

Downbeat data could rekindle global growth concerns, reviving the safe-haven appeal of the Gold price.

Additionally, if Iran retaliates firmly to the US bombing by accelerating its attacks on Israel and US bases, buyers could swing back in action amid investors’ run for cover in the ultimate traditional haven Gold price.

Speeches from several US Federal Reserve (Fed) policymakers will also be closely scrutinized after the Fed’s hawkish hold policy decision last week.

Gold price technical analysis: Daily chart

The daily chart shows that Gold price is back to testing the critical short-term support of the 21-day Simple Moving Average (SMA) at $3,351, breaching the 23.6% Fibonacci Retracement (Fibo) level of the April record rally once again at $3,377.

A failure to resist above the 21-day SMA on a daily closing basis will open up a fresh downtrend toward the 50-day SMA at $3,321, below which the 38.2% Fibo level at $3,297 will be threatened.

That said, Gold buyers remain hopeful so long as the 14-day Relative Strength Index (RSI) holds above the midline. The leading indicator is currently pointing south, near 53.

If the bright metal stages a comeback, it will need acceptance above the mentioned support-turned-resistance at $3,377.

The next topside target is seen at $3,400, above which the static resistance at $3,440 will be tested.

Buyers will then take on the two-month highs of $3,453.

Gold FAQs

Gold has played a key role in human’s history as it has been widely used as a store of value and medium of exchange. Currently, apart from its shine and usage for jewelry, the precious metal is widely seen as a safe-haven asset, meaning that it is considered a good investment during turbulent times. Gold is also widely seen as a hedge against inflation and against depreciating currencies as it doesn’t rely on any specific issuer or government.

Central banks are the biggest Gold holders. In their aim to support their currencies in turbulent times, central banks tend to diversify their reserves and buy Gold to improve the perceived strength of the economy and the currency. High Gold reserves can be a source of trust for a country’s solvency. Central banks added 1,136 tonnes of Gold worth around $70 billion to their reserves in 2022, according to data from the World Gold Council. This is the highest yearly purchase since records began. Central banks from emerging economies such as China, India and Turkey are quickly increasing their Gold reserves.

Gold has an inverse correlation with the US Dollar and US Treasuries, which are both major reserve and safe-haven assets. When the Dollar depreciates, Gold tends to rise, enabling investors and central banks to diversify their assets in turbulent times. Gold is also inversely correlated with risk assets. A rally in the stock market tends to weaken Gold price, while sell-offs in riskier markets tend to favor the precious metal.

The price can move due to a wide range of factors. Geopolitical instability or fears of a deep recession can quickly make Gold price escalate due to its safe-haven status. As a yield-less asset, Gold tends to rise with lower interest rates, while higher cost of money usually weighs down on the yellow metal. Still, most moves depend on how the US Dollar (USD) behaves as the asset is priced in dollars (XAU/USD). A strong Dollar tends to keep the price of Gold controlled, whereas a weaker Dollar is likely to push Gold prices up.


Source link

23 06, 2025

Cardano Price Prediction: ADA Risks Freefall Toward $0.41 If April Lows Break

By |2025-06-23T07:42:59+03:00June 23, 2025|Crypto News, News|0 Comments

Cardano is testing a crucial support near $0.50, with bearish momentum building and a potential retest of April lows now on the table.

Cardano is starting to lose its footing after another failed attempt to push higher. The recent move off support lacked strength, and now the price is sliding back toward familiar lows. Momentum has shifted, the setup is beginning to look fragile, and sentiment is turning cautious as key levels come back into focus.

Cardano is trading around $0.55, down -5.83% in the last 24 hours. Source: Brave New Coin

Cardano At Make or Break Level

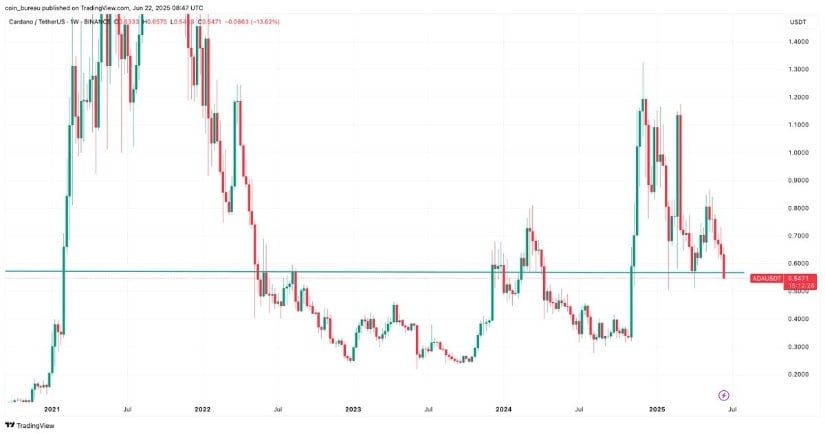
Cardano is now standing down in one of the most important levels in recent days. According to Coin Bureau Trading, ADA is approaching high-time-frame support at $0.49, a zone that represents both the point of control and the highest volume node within its current trading range. This isn’t just a random level; it’s a structural pivot that has historically separated bullish continuation from full breakdown.

Cardano Price Prediction: ADA Risks Freefall Toward alt=

ADA Cardano price approaches critical support at $0.49, a key structural level that could define its next major trend. Source: Coin Bureau Trading via X

If this $0.49 level holds, the upside target opens toward $1.19, aligning with prior macro highs and liquidity gaps. But if ADA slips below this support, especially with volume, it could trigger a fast move down to the $0.30 region, where previous capitulation zones lie.

Cardano Price Faces Pressure Below Descending Trendline

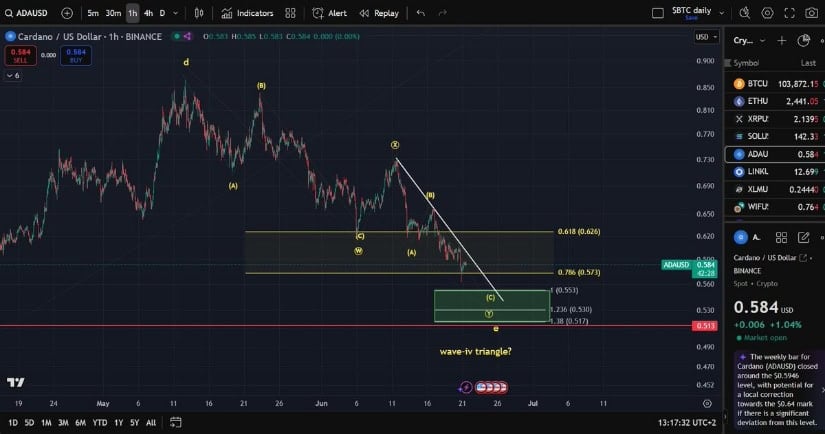
Building on the critical $0.49 level identified earlier, new analysis from Man of Bitcoin adds more caution to the short-term picture. ADA remains stuck under a descending trendline, and as long as it stays capped there, price action looks biased for at least one more sweep lower. The chart highlights a possible wave structure pointing towards a low in the $0.510 to $0.505 range, right in the green demand zone.

Cardano Price Faces Pressure Below Descending Trendline

ADA below a descending trendline, with Fibonacci targets hinting at further downside into key demand zones. Source: Man of Bitcoin via X

Technically, the area between the 1.236 and 1.38 Fibonacci levels lines up with the previous breakdown target zones. Now, until a bottom forms, price structure remains tilted toward lower lows unless bulls can reclaim the trendline with momentum.

ADA Slides to 8th in Grayscale’s Weekly

Cardano has dropped to the 8th position in Grayscale’s latest 1-week returns snapshot, logging a -9.4% decline. While the broader market saw red across the board, ADA stood out on the weaker end of performance. This drop aligns with what’s playing out on the chart: ADA is hovering just below the $0.50 zone.

ADA Slides to 8th in Grayscale’s Weekly

Cardano’s ADA drops -9.4% and falls to 8th in Grayscale’s weekly returns. Source: Angry Crypto Show via X

Technical signals remain under pressure. Price continues to reject descending trendlines, and bearish wave structures are still active, suggesting momentum is poised towards the downside. Unless buyers step in soon, ADA risks slipping further, not just in price, but also in its place among the majors.

Cardano Breakdown Eyes April Low Retest

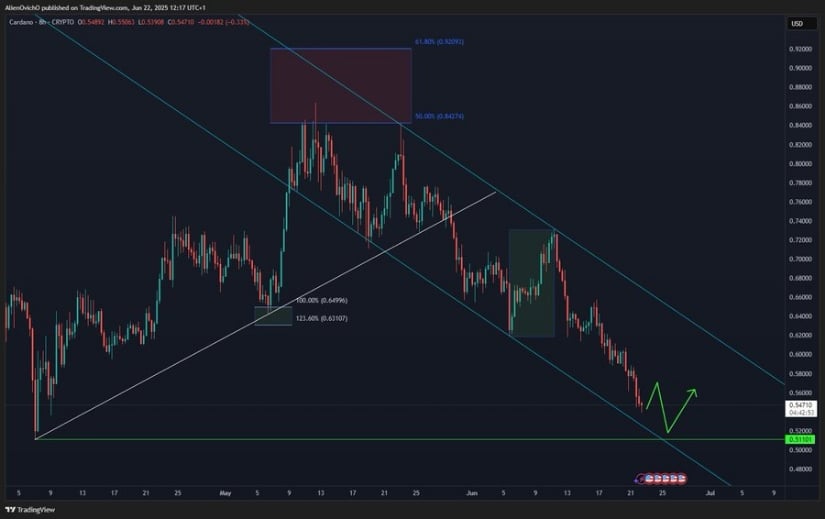
Cardano’s bounce attempt has failed once again. After a brief reaction off support, ADA couldn’t build momentum and is now slipping back into its broader downtrend. According to analyst AlienOvichO, price action remains heavy, and the lack of follow-through leaves ADA vulnerable to a retest of its April lows.

Cardano Breakdown Eyes April Low Retest

Cardano struggles to hold ground as breakdown risks mount, with eyes now on a potential retest of April’s low. Source: AlienOvichO via X

Right now, there’s no clean reversal setup in play. A confirmed break below April’s low could open the door to deeper downside, potentially targeting the $0.41 area. On the flip side, only a sharp bounce and trendline reclaim would revive any real bullish case for the ADA Cardano price.

Final Thoughts: Is ADA Lining Up For A Major Dip?

Cardano is clearly at a crossroads. The failure to rally from key support has tilted momentum back to the downside, and the lack of any strong reversal signal means traders are now eyeing a retest of the April lows. If $0.45 breaks, $0.41 isn’t far off, and from a structural standpoint, that’s a level that could trigger a sharper drop if confidence fades further.

That said, ADA still has room to defend itself. Bulls need to show up now, or risk losing further support in the process. Until ADA Cardano price sees a decisive reclaim of the descending trendline and some volume behind it, the trend remains under pressure.


Source link

23 06, 2025

XRP, SOL, ETH, HYPE Oversold Bounce Possible If BTC Recovers

By |2025-06-23T05:41:56+03:00June 23, 2025|Crypto News, News|0 Comments

Key points:

  • Bitcoin fell below the $100,000 support on Sunday, but a rebound could depend on how US stock futures open.

  • Bitcoin’s weakness has pulled ETH, XRP, SOL, and HYPE below their respective support levels.

Bitcoin (BTC) nosedived below the psychological $100,000 support on Sunday as traders digested the US strike on Iran’s nuclear facilities. Popular trader Cas Abbe said in a post on X that Bitcoin could drop toward the $93,000 to $94,000 zone before starting a reversal. 

Bitcoin’s weakness has spread to several major altcoins, which have entered a deeper correction by breaking below their respective support levels. This suggests the sentiment has soured, and traders are taking risk off the table.

Crypto market data daily view. Source: Coin360

However, a positive sign is that analysts remain bullish on Bitcoin for the long term. Real Vision CEO Raoul Pal said in a recent video that the current crypto cycle resembles the pattern seen in 2017. He expects the crypto cycle to extend into Q2 2026

Could Bitcoin bulls push the price back above $100,000, or will bears remain in control? Will select altcoins find buyers at lower levels? Let’s study the charts to find out.

Bitcoin price prediction

Bitcoin broke below the 50-day simple moving average ($104,788) on Friday and the $100,000 support on Sunday.

BTC/USDT daily chart. Source: Cointelegraph/TradingView

The moving averages are on the verge of a bearish crossover, and the relative strength index (RSI) is in the negative territory, indicating that bears are in control. If the price maintains below $100,000, the selling could intensify, pulling the BTC/USDT pair to $93,000.

Buyers will have to push the price above the 20-day exponential moving average ($104,616) to prevent the downside in the near term. The pair could then rise to the downtrend line, which is likely to pose a substantial challenge for the bulls.

BTC/USDT 4-hour chart. Source: Cointelegraph/TradingView

The pair completed a bearish descending triangle pattern on a close below the $100,700 level. The pattern target of the negative setup is $89,420, but the bulls are unlikely to give up easily.

Buyers will try to start a relief rally, which could face selling at $100,700 and then at the 20-EMA. If the price turns down from the overhead resistance, the pair may deepen the correction. 

The bulls will have to drive and maintain the price above the 50-SMA to start a meaningful recovery.

Ether price prediction

Ether (ETH) turned down from the 20-day EMA ($2,487) and fell below the 50-day SMA ($2,481) on Friday.

ETH/USDT daily chart. Source: Cointelegraph/TradingView

Selling continued on Saturday, and the ETH/USDT pair broke below the $2,323 support. Buyers tried to push the price back above the breakdown level of $2,323, but renewed selling by the bears has pulled the pair near the $2,111 support. The bulls will try to defend the $2,111 level with all their might because a break below it may sink the pair to $1,754.

If the price rebounds off $2,111, the bulls will have to push the pair back above the 20-day EMA to suggest that the near-term correction may have ended.

ETH/USDT 4-hour chart. Source: Cointelegraph/TradingView

The pair could find support at the $2,111 level, but the rebound is expected to face strong selling at the breakdown level of $2,323. If the price turns down sharply from $2,323, the bears will again try to sink the pair below $2,111.

Conversely, if the bulls successfully defend the $2,111 level, the pair could form a range in the near term. The pair may swing between $2,111 and $2,323 for some time. The selling pressure could weaken on a close above the 50-SMA.

XRP price prediction

XRP’s (XRP) range between $2 and $2.65 resolved to the downside on Sunday, indicating increased selling pressure from the bears. 

XRP/USDT daily chart. Source: Cointelegraph/TradingView

If the price sustains below $2, the XRP/USDT pair could tumble to the $1.61 support. Buyers are expected to vigorously defend the $1.61 level because a break below it may start a collapse to $1.28.

The bulls will have to swiftly push the price back above the breakdown level of $2 to prevent a breakdown. The pair could then rise to the moving averages, where the bears are likely to pose a strong challenge.

XRP/USDT 4-hour chart. Source: Cointelegraph/TradingView

The bulls tried to start a bounce off the $2 support, but the bears aggressively sold near the 20-EMA on the 4-hour chart. The price turned down and broke below the $2 support, pulling the RSI into the oversold territory. That suggests a relief rally is possible in the short term.

On the upside, the bears may sell the recovery attempt at $2 and above that at the 20-EMA. If the price turns down sharply from the overhead resistance, the pair risks a further downside. A close above the 50-SMA will be the first sign that the selling pressure is reducing.

Related: Here’s what happened in crypto today

Solana price prediction

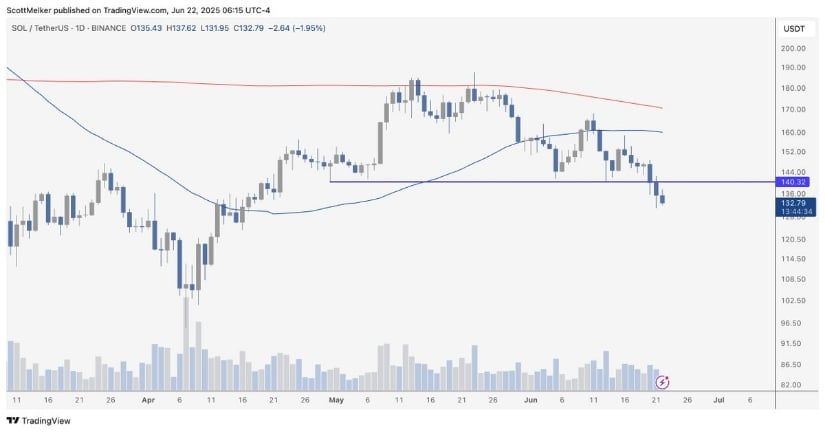
Solana (SOL) completed a bearish H&S pattern when the price closed below the $140 support on Saturday.

SOL/USDT daily chart. Source: Cointelegraph/TradingView

The bulls will try to start a recovery but may face selling at the 20-day EMA ($148). If the price turns down from the 20-day EMA, the SOL/USDT pair could plunge to the $110 support and eventually to the pattern target of $93.

Conversely, a break and close above the 20-day EMA suggests solid demand at lower levels. The pair could rise to the 50-day SMA ($160), which is likely to behave as a strong obstacle.

SOL/USDT 4-hour chart. Source: Cointelegraph/TradingView

The downsloping moving averages signal that bears are in command, but the oversold level on the RSI points to a possible relief rally in the near term. Recovery attempts could face selling at the breakdown level of $140. If the price turns down from $140, the bears will try to resume the downward move.

Buyers will have to push and maintain the price above the 50-SMA to signal a comeback. That opens the doors for a relief rally to $149 and thereafter to $158.

Hyperliquid price prediction

Repeated failures to maintain the price above $42.50 started a sharp correction in Hyperliquid (HYPE), signaling that the bulls are hurrying to book profits.

HYPE/USDT daily chart. Source: Cointelegraph/TradingView

The bulls held the 50-day SMA ($32.26) on Saturday, but the bounce has been sold into. That increases the possibility of a break below the 50-day SMA. The HYPE/USDT pair could descend to the breakout level of $28.50.

Buyers are likely to have other plans. They will try to defend the 50-day SMA and push the price back above the 20-day EMA. If they manage to do that, the pair could climb to $40. 

HYPE/USDT 4-hour chart. Source: Cointelegraph/TradingView

Both moving averages are sloping down, and the RSI is in the negative zone on the 4-hour chart. Pullbacks to the 20-EMA are likely to be sold into. There is minor support at $30.50, but it could be broken. The pair may then plummet to the solid support at $28.50.

The first sign of strength will be a break and close above the 20-EMA. That suggests the bears are losing their grip. The pair may ascend to the 50-SMA, which could again attract sellers.

This article does not contain investment advice or recommendations. Every investment and trading move involves risk, and readers should conduct their own research when making a decision.