About Editorial team of BIPNs

Main team of content of bipns.com. Any type of content should be approved by us.
11 06, 2025

Functional Foods & Supplements: The Future of

By |2025-06-11T17:15:56+03:00June 11, 2025|Dietary Supplements News, News|0 Comments


Nutraceuticals Market

Global Nutraceuticals Market reached US$ 443.1 billion in 2023 and is expected to reach US$ 684.2 billion by 2031, growing with a CAGR of 5.58% during the forecast period 2024-2031.

The Nutraceuticals Market is extensively analyzed in the latest study by DataM Intelligence, delivering a well-rounded assessment backed by reliable statistics, historical data, and strategic insights. This report profiles leading industry players, examining their product offerings, pricing strategies, financial health, and growth initiatives. It offers a clear perspective on market dynamics, competitive landscape, and emerging trends that are set to shape the industry’s future.

Unlock exclusive insights with our detailed sample report (Please enter your Corporate Email ID to get priority access):- https://datamintelligence.com/download-sample/nutraceuticals-market?rk

Nutraceuticals are food products or supplements that provide health and medicinal benefits beyond basic nutrition. They include vitamins, minerals, probiotics, and functional foods, aimed at preventing diseases and enhancing well-being. Nutraceuticals are widely used in managing chronic conditions like diabetes and heart disease. The growing interest in wellness and preventive healthcare drives the demand for these products globally.

List of the Key Players in the Nutraceuticals Market:

Danone S.A., Glanbia plc, Nestle S.A., Bayer AG, Abbott Nutrition, GNC Holdings, LLC, Garden of Life, NOW Foods, Kellanova and Parry Nutraceuticals Limited.

Nutraceuticals Industry Development:

❁ In September 2024, Floré introduced a specialized probiotic line designed to support neurodiversity, focusing on pathways and mood support for individuals with autism spectrum disorder (ASD). Developed in partnership with Arizona State University, the formulations are grounded in a clinical study that demonstrated significant improvements in gastrointestinal health and cognitive abilities among ASD participants after three months of use.

Research Methodology

Our research methodology combines both qualitative and quantitative approaches to provide you with a thorough market analysis. We begin by gathering data from trusted industry reports and databases (secondary research), followed by primary research through surveys and interviews with key experts. We then apply advanced statistical tools to analyze the data, uncover trends, and assess market dynamics. Additionally, we use market segmentation and Porter’s Five Forces analysis to evaluate competition. This approach ensures that the insights we provide are reliable, actionable, and tailored to support your decision-making process.

Speak to Our Senior Analyst and Get Customization in the report as per your requirements: https://datamintelligence.com/customize/nutraceuticals-market

Segment Covered in the Nutraceuticals Market:

By Type: Herbals, Proteins & Peptides, Vitamins & Minerals, Prebiotics and Probiotics, Others.

By Product: Functional Food, Functional Beverages, Dietary Supplements, Personal Care.

By Source: Plant-Based, Animal-Based, Microbial.

By Distribution Channel: Supermarkets/Hypermarkets, Convenience Stores, Specialty Stores, Drug Stores/Pharmacies, Online Retail Stores, Other.

By Application: Health and Wellness, Sports Nutrition, Clinical Nutrition.

This Report Covers:

✔ Go-to-market Strategy.

✔ Neutral perspective on the market performance.

✔Development trends, competitive landscape analysis, supply side analysis, demand side analysis, year-on-year growth, competitive benchmarking, vendor identification, Market Access, and other significant analysis, as well as development status.

✔Customized regional/country reports as per request and country level analysis.

✔ Potential & niche segments and regions exhibiting promising growth covered.

✔ Analysis of Market Size (historical and forecast), Total Addressable Market (TAM), Serviceable Available Market (SAM), Serviceable Obtainable Market (SOM), Market Growth, Technological Trends, Market Share, Market Dynamics, Competitive Landscape and Major Players (Innovators, Start-ups, Laggard, and Pioneer).

Regional Analysis for Nutraceuticals Market:

⇥ North America (U.S., Canada, Mexico)

⇥ Europe (U.K., Italy, Germany, Russia, France, Spain, The Netherlands and Rest of Europe)

⇥ Asia-Pacific (India, Japan, China, South Korea, Australia, Indonesia Rest of Asia Pacific)

⇥ South America (Colombia, Brazil, Argentina, Rest of South America)

⇥ Middle East & Africa (Saudi Arabia, U.A.E., South Africa, Rest of Middle East & Africa)

Benefits of the Report:

➡ A descriptive analysis of demand-supply gap, market size estimation, SWOT analysis, PESTEL Analysis and forecast in the global market.

➡ Top-down and bottom-up approach for regional analysis

➡ Porter’s five forces model gives an in-depth analysis of buyers and suppliers, threats of new entrants & substitutes and competition amongst the key market players.

➡ By understanding the value chain analysis, the stakeholders can get a clear and detailed picture of this Market

Frequently asked questions:

➠ What is the global sales value, production value, consumption value, import and export of Nutraceuticals market?

➠ Who are the global key manufacturers of the Nutraceuticals Industry? How is their operating situation (capacity, production, sales, price, cost, gross, and revenue)?

➠ What are the Nutraceuticals market opportunities and threats faced by the vendors in the global Nutraceuticals Industry?

➠ Which application/end-user or product type may seek incremental growth prospects? What is the market share of each type and application?

➠ What focused approach and constraints are holding the Nutraceuticals market?

➠ What are the different sales, marketing, and distribution channels in the global industry?

Stay informed with the latest industry insights-start your subscription now: https://www.datamintelligence.com/reports-subscription

Contact Us –

Company Name: DataM Intelligence

Contact Person: Sai Kiran

Email: Sai.k@datamintelligence.com

Phone: +1 877 441 4866

Website: https://www.datamintelligence.com

About Us –

DataM Intelligence is a Market Research and Consulting firm that provides end-to-end business solutions to organizations from Research to Consulting. We, at DataM Intelligence, leverage our top trademark trends, insights and developments to emancipate swift and astute solutions to clients like you. We encompass a multitude of syndicate reports and customized reports with a robust methodology.

Our research database features countless statistics and in-depth analyses across a wide range of 6300+ reports in 40+ domains creating business solutions for more than 200+ companies across 50+ countries; catering to the key business research needs that influence the growth trajectory of our vast clientele.

This release was published on openPR.



Source link

11 06, 2025

Here’s What 10,000 XRP Costs Today as Compared to 1 and 5 Years Ago

By |2025-06-11T17:11:10+03:00June 11, 2025|Crypto News, News|0 Comments

Concerns about XRP becoming too expensive resonate more when investors look at how the price of 10,000 XRP has changed over the years.

Notably, commentaries around this possibility have dominated the XRP community in recent times, especially in light of the asset’s meteoric surge from November 2024 to January 2025. For context, XRP soared nearly 600% within this period to hit a peak of $3.4.

Following a correction from this top, community pundits like Edoardo Farina have insisted that investors should amass more XRP tokens now that the asset trades for $2. They believe the $2 value is affordable in comparison to the potential price XRP could attain in the future.

Specifically, Farina has consistently suggested that market participants procure at least 10,000 XRP tokens. In one of his latest disclosures, he advised urgency. According to Farina, amid the global economic trend, up to 99% of retail investors could be priced out of the XRP market as the asset’s value continues to expand.

Cost of Purchasing 10,000 XRP Over the Years

To ascertain how this could happen, The Crypto Basic recently compared the cost of procuring 10,000 XRP tokens over the years. Particularly, a year ago, exactly on June 11, 2024, XRP traded for $0.48. At this price, an investor could amass 10,000 XRP tokens for just $4,800.

However, going further back, the capital requirement was even lower. For instance, exactly five years ago, on June 11, 2020, XRP changed hands around $0.19. With this price, investors who sought to amass 10,000 tokens would have spent a mere $1,900. 

Now, as XRP trades for $2.29, these 10,000 tokens are currently valued at $22,900. Essentially, today, it would take $19,000 more to procure 10,000 XRP than five years ago. Moreover, it would cost an investor $18,100 more to purchase 10,000 XRP than it would just a year ago.

Notably, while it would have cost more to procure 10,000 XRP in January 2018 than it is now, analysts believe the sort of downtrend that plagued the market from 2018 is a thing of the past, suggesting there could only be an upward push from here. This trend is the reason behind commentaries such as Edoardo Farina’s. 

Farina Doubles Down

In his latest remark, he questioned if the growing cost of purchasing crypto assets was due to a rise in the token’s cost or a decline in fiat currencies. Regardless, he has advised investors to save in digital assets like XRP instead of fiat. 

Recall that Australian attorney Bill Morgan pushed back on Farina’s recent commentary, suggesting that investors would still be able to procure XRP regardless of its future price. 

In response, Farina clarified that his comment bordered more on the idea that the rising cost of large XRP holdings like 10,000 XRP could make owning such a balance unattainable for the average investor. According to him, 10,000 XRP now costs $23,000, and this already is unattainable to some investors. However, this was not the case in 2020, as we recently found.

DisClamier: This content is informational and should not be considered financial advice. The views expressed in this article may include the author’s personal opinions and do not reflect The Crypto Basic opinion. Readers are encouraged to do thorough research before making any investment decisions. The Crypto Basic is not responsible for any financial losses.


Source link

11 06, 2025

Solana (SOL) Aims for $300, Leads Weekly dApp Revenue!

By |2025-06-11T15:31:01+03:00June 11, 2025|News, NFT News|0 Comments


Jakarta, Pintu News – Although Solana has decreased in value today, May 13, strong fundamental analysis points to a potential price increase of up to $300.

On-chain data shows that the Solana blockchain has outperformed all other layer one and layer two networks, a bullish indicator for the token.

On Monday, the SOL briefly touched the $180 mark before experiencing strong rejection as traders took profits, which led the price back to $171.

Check out the full analysis here!

Bullish Outlook for Solana Price

Solana price is currently in a decisive phase, trying to break the resistance line of the ascending parallel channel that has rejected it several times. However, by successfully defending the centerline support, the chances of breaking the upper resistance are opening up, which could trigger further price gains.

In addition, a golden cross formation looks set to occur as the 20-day EMA moves up and approaches convergence with the 200-day EMA. If these two trend lines continue to show the same pattern and cross, this could trigger the next bullish phase for SOL prices past the $177 resistance level, towards the previous record high of $296, and potentially reach $300.

The RSI indicator also confirmed that momentum is still bullish, with a reading of 69 indicating strong buying pressure. This suggests that Solana (SOL) may soon cross $200.

Also read: X SEC account hacker gets caught up in the law, sentenced to 2 years in prison!

Solana Outperforms All Layer 1 and Layer 2 Networks

Source: Coingape

In terms of revenue generated by decentralized applications (dApps), the Solana blockchain has surpassed all other layer one and layer two networks last week. According to data from DeFiLlama, Solana’s revenue exceeded $50 million, with network dominance reaching 51.6%, more than three times that of Ethereum at just 14.23%.

This revenue growth is a bullish indicator for SOL prices as it could boost investor confidence and push up the price of the altcoin. Data from DappRadar also shows that in the last seven days, dApp volume on the Solana network increased by 50% to $1.61 billion, while transactions during the week reached $138 million.

This surge may be related to the SOL meme coin craze that has pushed their market capitalization above $14 million.

Read also: LAUNCHCOIN Skyrocketed Over 200% Today May 14, 2025, What’s the Main Factor?

Rising Open Interest Supports Bullish Case

Open interest for Solana continues to show an upward trend, and despite recent price drops, this metric continues to rise and recently reached $6.92 billion, the highest level since late January.

The increase in open interest indicates high confidence among traders that SOL prices will continue to rise. This underlines Solana’s positive price forecast, as the bulls target the next key level above $200 and reach a new record high above $300.

Therefore, as the Solana blockchain continues to grow and outperform other layer one and layer two networks, SOL prices may continue to trend upwards and potentially reach new highs above $300.

Conclusion

With a range of favorable technical and fundamental indicators, the upside outlook for Solana (SOL) looks very bright. The combination of strong price defense, increasing open interest, and dApp revenue dominance puts Solana in a great position to reach higher market values in the near future.

That’s the latest information about crypto. Follow us on Google News to stay up-to-date on the world of crypto and blockchain technology.

Enjoy an easy and secure crypto trading experience by downloading Pintu crypto app via Google Play Store or App Store now. Also, experience web trading with advanced trading tools such as pro charting, various types of order types, and portfolio tracker only at Pintu Pro. Pintu Pro Futures is also available, where you can buy bitcoin leverage, trade btc futures, eth futures and sol futures easily from your desktop!

*Disclaimer

This content aims to enrich readers’ information. Pintu collects this information from various relevant sources and is not influenced by outside parties. Note that an asset’s past performance does not determine its projected future performance. Crypto trading activities have high risk and volatility, always do your own research and use cold cash before investing. All activities of buying and selling bitcoin and other crypto asset investments are the responsibility of the reader.

Reference


Source link

11 06, 2025

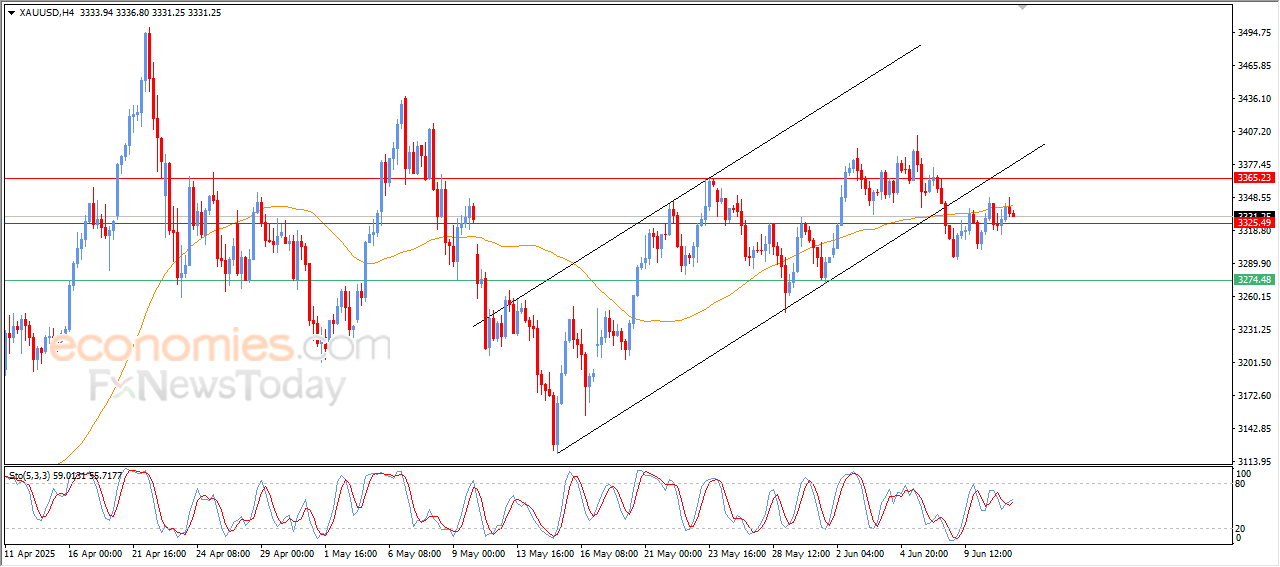
Forecast update for Gold -11-06-2025

By |2025-06-11T15:22:03+03:00June 11, 2025|Forex News, News|0 Comments


The EURNZD failed to record any new positive target, due to the continuation of the contradiction between the main indicators, to notice its approach from the moving average 55 at 1.8810, reinforcing the stability of the bullish channel’s support at 1.8785.


Depending on the stability of the previously mentioned main support, we will keep waiting for positive momentum in the near period, to ease the mission of recording positive stations by its rally to 1.8960 initially, then attempt to press on the intraday obstacle at 1.9050.


The expected trading range for today is between 1.8860 and 1.8960


Trend forecast: Bullish


Source link

11 06, 2025

EUR/USD Analysis Today 11/6 Cautious Stability Ahead (Chart)

By |2025-06-11T15:20:10+03:00June 11, 2025|Forex News, News|0 Comments

EUR/USD Analysis Summary Today

  • Overall Trend: Bullish
  • Today’s EUR/USD Support Levels: 1.1370 – 1.1300 – 1.1220
  • Today’s EUR/USD Resistance Levels: 1.1470 – 1.1520 – 1.1600

EUR/USD Trading Signals:

  • Buy EUR/USD from the support level of 1.1340 with a target of 1.1420 and a stop-loss at 1.1300.
  • Sell EUR/USD from the resistance level of 1.1480 with a target of 1.1200 and a stop-loss at 1.1540.

EUR/USD Technical Analysis Today:

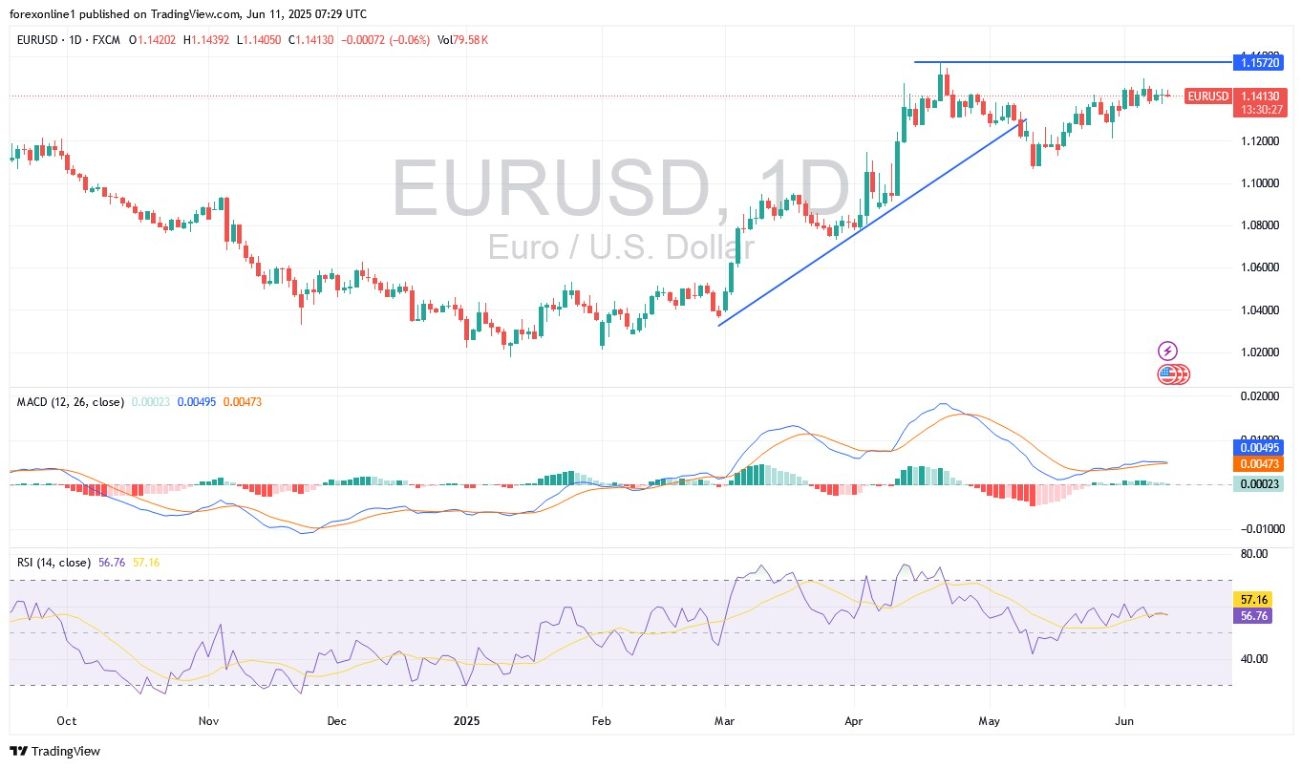
As anticipated, the EUR/USD pair remains within its current range, showing bullish momentum as markets and investors await the release of US inflation figures later today. These figures, due at 3:30 PM Egypt time, will significantly impact market expectations for the future monetary policies of the US Federal Reserve. Yesterday, the EUR/USD price jumped to the 1.1447 resistance level, close to its three-year high of 1.1572 recorded in April, as traders closely monitored developments in ongoing US-China trade talks.

Trading Advice:

We still recommend selling the EUR/USD on any upward bounce and avoiding risk, regardless of the strength of the trading opportunities.

Meanwhile, investors are assessing comments from European Central Bank (ECB) officials for clues on the bank’s next policy moves. Governing Council member François Villeroy de Galhau indicated that the ECB can still act quickly to adjust interest rates, even after its eighth consecutive cut, which he stated “returned to normal” in monetary policy. Last week, the ECB cut interest rates as expected, but Governor Christine Lagarde suggested that the monetary easing cycle might be nearing its end. The deposit facility rate is now 2%, while Eurozone inflation fell to 1.9% in May 2025. Concurrently, the bloc’s economy grew by 0.6% in the first quarter of 2025, its fastest growth rate since Q3 2022.

Technical Outlook for EUR/USD Today:

Based on the daily timeframe chart, the EUR/USD currency pair remains on a bullish trajectory, supported by the stability of currency bulls around and above the 1.1400 resistance. This stability is pushing the 14-day RSI (Relative Strength Index) near the 60 reading, which reinforces bull dominance and anticipates stronger gains before the indicator reaches overbought territory. Simultaneously, the MACD (Moving Average Convergence Divergence) indicator confirms the upward path. The bulls’ next key targets are the resistance levels of 1.1520 and 1.1600, with signs of overbought conditions likely to begin around the latter level. Conversely, over the same period, the support levels of 1.1220 and 1.1165 remain crucial for bears to break the current bullish trend of the currency pair.

Goldman Sachs Raises EUR/USD Price Forecast

Goldman Sachs has raised its forecasts for the EUR/USD pair, citing relatively weaker equity performance for Euro-based investors, declining foreign appetite for US assets, and a confirmed slowdown in US economic activity. On another note, according to performance across stock trading platforms, US equities may appear stable in USD value, but they have fallen by 8% year-to-date for Euro investors, making EU stocks relatively more attractive. Overall, the less appealing US investment climate is prompting global investors to diversify their investments away from the US dollar and USD-denominated assets.

Recently, recent macroeconomic indicators support the narrative of slowing US economic activity, reinforcing the argument for continued USD depreciation.

Consequently, Goldman Sachs has raised its EUR/USD targets to:1.17 over 3 months

1.20 over 6 months
1.25 over 12 months

These targets are higher than the previous 1.12, 1.15, and 1.20 set after the “Liberation Day” policy announcement. In general, Goldman Sachs maintains its structurally bearish outlook on the US dollar, driven by macroeconomic divergence and global capital reallocation. From their perspective, the EUR/USD trend remains bullish, with 1.25 now being the 12-month target.

Ready to trade our EUR/USD analysis and predictions? Here are the best European brokers to choose from.

Source link

11 06, 2025

⁠7 Low-Calorie Summer Drinks That Don’t Compromise On Taste

By |2025-06-11T15:15:13+03:00June 11, 2025|Dietary Supplements News, News|0 Comments


Cucumber Mint Cooler:

This drink is a blend of cucumber, mint, and lemon, and it’s very hydrating, especially during peak summer. In addition, it has low calories.


Coconut Water with Lemon:

This drink is low in calories and rich in electrolytes. And the lemon and coconut combo is more revitalizing.


Watermelon Basil Juice:

This juice is packed with antioxidants and hydration and in addition less calories.


Aam Panna (Raw Mango Drink):

This traditional Indian drink is made from raw mangoes and also it is low in sugar while loaded with vitamins.


Iced Green Tea with Citrus:

This drink is packed with antioxidants, contains green tea with a splash of orange or lemon that makes it zesty.


Buttermilk (Chaas):

This Indian classic and homemade drink is spiced yogurt based, rich in probiotics and also helps to aid digestion.


Aloe Vera Lime Juice:

This summer drink does not only have less calories but is also detox friendly.


DISCLAIMER:-

This web story is meant for informational purposes only and must not be considered a substitute for advice provided by qualified medical professionals


Source link

11 06, 2025

Ethereum ($ETH) Price Prediction for June 12 2025

By |2025-06-11T15:10:14+03:00June 11, 2025|Crypto News, News|0 Comments

After a sharp rebound from early June lows, the Ethereum price today is holding firm near $2,795, pushing into a significant resistance band between $2,800 and $2,835. 

This comes after ETH registered a clean breakout from consolidation on the 4-hour chart, supported by expanding Bollinger Bands and sustained volume. The price now sits just beneath the 0.5 Fibonacci retracement level from the 2024–2025 drop, setting the stage for a potential continuation move.

What’s Happening With Ethereum’s Price?

On the weekly chart, ETH is retesting the 0.5 Fib level at $2,845 after a multi-week recovery from $1,385 lows. The larger structure suggests the trend has turned bullish, with the 0.618 retracement at $3,148 now acting as the next macro target if $2,845 is breached.

Zooming into the daily chart, Ethereum price action has pushed into a grey supply zone that triggered prior breakdowns. This zone overlaps with both descending trendline resistance and a historical liquidity pocket, making it a critical level for bulls to flip into support. A successful breakout above $2,835 would clear the path toward $3,000 and $3,150 in the short term.

Momentum Indicators Support the Breakout Case

Ethereum’s recent rally is backed by strong momentum on the lower timeframes. On the 4-hour chart, ETH has reclaimed all major EMAs (20/50/100/200), with the 20 EMA crossing above the 100 and 200 lines — a bullish realignment last seen in late April. The price is also pressing the upper Bollinger Band at $2,861.86, suggesting increased Ethereum price volatility and a potential breakout setup.

The 30-minute RSI is steady near 57.5, just below overbought territory, indicating bulls still have room to push higher. Meanwhile, the MACD line remains above signal despite a narrowing histogram, suggesting bullish momentum is intact but may need a fresh impulse to accelerate.

On the Ichimoku chart, the price is comfortably above the cloud with Tenkan-Sen and Kijun-Sen flattening near $2,785. This signals a pause in immediate trend strength, but the overall bias remains positive as long as ETH stays above $2,746 (cloud base). The Stochastic RSI is turning up from oversold levels (22.74), adding early signs of renewed upside pressure.

Why is the Ethereum Price Going Up Today? Bullish Breakout From Range Structure

The answer to why Ethereum price going up today lies in the multi-timeframe breakout visible across charts. On the 4-hour structure chart, ETH broke above a symmetrical triangle and reclaimed the $2,700–$2,730 demand zone. This breakout aligned with a break in the descending trendline from May’s high, forming a new higher low at $2,430 and confirming a bullish trend shift.

The 30-minute chart shows a well-supported bullish flag breakout, followed by consolidation above $2,775. A minor diagonal resistance exists near $2,834, and a decisive move above it could trigger aggressive long positioning toward $2,900 and beyond.

Ethereum Price Forecast for June 12

Looking forward, Ethereum price update signals a high-stakes test of the $2,835 ceiling. If buyers break through with strong volume, upside targets at $2,900 and $3,050 become active. However, failure to hold above $2,775 would expose ETH to a pullback toward $2,713 and $2,660 — areas aligned with the 20 and 50 EMA clusters on the 4-hour chart.

Macro structure remains constructive, with the 0.5 and 0.618 Fib retracement levels ($2,845 and $3,148) framing the next directional zone. Traders should closely watch the RSI and MACD signals for confirmation of breakout momentum.

Ethereum Price Forecast Table: June 12

Indicator / Zone Level (USD) Signal
Resistance 1 2,835 Key breakout level
Resistance 2 3,050 Next upside target
Support 1 2,775 Holding zone post breakout
Support 2 2,713 Short-term downside risk
200 EMA (4H) 2,467 Major dynamic support
RSI (30-min) 57.5 Bullish-neutral momentum
MACD (30-min) Positive Fading, but still bullish
Ichimoku Cloud (30-min) Bullish Price above cloud
Stoch RSI (30-min) Turning up Early bullish crossover
Bollinger Bands (4H) Expanding Breakout potential rising

Disclaimer: The information presented in this article is for informational and educational purposes only. The article does not constitute financial advice or advice of any kind. Coin Edition is not responsible for any losses incurred as a result of the utilization of content, products, or services mentioned. Readers are advised to exercise caution before taking any action related to the company.

Source link

11 06, 2025

Platinum price resumes the rise– Forecast today – 11-6-2025

By |2025-06-11T13:20:54+03:00June 11, 2025|Forex News, News|0 Comments


Copper price remains stable until this moment below $4.8900 level, which decelerates the chances for renewing the bullish attempts, to keep preferring the sideways bias domination in the near trading, and there is a possibility to form some correctional waves that target $4.7500 reaching $4.6600 level.


While the price success to breach the mentioned barrier and hold above it will reinforce the chances for renewing the bullish attempts, to expect reaching $5.0300 followed by the next barrier at $5.1000.


The expected trading range for today is between $4.7500 and $4.8900


Trend forecast: Fluctuated within the bullish track


Source link

11 06, 2025

GBP/USD Price Analysis: Soft Jobs Stoke BoE Rate Cut Odds

By |2025-06-11T13:19:02+03:00June 11, 2025|Forex News, News|0 Comments

  • The GBP/USD price analysis suggests increasing expectations for Bank of England rate cuts.
  • The UK labor market was weaker in the three months to April.
  • Market participants are awaiting the US consumer inflation report.

The GBP/USD price analysis suggests increasing expectations for Bank of England rate cuts this year after downbeat UK employment data. Meanwhile, market participants remain cautious ahead of crucial US inflation figures. 

Are you interested to learn more about crypto signals? Check our detailed guide-

Data on Tuesday revealed that the UK labor market was weaker in the three months to April. The unemployment rate reached an almost four-year high, rising from 4.5% to 4.6%. At the same time, wage growth slowed sharply from 5.5% to 5.2%. 

The downbeat figures increased BoE rate cut expectations and weighed on the pound. Before the report, traders were 39-bps of rate cuts this year. This figure increased to 48-bps after the data. 

Meanwhile, market participants are awaiting the US consumer inflation report, scheduled for release on Wednesday. According to estimates, inflation increased by 0.2% in May. Meanwhile, the annual figure increased by 2.5%, above the previous reading of 2.3%. 

A hotter-than-expected reading would confirm the Fed’s fears that Trump’s tariffs have increased price pressure. Moreover, it would lower Fed rate cut expectations, boosting the dollar. On the other hand, if inflation is softer, it will weigh on the dollar by increasing bets for a Fed rate cut.

GBP/USD key events today

  • US core CPI m/m
  • US CPI m/m
  • US CPI y/y

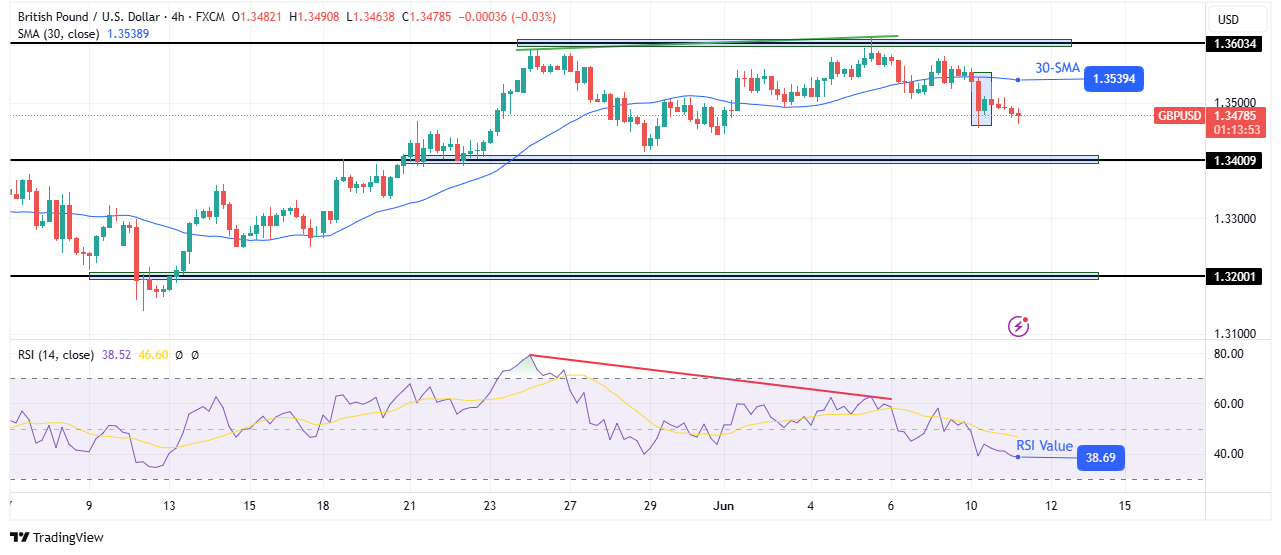
GBP/USD technical price analysis: Bears find their feet below the 30-SMA

GBP/USD Price Analysis: Soft Jobs Stoke BoE Rate Cut Odds
GBP/USD 4-hour chart

On the technical side, the pound is finding its feet below the 30-SMA after a recent shift in sentiment. Meanwhile, the RSI trades nearer the oversold region, indicating solid bearish momentum. However, after a strong break below the SMA, momentum has eased, and price action shows hesitation to continue lower. The price is now making small-bodied candles. 

Are you interested to learn more about forex robots? Check our detailed guide-

Nevertheless, the bearish bias has strengthened, and the path is clear for GBP/USD to reach the 1.3400 support level. A break below this level will strengthen the bearish bias and allow the price to target the 1.3200 support. 

However, if the level holds firm, bulls might return for a pullback. However, the bearish bias will remain strong as long as the price stays below the 30-SMA.

Looking to trade forex now? Invest at eToro!

67% of retail investor accounts lose money when trading CFDs with this provider. You should consider whether you can afford to take the high risk of losing your money.

Source link

11 06, 2025

Berberine for Weight Loss: Does It Work?

By |2025-06-11T13:14:11+03:00June 11, 2025|Dietary Supplements News, News|0 Comments


If you’re looking for a way to lose weight, you may have heard of berberine, a traditional Chinese medicine (TCM) that’s been used for more than 400 years, mainly to treat diarrhea and other gastrointestinal infections.

Advertisement

Cleveland Clinic is a non-profit academic medical center. Advertising on our site helps support our mission. We do not endorse non-Cleveland Clinic products or services. Policy

There’s been curiosity around berberine supplements, leading some to even name it “nature’s Ozempic.”

But when it comes to berberine for weight loss, are the results impressive enough that you should try it?

Functional medicine specialist Layth Tumah, MD, explains what the research shows around berberine and weight loss.

Does berberine help with weight loss?

Early research indicates that berberine may help reduce body fat.

In one small clinical trial that looked at treating nonalcoholic fatty liver disease, participants who took berberine every day for three months experienced significant weight loss.

Berberine differs from herbal weight loss products, which often lack substantial data. Its effect on weight loss stems from its impact on insulin and glucose. When most people think of insulin, they think of blood sugar management. But insulin also regulates fat and protein metabolism.

“If you have insulin resistance, the cells are inefficient in removing sugar from the blood despite normal or high levels of insulin,” explains Dr. Tumah. “Chronic exposure to high insulin levels — which is an anabolic hormone — can affect weight and metabolic syndrome.”

But before you start a berberine supplement, Dr. Tumah cautions that more studies on how berberine affects weight loss are needed.

How it may work

When you take berberine as a pill or powder, it enters your bloodstream and travels to your cells, binding to different molecules. But instead of producing a single change, berberine interacts with multiple targets, impacting more than one disease at a time.

“Berberine works at a cellular level and changes how cells work by turning signals off and on,” Dr. Tumah further explains. “Its basic interactions involve so many different processes in the body.”

When it comes to weight loss, berberine may improve how cells respond to insulin (insulin sensitivity), promoting better movement of glucose into cells (glucose uptake). It may also impact how glucose gets used. By avoiding long-term elevated insulin, its anabolic effect can be regulated and minimize fat accumulation in the body.

Berberine also activates an enzyme called AMP-activated protein kinase (AMPK). AMPK exists in every cell. Its primary job is to regulate metabolism, helping manage how your body breaks down and uses energy. But AMPK can also influence body fat composition, and it plays a critical role in regulating your appetite.

How to take berberine for weight loss

Berberine supplements come in pills, powder, gummies and drops. If you’re interested in taking berberine supplements for weight loss, you should speak with a physician and use a brand that’s been verified by third-party sources as high in quality.

And remember that supplements like berberine aren’t regulated by the U.S. Food and Drug Administration (FDA). And berberine can interact with certain medications, so it’s important to speak to your healthcare provider before starting berberine.

How much should you take?

Dr. Tumah recommends that you start slowly and at a low dosage. Once you know how you react to berberine, the goal is to take 500 milligrams up to three times a day.

What’s the best time to take berberine for weight loss? Berberine supplements aren’t meant to be taken with food, so opt to take your three doses before or in between meals.

How effective is berberine?

There’s some preliminary information out there, but it should be taken with a grain of salt, states Dr. Tumah.

A 2022 review of 18 studies that examined the effect of berberine on body weight and 23 that examined its effect on body mass index (BMI) found significant decreases in both weight and BMI in people who took berberine,” he shares.

More recently, an umbrella review of 11 meta-analyses revealed that berberine significantly affects factors like blood glucose levels, insulin resistance and body composition as compared to controls.

“However, more research is needed to fully understand how berberine may impact weight,” Dr. Tumah reiterates.

Risks of taking berberine for weight loss

The most common side effects of berberine include:

Some people may not experience any side effects. But for those who do, consider reducing your dose, which will help ease and reduce any side effects.

If you’re pregnant or breastfeeding, you shouldn’t take berberine. Berberine isn’t recommended for children or babies either.

Bottom line?

It’s important to note that berberine, as with any supplement, shouldn’t replace any medical treatment. Dr. Tumah emphasizes that it’s vital to talk with a healthcare provider before starting berberine or any other supplement.

“Obesity, and weight management, is a complex condition, and it’s often due to many factors. If you take a berberine supplement as your only way of addressing weight loss, it’s not going to be as efficient or enough to achieve your goals,” he stresses. “It should be combined with lifestyle modifications such as following a well-balanced diet, regular exercise and/or medication, if needed.”


Source link

Go to Top