About Editorial team of BIPNs

Main team of content of bipns.com. Any type of content should be approved by us.
11 06, 2025

GBP/USD Price Analysis: Soft Jobs Stoke BoE Rate Cut Odds

By |2025-06-11T13:19:02+03:00June 11, 2025|Forex News, News|0 Comments

  • The GBP/USD price analysis suggests increasing expectations for Bank of England rate cuts.
  • The UK labor market was weaker in the three months to April.
  • Market participants are awaiting the US consumer inflation report.

The GBP/USD price analysis suggests increasing expectations for Bank of England rate cuts this year after downbeat UK employment data. Meanwhile, market participants remain cautious ahead of crucial US inflation figures. 

Are you interested to learn more about crypto signals? Check our detailed guide-

Data on Tuesday revealed that the UK labor market was weaker in the three months to April. The unemployment rate reached an almost four-year high, rising from 4.5% to 4.6%. At the same time, wage growth slowed sharply from 5.5% to 5.2%. 

The downbeat figures increased BoE rate cut expectations and weighed on the pound. Before the report, traders were 39-bps of rate cuts this year. This figure increased to 48-bps after the data. 

Meanwhile, market participants are awaiting the US consumer inflation report, scheduled for release on Wednesday. According to estimates, inflation increased by 0.2% in May. Meanwhile, the annual figure increased by 2.5%, above the previous reading of 2.3%. 

A hotter-than-expected reading would confirm the Fed’s fears that Trump’s tariffs have increased price pressure. Moreover, it would lower Fed rate cut expectations, boosting the dollar. On the other hand, if inflation is softer, it will weigh on the dollar by increasing bets for a Fed rate cut.

GBP/USD key events today

  • US core CPI m/m
  • US CPI m/m
  • US CPI y/y

GBP/USD technical price analysis: Bears find their feet below the 30-SMA
GBP/USD Price Analysis: Soft Jobs Stoke BoE Rate Cut Odds
GBP/USD 4-hour chart

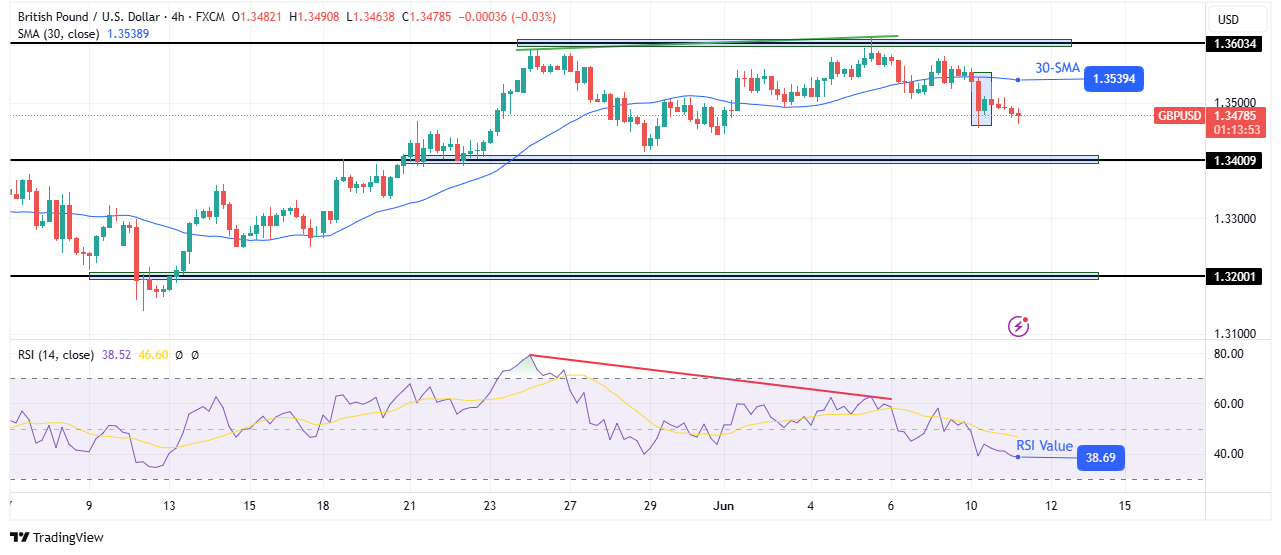
On the technical side, the pound is finding its feet below the 30-SMA after a recent shift in sentiment. Meanwhile, the RSI trades nearer the oversold region, indicating solid bearish momentum. However, after a strong break below the SMA, momentum has eased, and price action shows hesitation to continue lower. The price is now making small-bodied candles. 

Are you interested to learn more about forex robots? Check our detailed guide-

Nevertheless, the bearish bias has strengthened, and the path is clear for GBP/USD to reach the 1.3400 support level. A break below this level will strengthen the bearish bias and allow the price to target the 1.3200 support. 

However, if the level holds firm, bulls might return for a pullback. However, the bearish bias will remain strong as long as the price stays below the 30-SMA.

Looking to trade forex now? Invest at eToro!

67% of retail investor accounts lose money when trading CFDs with this provider. You should consider whether you can afford to take the high risk of losing your money.

Source link

11 06, 2025

Berberine for Weight Loss: Does It Work?

By |2025-06-11T13:14:11+03:00June 11, 2025|Dietary Supplements News, News|0 Comments


If you’re looking for a way to lose weight, you may have heard of berberine, a traditional Chinese medicine (TCM) that’s been used for more than 400 years, mainly to treat diarrhea and other gastrointestinal infections.

Advertisement

Cleveland Clinic is a non-profit academic medical center. Advertising on our site helps support our mission. We do not endorse non-Cleveland Clinic products or services. Policy

There’s been curiosity around berberine supplements, leading some to even name it “nature’s Ozempic.”

But when it comes to berberine for weight loss, are the results impressive enough that you should try it?

Functional medicine specialist Layth Tumah, MD, explains what the research shows around berberine and weight loss.

Does berberine help with weight loss?

Early research indicates that berberine may help reduce body fat.

In one small clinical trial that looked at treating nonalcoholic fatty liver disease, participants who took berberine every day for three months experienced significant weight loss.

Berberine differs from herbal weight loss products, which often lack substantial data. Its effect on weight loss stems from its impact on insulin and glucose. When most people think of insulin, they think of blood sugar management. But insulin also regulates fat and protein metabolism.

“If you have insulin resistance, the cells are inefficient in removing sugar from the blood despite normal or high levels of insulin,” explains Dr. Tumah. “Chronic exposure to high insulin levels — which is an anabolic hormone — can affect weight and metabolic syndrome.”

But before you start a berberine supplement, Dr. Tumah cautions that more studies on how berberine affects weight loss are needed.

How it may work

When you take berberine as a pill or powder, it enters your bloodstream and travels to your cells, binding to different molecules. But instead of producing a single change, berberine interacts with multiple targets, impacting more than one disease at a time.

“Berberine works at a cellular level and changes how cells work by turning signals off and on,” Dr. Tumah further explains. “Its basic interactions involve so many different processes in the body.”

When it comes to weight loss, berberine may improve how cells respond to insulin (insulin sensitivity), promoting better movement of glucose into cells (glucose uptake). It may also impact how glucose gets used. By avoiding long-term elevated insulin, its anabolic effect can be regulated and minimize fat accumulation in the body.

Berberine also activates an enzyme called AMP-activated protein kinase (AMPK). AMPK exists in every cell. Its primary job is to regulate metabolism, helping manage how your body breaks down and uses energy. But AMPK can also influence body fat composition, and it plays a critical role in regulating your appetite.

How to take berberine for weight loss

Berberine supplements come in pills, powder, gummies and drops. If you’re interested in taking berberine supplements for weight loss, you should speak with a physician and use a brand that’s been verified by third-party sources as high in quality.

And remember that supplements like berberine aren’t regulated by the U.S. Food and Drug Administration (FDA). And berberine can interact with certain medications, so it’s important to speak to your healthcare provider before starting berberine.

How much should you take?

Dr. Tumah recommends that you start slowly and at a low dosage. Once you know how you react to berberine, the goal is to take 500 milligrams up to three times a day.

What’s the best time to take berberine for weight loss? Berberine supplements aren’t meant to be taken with food, so opt to take your three doses before or in between meals.

How effective is berberine?

There’s some preliminary information out there, but it should be taken with a grain of salt, states Dr. Tumah.

A 2022 review of 18 studies that examined the effect of berberine on body weight and 23 that examined its effect on body mass index (BMI) found significant decreases in both weight and BMI in people who took berberine,” he shares.

More recently, an umbrella review of 11 meta-analyses revealed that berberine significantly affects factors like blood glucose levels, insulin resistance and body composition as compared to controls.

“However, more research is needed to fully understand how berberine may impact weight,” Dr. Tumah reiterates.

Risks of taking berberine for weight loss

The most common side effects of berberine include:

Some people may not experience any side effects. But for those who do, consider reducing your dose, which will help ease and reduce any side effects.

If you’re pregnant or breastfeeding, you shouldn’t take berberine. Berberine isn’t recommended for children or babies either.

Bottom line?

It’s important to note that berberine, as with any supplement, shouldn’t replace any medical treatment. Dr. Tumah emphasizes that it’s vital to talk with a healthcare provider before starting berberine or any other supplement.

“Obesity, and weight management, is a complex condition, and it’s often due to many factors. If you take a berberine supplement as your only way of addressing weight loss, it’s not going to be as efficient or enough to achieve your goals,” he stresses. “It should be combined with lifestyle modifications such as following a well-balanced diet, regular exercise and/or medication, if needed.”


Source link

11 06, 2025

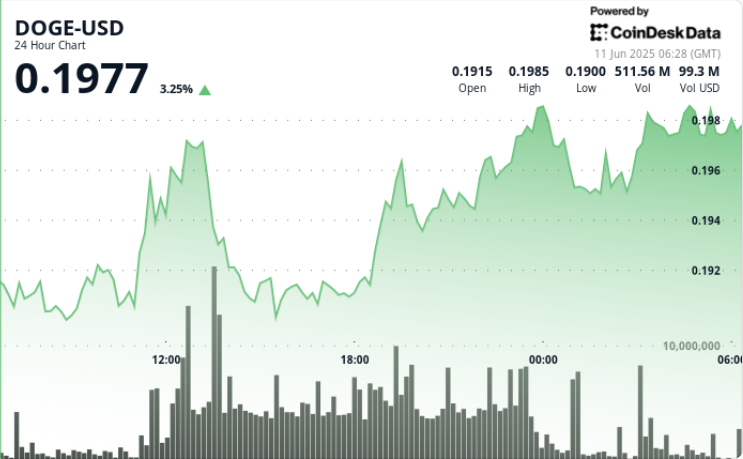
Dogecoin Surges 5% Amid V-Shaped Recovery and Institutional Interest

By |2025-06-11T13:09:20+03:00June 11, 2025|Crypto News, News|0 Comments

Shaurya is the Co-Leader of the CoinDesk tokens and data team in Asia with a focus on crypto derivatives, DeFi, market microstructure, and protocol analysis.

Shaurya holds over $1,000 in BTC, ETH, SOL, AVAX, SUSHI, CRV, NEAR, YFI, YFII, SHIB, DOGE, USDT, USDC, BNB, MANA, MLN, LINK, XMR, ALGO, VET, CAKE, AAVE, COMP, ROOK, TRX, SNX, RUNE, FTM, ZIL, KSM, ENJ, CKB, JOE, GHST, PERP, BTRFLY, OHM, BANANA, ROME, BURGER, SPIRIT, and ORCA.

He provides over $1,000 to liquidity pools on Compound, Curve, SushiSwap, PancakeSwap, BurgerSwap, Orca, AnySwap, SpiritSwap, Rook Protocol, Yearn Finance, Synthetix, Harvest, Redacted Cartel, OlympusDAO, Rome, Trader Joe, and SUN.


Source link

11 06, 2025

Natural gas price settles below the moving average55– Forecast today – 11-6-2025

By |2025-06-11T11:20:14+03:00June 11, 2025|Forex News, News|0 Comments


The GBPJPY pair kept its stability within the bullish channel’s levels, taking advantage of forming extra support at 194.50 level, to notice forming some bullish waves and its stability near 195.50, to confirm the continuation of the previously suggested bullish scenario.


The price needs a new positive momentum that allows it to settle above the obstacle at 195.65 level, to begin forming strong bullish waves, targeting 196.30 level reaching 61.8%Fibonacci correction level at 197.35, forming the next main target for the bullish track.


The expected trading range for today is between 194.80 and 196.30


Trend forecast: Bullish


Source link

11 06, 2025

The GBPJPY fluctuates within the bullish track– Forecast today – 11-6-2025

By |2025-06-11T11:18:07+03:00June 11, 2025|Forex News, News|0 Comments

Copper price remains stable until this moment below $4.8900 level, which decelerates the chances for renewing the bullish attempts, to keep preferring the sideways bias domination in the near trading, and there is a possibility to form some correctional waves that target $4.7500 reaching $4.6600 level.


While the price success to breach the mentioned barrier and hold above it will reinforce the chances for renewing the bullish attempts, to expect reaching $5.0300 followed by the next barrier at $5.1000.


The expected trading range for today is between $4.7500 and $4.8900


Trend forecast: Fluctuated within the bullish track


Source link

11 06, 2025

Here’s XRP Price Implication if W Formation Pushes XRP Market Cap to $1.5T

By |2025-06-11T11:08:38+03:00June 11, 2025|Crypto News, News|0 Comments

Market technician EGRAG Crypto has identified a W pattern formation on the monthly XRP market cap chart, suggesting an imminent run beyond $1 trillion.

EGRAG disclosed this in a recent commentary, where he focused primarily on the XRP market cap chart. His analysis comes as XRP price continues to linger around the $2 mark, leaving its market largely between $120 billion and $145 billion since last month.

XRP Market Cap Forms W Pattern

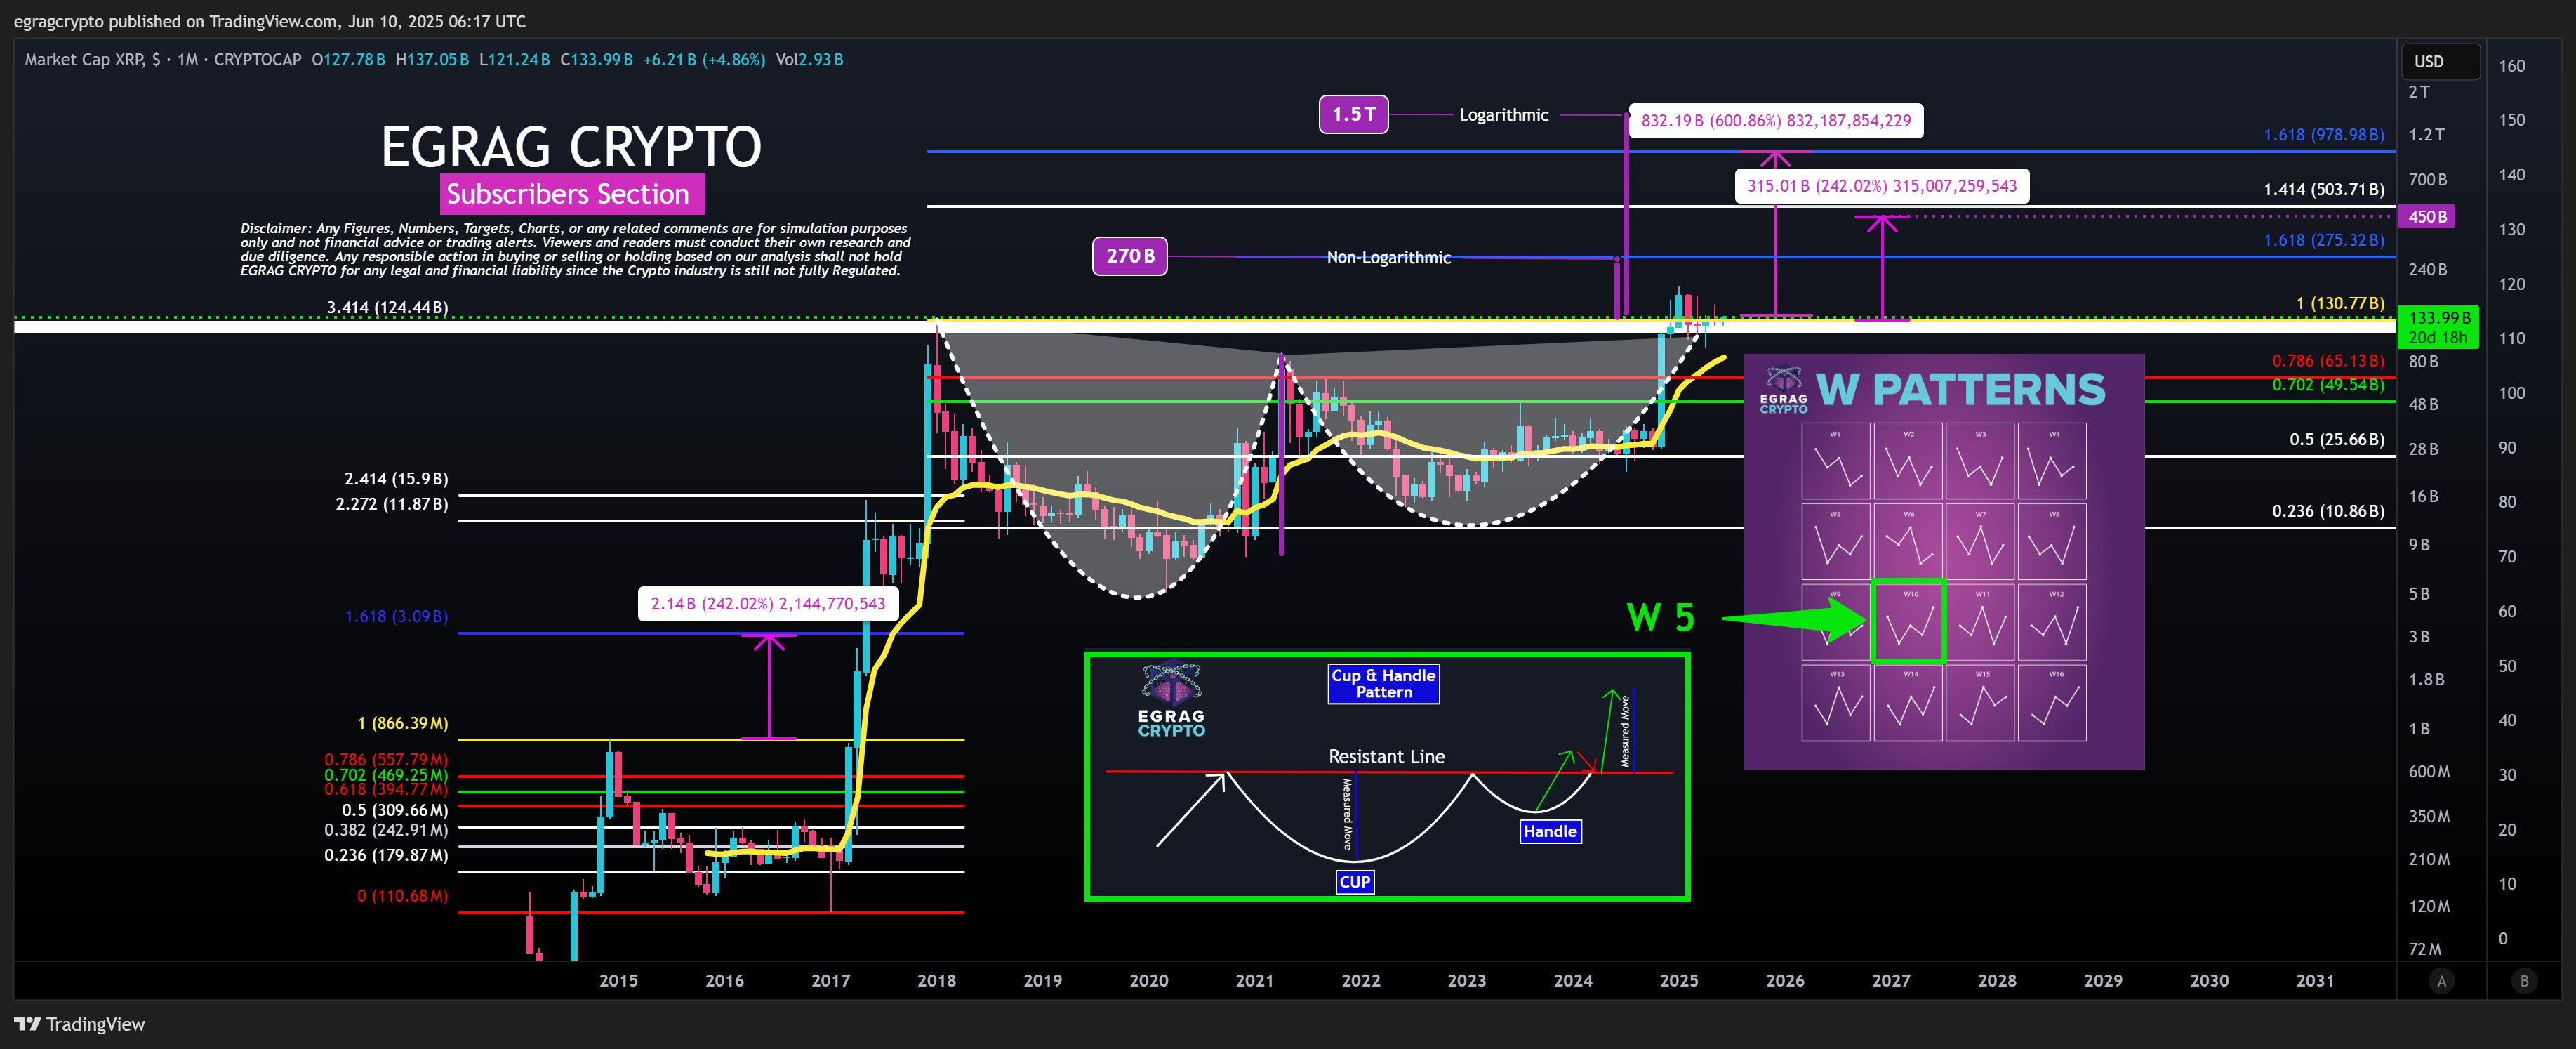
According to EGRAG, the market cap, a direct product of XRP price action, is now in a bullish position. His monthly chart confirmed that the XRP market cap has now formed a W pattern, which also resembles a classic cup and handle structure. This indicates that a breakout to the upside is imminent.

For context, the formation of the pattern began as far back as 2018. Notably, XRP market cap dropped from a peak of $128.5 billion in January 2018 to hit a low of $5 billion in March 2020 before recovering to another high of $89 billion by April 2021. This formed the first part of the W pattern.

Interestingly, after the $89 billion top in April 2021, the XRP market cap collapsed again to another low of $13.88 billion by June 2022 following the Terra collapse that year. Now, the market cap recently rebounded to claim a new all-time high of $195 billion in January 2025. This second wave of movements completed the W formation.

XRP Market Cap W Formation EGRAG Crypto
XRP Market Cap W Formation | EGRAG Crypto

Now, after breaking above the trendline of the W structure, the XRP market cap is retesting this breakout amid the ongoing price consolidation. As earlier mentioned, the market cap has fluctuated between $120 billion and $145 billion in recent times, awaiting a push to greater heights.

W Formation Could Push XRP Market Cap to $270B and $1.5T

Despite this consolidation, EGRAG confirmed that the XRP market cap has held above the previous all-time high of $130 billion from December 2024, which represents Fib. 1. He explained that this position above Fib. 1 indicates that XRP still shows signs of bullish accumulation.

He then presented several upside targets leveraging multiple approaches. Specifically, the first approach considers a measured move from the W formation. In this approach, the non-logarithmic move translates to a target of $270 billion, aligning with Fib. 1.618. This marks a new ATH, corresponding to an XRP price of $4.5.

Meanwhile, still within the first approach, the logarithmic move translates to a market cap target of $1.5 trillion, representing the largest upside target. With XRP’s current circulating supply, the $1.5 trillion market cap would lead to a price of $25. Notably, XRP would need to rise 991% from the current price of $2.29 to reach $25.

Additional Upside Targets 

However, the second approach considers XRP’s historical patterns from 2017. EGRAG confirmed that in 2017, XRP had to rally 242% from Fib. 1 to reach Fib. 1.618. Currently, XRP is already above Fib. 1, as it eyes the 1.618 extension. If it rallies another 242% to reach Fib. 1.618, this would push its market cap to $450 billion, leading to a price of $7.6.

For the third approach, he suggested that Fib. 1.618, the upside target, could translate to a market cap of $978 billion when considering the 2018 peak and the 2020 low. If this target materializes, it will push the XRP price to $17, considering the circulating supply.

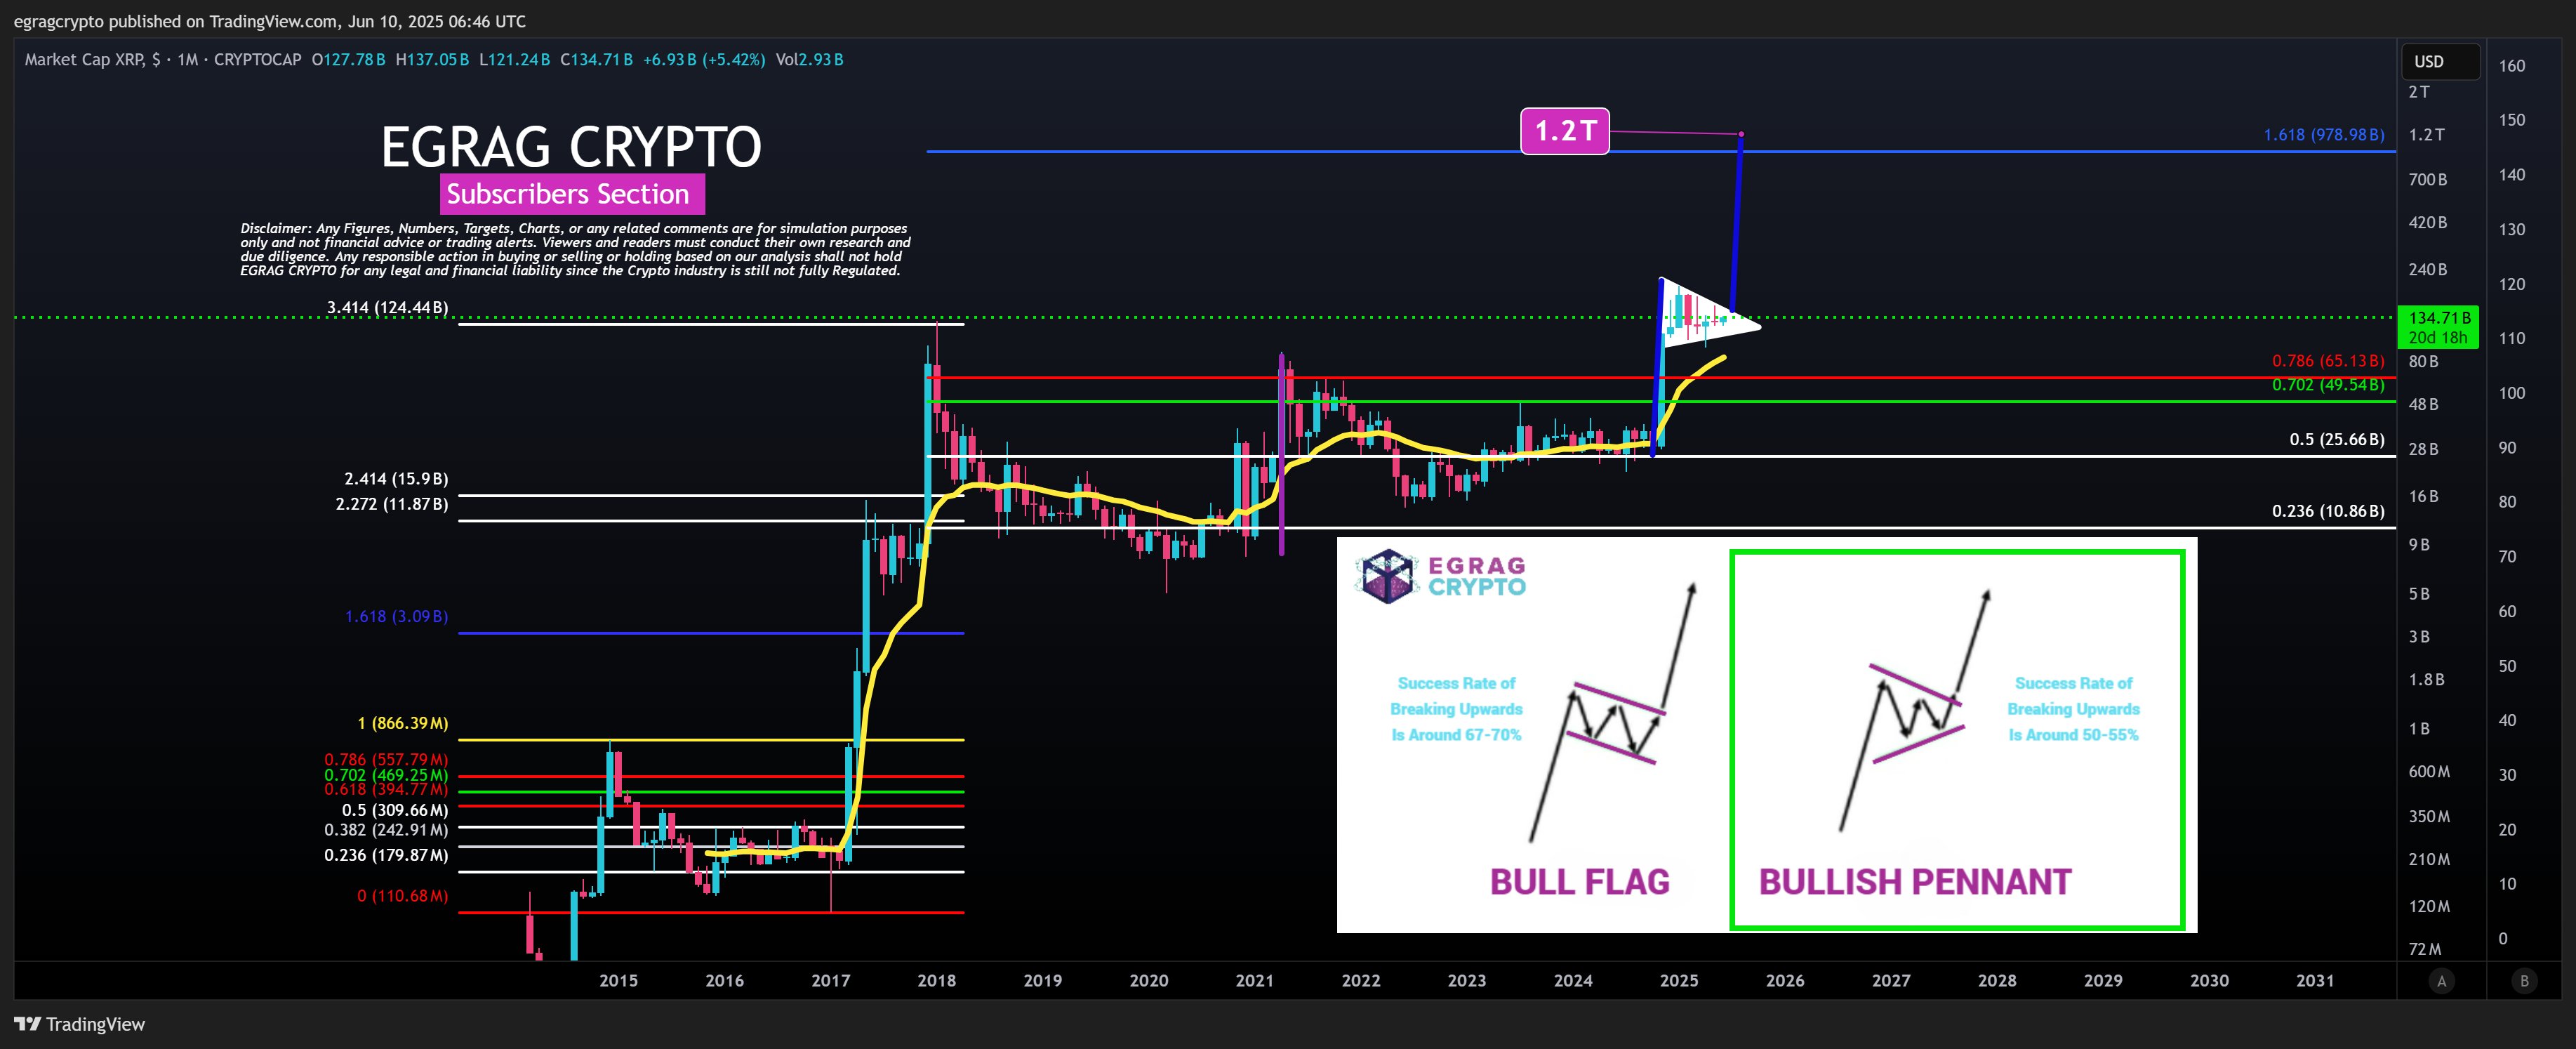
Lastly, EGRAG leveraged a bullish pennant from the XRP/USD and XRP/BTC pairs to present the fourth approach. This pennant aligns with the XRP market cap, with an upside target of $1.2 trillion. Interestingly, this $1.2 trillion translates to an XRP price of $20.

XRP Bullish Pennant Target EGRAG CryptoXRP Bullish Pennant Target EGRAG Crypto
XRP Bullish Pennant Target | EGRAG Crypto

DisClamier: This content is informational and should not be considered financial advice. The views expressed in this article may include the author’s personal opinions and do not reflect The Crypto Basic opinion. Readers are encouraged to do thorough research before making any investment decisions. The Crypto Basic is not responsible for any financial losses.

Source link

11 06, 2025

XAU/USD regains traction ahead of critical US CPI inflation data

By |2025-06-11T09:18:59+03:00June 11, 2025|Forex News, News|0 Comments


  • Gold price remains supported above $3,300 ahead of the US CPI inflation test.
  • The US Dollar cheers a positive outcome of the US-China London trade talks.
  • The daily technical setup leans in favor of Gold buyers in the near term.

Gold price is gathering strength in Wednesday’s Asian trading, having defended the critical support near $3,300 so far this week. However, the further upside hinges on the US Consumer Price Index (CPI) data due later in the day.

Gold price eyes US inflation data amid US-China trade optimism

Following the second day of US-China trade talks in London on Tuesday, Bloomberg reported that both sides agreed on a framework for a trade deal that could potentially help resolve a trade war between the world’s two largest economies.

The US-China optimism helped the US Dollar (USD) recover some ground across its major currency rivals. However, the recovery lacks conviction amid the US Appeals court ruling that allows US President Donald Trump’s reciprocal tariffs to stay in place.

This uncertainty over Trump’s trade policies fails to lift risk sentiment, allowing the traditional safe-haven Gold price to gather upside traction.

Traders also remain wary ahead of the all-important US CPI data, which could alter markets’ expectations of a September Federal Reserve (Fed) interest rate cut.

Markets are currently pricing in about 52% odds of the Fed lowering rates by 25 basis points (bps) in September.

The US monthly CPI is forecast to increase by 0.2% and core inflation is expected to tick up to 0.3% in May. The data will likely show the first signs of Trump’s tariffs feeding through into prices.

Hotter-than-expected US monthly CPI reading could push back against markets’ expectations of a Fed rate cut in September, sending the US Dollar higher at the expense of the non-yielding Gold price

On the other hand, a surprise cooldown in the inflation data could reinforce the buying interest around non-yielding Gold price, as the data would reaffirm expectations of two rate cuts by the Fed this year.

However, the Gold price reaction to the US inflation report could be impacted by the trade headlines. Markets also keep a close eye on the US 10-year Treasury bond auction on Wednesday and Thursday.

Gold price technical analysis: Daily chart

There are no changes to the short-term technical outlook so long as Gold price holds above the critical $3,297 level.  

That level is the confluence of the 21-day Simple Moving Average (SMA) and the 38.2% Fibonacci Retracement (Fibo) level of the April record rally.

Further, the 14-day Relative Strength Index (RSI) has managed to hold its ground above the midline, currently near 54, supporting the bullish potential.

Gold sellers need a daily candlestick closing below the abovementioned strong support at $3,297 to challenge the 50-day SMA cap at $3,262.

The last line of defense for buyers is aligned at $3,232, the 50% Fibo level of the same ascent.

On the flip side, Gold buyers will likely find strong offers at the $3,350 psychological level if the rebound gathers strength.

The next resistance is spotted at the 23.6% Fibo resistance at $3,377, above which the May high of $3,439 could be threatened.

Economic Indicator

Consumer Price Index (MoM)

Inflationary or deflationary tendencies are measured by periodically summing the prices of a basket of representative goods and services and presenting the data as The Consumer Price Index (CPI). CPI data is compiled on a monthly basis and released by the US Department of Labor Statistics. The MoM figure compares the prices of goods in the reference month to the previous month.The CPI is a key indicator to measure inflation and changes in purchasing trends. Generally, a high reading is seen as bullish for the US Dollar (USD), while a low reading is seen as bearish.


Read more.


Source link

11 06, 2025

The EURJPY hits the initial target– Forecast today – 11-6-2025

By |2025-06-11T09:16:58+03:00June 11, 2025|Forex News, News|0 Comments

Copper price remains stable until this moment below $4.8900 level, which decelerates the chances for renewing the bullish attempts, to keep preferring the sideways bias domination in the near trading, and there is a possibility to form some correctional waves that target $4.7500 reaching $4.6600 level.


While the price success to breach the mentioned barrier and hold above it will reinforce the chances for renewing the bullish attempts, to expect reaching $5.0300 followed by the next barrier at $5.1000.


The expected trading range for today is between $4.7500 and $4.8900


Trend forecast: Fluctuated within the bullish track


Source link

11 06, 2025

Bitcoin (BTC) Price Prediction for June 10 — TradingView News

By |2025-06-11T09:07:57+03:00June 11, 2025|Crypto News, News|0 Comments

The majority of the coins keep setting new local peaks, according to CoinStats.CoinStats”>

BTCUSD

The price of Bitcoin BTCUSD has gone up by 0.78% over the last 24 hours.TradingView”>

On the hourly chart, the rate of BTC is near the local support of $108,507.

However, if the daily bar closes far from that mark, there is a possibility of witnessing a test of the $110,000 range by tomorrow.TradingView”>

On the longer time frame, bulls have failed to keep rising after yesterday’s bullish closure. Until the rate is below the $110,461 resistance, traders may witness a correction to the $108,000-$109,000 range.TradingView”>

From the midterm point of view, the price of the main coin is on its way to the all-time high. However, if the weekly bar closes with a long wick, bears may come back to the game, which can lead to a drop to the $107,000 mark.

Bitcoin is trading at $109,150 at press time.

Source link

11 06, 2025

Japanese Yen and Aussie Dollar Forecasts: Eyes on Japan PPI and US CPI Data

By |2025-06-11T07:16:17+03:00June 11, 2025|Forex News, News|0 Comments

  • Bearish USD/JPY Scenario: Renewed trade tensions, higher Japanese producer prices, hawkish BoJ signals, or softer US inflation could push USD/JPY toward 142.5.
  • Bullish USD/JPY Scenario: Easing trade tensions, softer producer prices, dovish BoJ cues, or hotter US inflation may drive the pair above 145 toward 146.285.

See today’s full USD/JPY forecast with chart setups and trade ideas.

AUD/USD in Focus: US-China Trade Headlines to Guide Risk Sentiment

US-China trade talks continued on June 10, spotlighting AUD/USD. Easing US-China trade tensions and progress toward a meaningful agreement could boost Chinese demand and bolster Aussie dollar sentiment. Given that China accounts for one-third of Australian exports and, with a trade-to-GDP rate exceeding 50%, improving trade terms may ease recession fears.

Conversely, failed talks may raise recession risks and prompt a more dovish RBA rate stance. A more dovish RBA rate path could drag AUD/USD lower.

At the most recent RBA press conference, Governor Michele Bullock warned:

“Australia’s economy could easily be compromised if a trade war between the US and China escalates. Depending on where we end up on trade developments, there might be more interest rate adjustments. But for now, rates are in the right place.”

AUD/USD: Key Scenarios to Watch

  • Bearish AUD/USD Scenario: Escalation in the US-China trade war or dovish RBA rhetoric may send AUD/USD below $0.65 toward $0.6450 and the 200-day and 50-day EMAs.
  • Bullish AUD/USD Scenario: A US-China trade deal or hawkish RBA cues could drive the pair above $0.6550 toward $0.66.

Click here for a more comprehensive analysis of AUD/USD trends and trade data insights.

Aussie Dollar Daily Outlook: US CPI in Focus

Later today, the US CPI Report will move AUD/USD through its influence on US-Aussie interest rate differentials.

Higher inflation would likely temper Fed rate cut expectations, widening the interest rate differential in favor of the US dollar. A wider rate differential may pull AUD/USD below $0.65, bringing the 200-day and 50-day EMAs into sight.

Softer inflation, by contrast, may revive Fed rate cut bets, narrowing the rate differential. In this scenario, AUD/USD may move above $0.6550, with the $0.66 level as the next key target.

Source link

Go to Top