About Editorial team of BIPNs

Main team of content of bipns.com. Any type of content should be approved by us.
7 04, 2025

CosMedical Technologies® Launches Brightening Green Tea

By |2025-04-07T16:18:39+02:00April 7, 2025|Dietary Supplements News, News|0 Comments


MIAMI, April 07, 2025 (GLOBE NEWSWIRE) — CosMedical Technologies® proudly introduces its latest innovation in clinical-grade skincare: the Brightening Green Tea Cleanser, a daily exfoliating and hydrating formula expertly crafted to clarify, brighten, and revitalize the skin—without compromise.

Confidently powered by a dynamic blend of 5% Lactic Acid and antioxidant-rich Green Tea Extract, this premium cleanser gently dissolves impurities, stimulates cell turnover, and enhances skin’s radiance while preserving its delicate moisture barrier. With a skin-loving formula that also features Niacinamide and Allantoin, it visibly minimizes pores, balances tone, and delivers deep hydration—making it the go-to solution for dull, uneven, or sensitive skin.

“We created the Brightening Green Tea Cleanser with a clear mission: to elevate the everyday routine with professional-grade results,” said Gina Ciraldo Stabile, CEO of CosMedical Technologies. “Our customers don’t settle—they want skincare that delivers visible transformation without sacrificing comfort. This cleanser does exactly that. It’s bold, multitasking, and effective—just like the people who use it.”

Designed for those who value both performance and simplicity, the cleanser is grounded in clinical insight and real consumer preferences. A recent survey of over 200 women revealed that hydration, exfoliation, and brightening top their skincare priorities—with 75% seeking a gentle daily cleanser that does it all. This formula delivers.

At the heart of its performance is CosMedical’s superior Green Tea Extract, which boasts 600% more biologically active polyphenols than standard brewed tea, delivering unmatched antioxidant protection to reduce inflammation and support luminous, resilient skin.

“As a dermatologist, I’ve seen firsthand how the right ingredients, in the right combination, can transform skin health,” said Dr. Loretta Ciraldo, M.D., F.A.A.D. and founder of CosMedical Technologies. “This cleanser is proof of that. It brings together lactic acid, green tea, niacinamide, and allantoin in a beautifully balanced formula—hydrating, calming, and brightening all at once.”

With a bold commitment to innovation and results, CosMedical Technologies continues to lead the charge in private-label medical skincare. The Brightening Green Tea Cleanser is now available to providers looking to offer their patients a premium, science-backed solution for everyday skin brilliance.

For more information about CosMedical Technologies and its range of innovative skincare products, please call 800-275-3627 or write to info@cosmedicaltechnologies.com  

About CosMedical Technologies Founded in 1993 by board-certified dermatologist Dr. Loretta Ciraldo, M.D., F.A.A.D., CosMedical Technologies is a trailblazer in clinical-grade, private label skincare. Trusted by physicians and medical spas worldwide, the company offers a results-driven portfolio of dermatologist-developed formulas designed to elevate patient care and help providers build their own exclusive skincare brand. With a commitment to innovation, performance, and partnership, CosMedical Technologies empowers professionals to stand out in a competitive market—delivering premium skincare solutions like the Brightening Green Tea Cleanser that enhance credibility and inspire client loyalty. For more information, visit www.cosmedicaltechnologies.com.

Contact: Bianca Ruiz | CosMedical Technologies®
800-275-3627 | bianca@cosmedicaltechnologies.com

A photo accompanying this announcement is available at https://www.globenewswire.com/NewsRoom/AttachmentNg/8c3e39c1-d148-48ef-80f4-cc2fa52167f9


Source link

7 04, 2025

Binance Coin (BNB) Price Prediction for March 31

By |2025-04-07T16:14:34+02:00April 7, 2025|Crypto News, News|0 Comments

U.Today – The majority of the coins are under sellers’ pressure, however, there are some exceptions to the rule, according to CoinStats.

The rate of (BNB) has dropped by 0.31% over the last 24 hours.

On the hourly chart, the price of BNB is on its way to the local resistance of $606.73. If the daily bar closes around that mark, one can expect a level breakout, followed by a move to the $620 zone.

On the bigger time frame, the rate of BNB is far from key levels. In this case, traders should focus on the vital zone of $600.

If the price fixes above, there is a chance to see an ongoing upward move to the $620-$640 range.

From the midterm point of view, the price of the native exchange coin has made a false breakout of the previous bar’s low. If the weekly candle closes far from it, there is a possibility to witness a bounce back to the middle of the channel.

BNB is trading at $599.92 at press time.

This content was originally published on U.Today


Source link

7 04, 2025

Copper price settles above the main support– Forecast today – 07-04-2025

By |2025-04-07T14:26:03+02:00April 7, 2025|Forex News, News|0 Comments


Copper price began today’s trading with sharp negativity, where it approached from the main bullish channel’s support at 3.9500$, then attempts to recover clearly by bounding towards 4,3800$, getting advantage from stochastic attempt to exit the oversold level as appears in the above image.


 we don’t suggest positive trading unless breaching the barrier at 4,5600$, to expect renewing the negative trading in order to renew the pressure on the main support, where breaking it will confirm its move to the bearish track, 3,8100 forms the initial negative target reaching 3,6600.


The expected trading range for today is between 4,000$ and 4,5200$


Trend forecast: Bearish


Source link

7 04, 2025

GBP/USD Analysis Today 07/04: Uncertainty Grows (Chart)

By |2025-04-07T14:22:10+02:00April 7, 2025|Forex News, News|0 Comments

  • The collapse of global stock markets, led by the US, has weakened the recent strong gains of the British Pound.
  • Obviously, we have often noted that positive investor sentiment and the strength of global stock markets are factors in the upward gains of the GBP/USD pair.
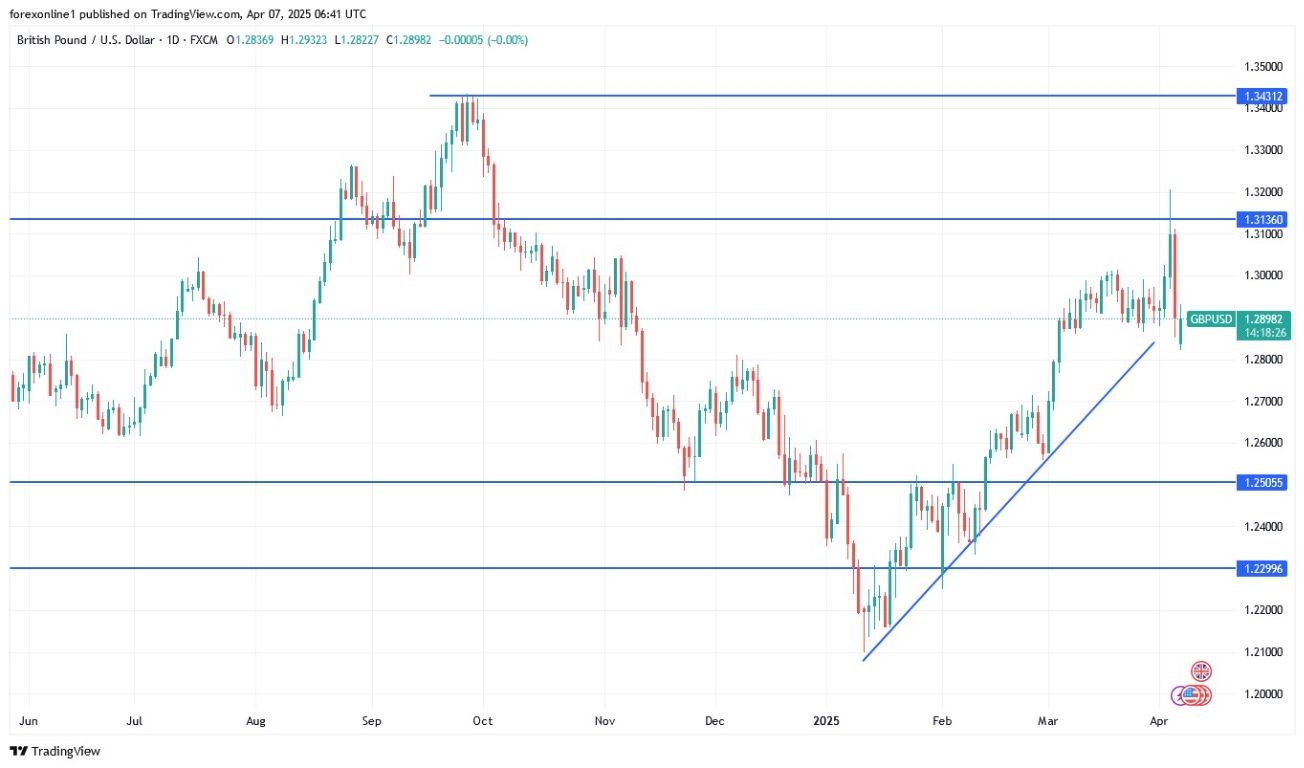
  • During last week’s volatile trading, the GBP/USD pair jumped towards the 1.3207 resistance level, its highest in six months, before quickly plummeting to the 1.2852 support level, its lowest in a month, before closing the week’s trading stable around 1.2898.

Weak Financial Markets Threaten Sterling Gains

According to Forex market trading, market confidence has continued to collapse since the announcement of US tariffs, with growing concerns about the future of the US and global economies. Stock markets also remained under pressure, with the UK’s FTSE 100 index falling by 2.9% to its lowest level in 12 weeks, while US futures fell by 1.7% before the open. Consequently, the decline in stock markets has hurt the British Pound, with the GBP/USD exchange rate falling from its 6-month high of 1.32 yesterday to trade near the psychological support level of 1.2800. The GBP/EUR exchange rate also fell to its lowest level in 10 weeks near 1.1800.

For its part, Bank of America pointed to global risks; US tariff increases exacerbate the risks of a global growth slowdown: Economists indicate that the recently announced US tariff increases could reduce global GDP growth by at least 50 basis points, with a potential impact of 100 to 150 basis points on US GDP growth, 100 basis points on China’s growth, and 40 to 60 basis points on Eurozone GDP growth. They added, “This comes amid a recent slowdown in US growth due to a decline in consumer spending.”

The loss of confidence in the global economy has been evident in energy markets, with benchmark oil prices falling to a three-year low.

The dollar has managed to regain some strength in global markets, but sentiment remains extremely fragile.

In general, the UK is vulnerable to volatility in the global economy and international asset markets, while expectations regarding Bank of England policy have shifted significantly. Financial markets are now pricing in just over an 85% chance of an interest rate cut in May, which is very close to pricing in three more rate cuts over the remainder of 2025.

Trading Tips:

The GBP/USD will not recover without a return to confidence in financial markets and a resurgence of investor risk.

Key Factors Influencing the GBP’s Performance

According to the economic calendar data, February’s GDP data will be the highlight for Britain, revealing the health of the economy before the imposition of tariffs. A slight increase is expected after January’s decline. On another front, Bank of England Deputy Governors Clare Lombardelli and Sarah Breeden are scheduled to deliver speeches on Wednesday, while the central bank will release the minutes of the March Financial Policy Committee meeting.

Also, we saw a further decline in UK bond yields, with the 10-year yield hitting a 16-week low of 4.40%. Likewise, Lower bond yields will have a positive impact on reducing debt interest payments. Therefore, uncertainty about trade policy will inevitably remain high in the short term.

According to reliable trading company platforms, the British Pound ended last week’s trading with a sharp decline against the Euro and the US Dollar after a historic $2 trillion loss in the US stock market. The GBP/EUR pair traded at 1.17647 and the GBP/USD pair at 1.28936, as fear dominated global markets with a strong demand for safe-haven assets. For example, the S&P 500 index recorded a 4.8% decline, its largest drop since 2020, and all global markets experienced widespread losses.

The UK’s FTSE 100 stock index saw further losses of 1.5% on Friday, reaching its lowest level in 11 weeks.

According to Forex market trading, the Yen and the Swiss Franc are traditional defensive currencies and have seen strong demand over the past 24 hours. The US Dollar recorded sharp losses before witnessing a limited rebound on Friday, while the decline in high-risk assets undermined the British Pound.

Technical Analysis for the GBP/USD pair today:

Rapid movements in the GBP/USD pair are fuelling speculation about the future direction of the GBP/USD pair, based on the performance on the daily chart. Technically, a move towards the 1.2800 psychological support level would threaten the recent upward shift. Technically, bulls will have no chance of regaining control of the trend without a resurgence above the 1.3050 resistance level. Furthermore, the pair will not have any chance of rising without a return of market confidence and increased risk-taking by investors.

Ready to trade our daily Forex GBP/USD analysis? We’ve made this UK forex brokers list for you to check out.

Source link

7 04, 2025

Association between vitamin A, E, and folate levels and risk of non-alcoholic fatty liver disease in adults with diabetes mellitus

By |2025-04-07T14:17:48+02:00April 7, 2025|Dietary Supplements News, News|0 Comments


In conclusion, our study demonstrated that serum vitamin E levels were higher in patients with NAFLD than in those without NAFLD among a Korean diabetic population. Furthermore, both elevated serum vitamin A and E levels were positively associated with an increased risk of NAFLD, while serum folate levels showed no significant association with NAFLD. These findings suggest that higher levels of specific micronutrients, particularly vitamins A and E, may play a role in the development or progression of NAFLD in individuals with diabetes. Given the complex metabolic interactions of these vitamins, especially in relation to lipid metabolism and liver function, our results underscore the need for personalized nutritional strategies in managing NAFLD risk among diabetic patients.

Materials and methods

Data information

We conducted a cross-sectional study using data from the Korean National Health and Nutrition Examination Survey (KNHANES) 2016–2018. KNHANES is a nationwide epidemiological study conducted by the Korea Disease Control and Prevention Agency (KDCA) and provides various health-related information, such as laboratory test results and physical examination results29.

The study protocol was approved by the Institutional Review Board of Sookmyung Women’s University (IRB number: SMWU-2107-HR-063), and the requirement for informed consent was waived since the data were anonymized.

Study population

From a total of 24,269 participants in the KNHANES 7th database, we included Korean adults with diabetes mellitus. Participants were defined as having diabetes if they met one of the following criteria: (a) HbA1c ≥ 6.5% (48 mmol/mol) or fasting blood glucose (FBG) ≥ 126 mg/dL, (b) those with a diagnosis of diabetes by a physician, or (c) those who took antidiabetic drugs on the day of examination. Exclusion criteria included pregnant women, those with excessive daily intake of vitamin A or folate (> 3,000 µg of retinol activity equivalents [RAE] or > 1,000 µg of dietary folate equivalents [DFE], respectively), and those with a previous history of hepatitis B or C, liver cirrhosis, or alcohol use disorder. A history of each liver-related underlying disease was defined as a ‘yes’ response on the questionnaire regarding past medical diagnoses, and a history of alcohol use disorder was defined as a ‘yes’ response on the questionnaire asking whether the individual had ever consulted for alcohol-related issues. We also excluded individuals with missing data.

Diagnostic models for NAFLD

NAFLD was assessed based on the following validated prediction models: the hepatic steatosis index (HSI), Framingham steatosis index (FSI), and comprehensive NAFLD score (CNS). These are simple and non-invasive indices used for screening NAFLD. NAFLD was defined based on the following cut-off values for each score: HSI > 36, FSI ≥ 23, or CNS ≥ 40 30,31,32.

Formulae for each diagnostic model are shown below:

  1. 1.

    HSI = 8 × alanine aminotransferase (ALT)/aspartate aminotransferase (AST) ratio + BMI (+ 2 if type 2 diabetes; +2 if female).

  2. 2.

    FSI = ex/ (1 + ex), where x = − 7.981 + 0.011 × age (years) − 0.146 × sex (female = 1, male = 0) + 0.173 × BMI (kg/m2) + 0.0077 × triglycerides (TG) (mg/dL) + 0.593 × hypertension (yes = 1, no = 0) + 0.789 × diabetes (yes = 1, no = 0) + 1.1 × ALT/AST ratio ≥ 1.33 (yes = 1, no = 0).

  3. 3.

    CNS = 1/ (1 + e-x) × 100, where x =.

    • for men, x =  0.016 × age (years) + 0.182 × BMI (kg/m2) + 0.089 × waist circumference (WC) (cm) + 0.391 × alcohol (yes = 1, no = 0) + 0.124 × exercise (yes = 0, no = 1) + 0.018 × FBG (mg/dL) + 0.773 × loge (TG [mg/dL]) − 0.014 × high-density lipoprotein cholesterol (HDL-C) (mg/dL) + 0.145 × uric acid (mg/dL) − 0.674 × loge (AST [IU/L]) + 1.632 × loge (ALT [IU/L]) − 21.695.

    • for women, x = 0.320 × BMI (kg/m2) + 0.044 × WC (cm) + 0.533 × diabetes (yes = 1, no = 0) + 0.016 × FBG (mg/dL) + 0.951 × loge (TG [mg/dL]) − 0.015 × HDL-C (mg/dL) + 0.199 × uric acid (mg/dL) − 0.645 × loge (AST [IU/L]) + 1.302 × loge (ALT [IU/L]) + 0.255× menopause (yes = 1, no = 0) − 19.741.

Measurement of the serum vitamin levels

Serum vitamin A (retinol) and vitamin E (α-tocopherol) levels were measured with Agilent1200 (Agilent Technologies Inc., USA) using high-performance liquid chromatography-flame ionization detector Serum folate levels were measured using ARCHITECT i4000Sr (Abbott Laboratories, USA) with chemiluminescent microparticle immunoassay. The cut-off values to define vitamin deficiency were set as follows: serum vitamin A < 0.2 mg/L, serum vitamin E < 5 mg/L, and serum folate < 4 ng/mL33,34,35.

Definitions of the variables of interest

Obesity was defined using BMI and WC. Those with a BMI ≥ 30 kg/m2 or those with abdominal obesity (WC ≥ 90 cm in males, WC ≥ 85 cm in females) with BMI ≥ 25 kg/m2 were classified into the obese group36.

Definitions of the variables included in the NAFLD prediction were as follows: patients with hypertension were defined as those who met one of the following criteria: (a) systolic blood pressure (SBP) ≥ 140 mmHg or diastolic blood pressure (DBP) ≥ 90 mmHg, (b) history of diagnosis of hypertension by a physician, or (c) patients who took antihypertensive drugs on the day of the examination37. Alcohol consumption status was categorized into three groups: (a) non-drinkers, those who did not consume alcohol for the past year; (b) heavy drinkers, defined as men who drink ≥ 7 standard unit drinks or women who drink ≥ 5 standard unit drinks ≥ 2 times per week; and others were classified as (c) current drinkers. Regular exercise status was determined as yes if the participant met either one of the following: (a) resistance exercise ≥ 1 time weekly, or (b) ≥ 150 min of moderate-intensity physical activities, or ≥ 75 min of high-intensity physical activities or mixed activities (1 min of high-intensity activity is equivalent to 2 min of moderate-intensity activity).

The covariates included in the analysis were as follows: the presence of dyslipidemia was considered in those with a physician’s diagnosis. Smoking status was divided into three groups: (a) non-smokers, those who had never smoked; (b) past smokers, those who had smoked < 100 cigarettes in their lifetime or those who had smoked ≥ 100 cigarettes in the past but not now; and others were classified into (c) current smokers. Dietary data were surveyed using the 24-hour recall method. Vitamin A intake was measured using retinol equivalents (RE): RE (µg) = retinol (µg) + β-carotenes/6 (µg), according to the Dietary Reference Intakes for Koreans criteria38. Supplement use was determined as yes if the participant had taken dietary supplements for more than two weeks over the past year.

Statistical analysis

To evaluate the differences in the baseline characteristics between the NAFLD and non-NAFLD groups, we used independent Student’s t-tests for continuous variables and chi-square tests for categorical variables. Data are presented as mean ± standard error or number (weighted percentage). Comparison of the serum vitamin levels between the NAFLD and non-NAFLD groups was performed using t-tests. In addition, stratified analysis was performed based on two baseline factors, obesity and elderly, to investigate the consistency of the results across the subgroups.

Participants were classified into quartiles of serum vitamin A, E, or folate levels, with Q1 being the lowest and Q4 being the highest quartile of each serum vitamin level (Q1–Q4). Multivariate logistic regression was performed to investigate the association between the risk of NAFLD and serum vitamin levels. The adjusted odds ratios (AORs) of NAFLD and 95% confidence intervals (CIs) were calculated with the lowest quartile set as a reference. The regression model was adjusted for smoking status, HbA1c, total cholesterol, dyslipidemia, total energy intake, and supplement use. The dietary intake of vitamin A or folate was added as a covariate in the analysis of each vitamin.

All the statistical analyses were performed using SPSS ver. 25.0 (IBM Corp., Armonk, NY, USA), and results were considered statistically significant at p < 0.05.


Source link

7 04, 2025

Dogecoin Price Prediction: Which Crypto Will Explode With Life-Changing Returns Like DOGE Did Last Cycle?

By |2025-04-07T14:13:31+02:00April 7, 2025|Crypto News, News|0 Comments

Originally a joke in 2013, Dogecoin became one of crypto’s most incredible success stories. With its impressive 2021 bull run—from $0.004 to an all-time high of $0.75 in just five months—it offers an eye-watering 18,000% return. By 2025, DOGE is priced at $0.33; analysts believe it may rise past $1. Though Dogecoin is still a fan favorite, the primary concern of every investor is which cryptocurrency will explode next, exactly like DOGE did last cycle. All indicators point to Rexas Finance (RXS), a novel real-world asset tokenizing tool currently rising 566% in 2025. Experts estimate it might increase by 18,000% in the following months and reach $36 by the end of 2025.

Why Rexas Finance (RXS) Could Be the Next DOGE

Whereas humor and community buzz drove Dogecoin’s ascent, Rexas Finance is supported by practical value. Rexas Finance is solving a trillion-dollar issue as a platform allowing consumers to tokenize real estate, gold, and acceptable art assets.  Rexas Finance is poised to transform asset ownership and investing by combining blockchain technology and practical value. Priced at $0.20, RXS is in its final presale stage, up 566% from its September 2024 beginning price of $0.030. Sales of over 457 million RXS tokens have thus raised $47.52 million in the impressive presale. Priced at $0.25, investors are flocking in before the official release on June 19, 2025; the final presale stage is 91.52% filled. Presale investors at stage 12 can thus still guarantee RXS before its initial exchange offer (IEO), locking in a guaranteed 25% gain at launch.

The Numbers Speak for Themselves

One of the most popular initiatives in the crypto industry nowadays is Rexas Finance. The RXS presale has been an overwhelming success, with strong investor demand pushing the price higher through each stage. Here’s why Rexas Finance is set for an explosive breakout:

  • Presale Performance: RXS started at $0.030 and has skyrocketed to $0.20, a 566% increase.
  • Final Stage Presale Pricing: Currently priced at $0.20, RXS will launch at $0.25 on June 19, 2025.
  • Market Sentiment: Analysts predict an 18,000% rally for RXS, potentially reaching $36 within the next seven months.
  • Certik Audit: Security is paramount, and Rexas Finance has undergone a successful Certik audit, giving investors confidence in its reliability.
  • Thanks to RXS’s official listing on CoinMarketCap and CoinGecko, investors may quickly follow market statistics and price changes.
  • Community-Driven Growth: Rexas Finance has selected a community-first approach, allowing regular investors to be early adopters, unlike many crypto initiatives depending on venture financing.

The Path to $36: Why RXS Could Outperform DOGE

Although Dogecoin is expected to climb in the next bull run, its upside could be constrained relative to past cycles. The current price of DOGE is $0.33, so a move to $1.40 would result in a 324% increase. Unlike Dogecoin in 2021, Rexas Finance, currently at $0.20, can skyrocket to $36—an 18,000% rise. Rexas Finance provides something fresh for the crypto sector, which is the basis behind this audacious forecast. Though it has long been considered, the tokenization of real-world assets has never been done correctly. Finally making it a reality, Rexas Finance lets regular investors engage in sectors traditionally reserved for big players.

Final Thoughts: The Best Investment Before the Next Crypto Explosion

During the recent bull run, Dogecoin minted millions; while it still has the capacity for expansion, tokens with actual value present the next major prospect. Rexas Finance (RXS) is an initiative essentially altering asset ownership, not just another speculative meme coin. Investors have a last window to buy before RXS launches at $0.25, with a presale price of $0.20. Given its significant presale increase, community-driven strategy, and trillion-dollar market potential, Rexas Finance could be the next cryptocurrency to provide life-changing profits. Rexas Finance (RXS) could rise 18,000% to reach $36 in the next 6 months, offering life-changing returns like DOGE did last cycle.  Investors should act immediately. Will you be part of the following grand success narrative? Get your RXS tokens right now before rates explode!

For more information about Rexas Finance (RXS) visit the links below:

Website: https://rexas.com

Win $1 Million Giveaway: https://bit.ly/Rexas1M

Whitepaper: https://rexas.com/rexas-whitepaper.pdf

Twitter/X: https://x.com/rexasfinance

Telegram: https://t.me/rexasfinance

Disclaimer: This content is provided by a sponsor. FinanceFeeds does not independently verify the legitimacy, credibility, claims, or financial viability of the information or description of services mentioned. As such, we bear no responsibility for any potential risks, inaccuracies, or misleading representations related to the content. This post does not constitute financial advice or a recommendation and should not be treated as such. We strongly advise seeking independent financial guidance from a qualified and regulated professional before engaging in any investment or financial activities. Please review our full disclaimer for more details.

Source link

7 04, 2025

Platinum price attempts to shrink the losses – Forecast today – 07-04-2025

By |2025-04-07T12:24:52+02:00April 7, 2025|Forex News, News|0 Comments


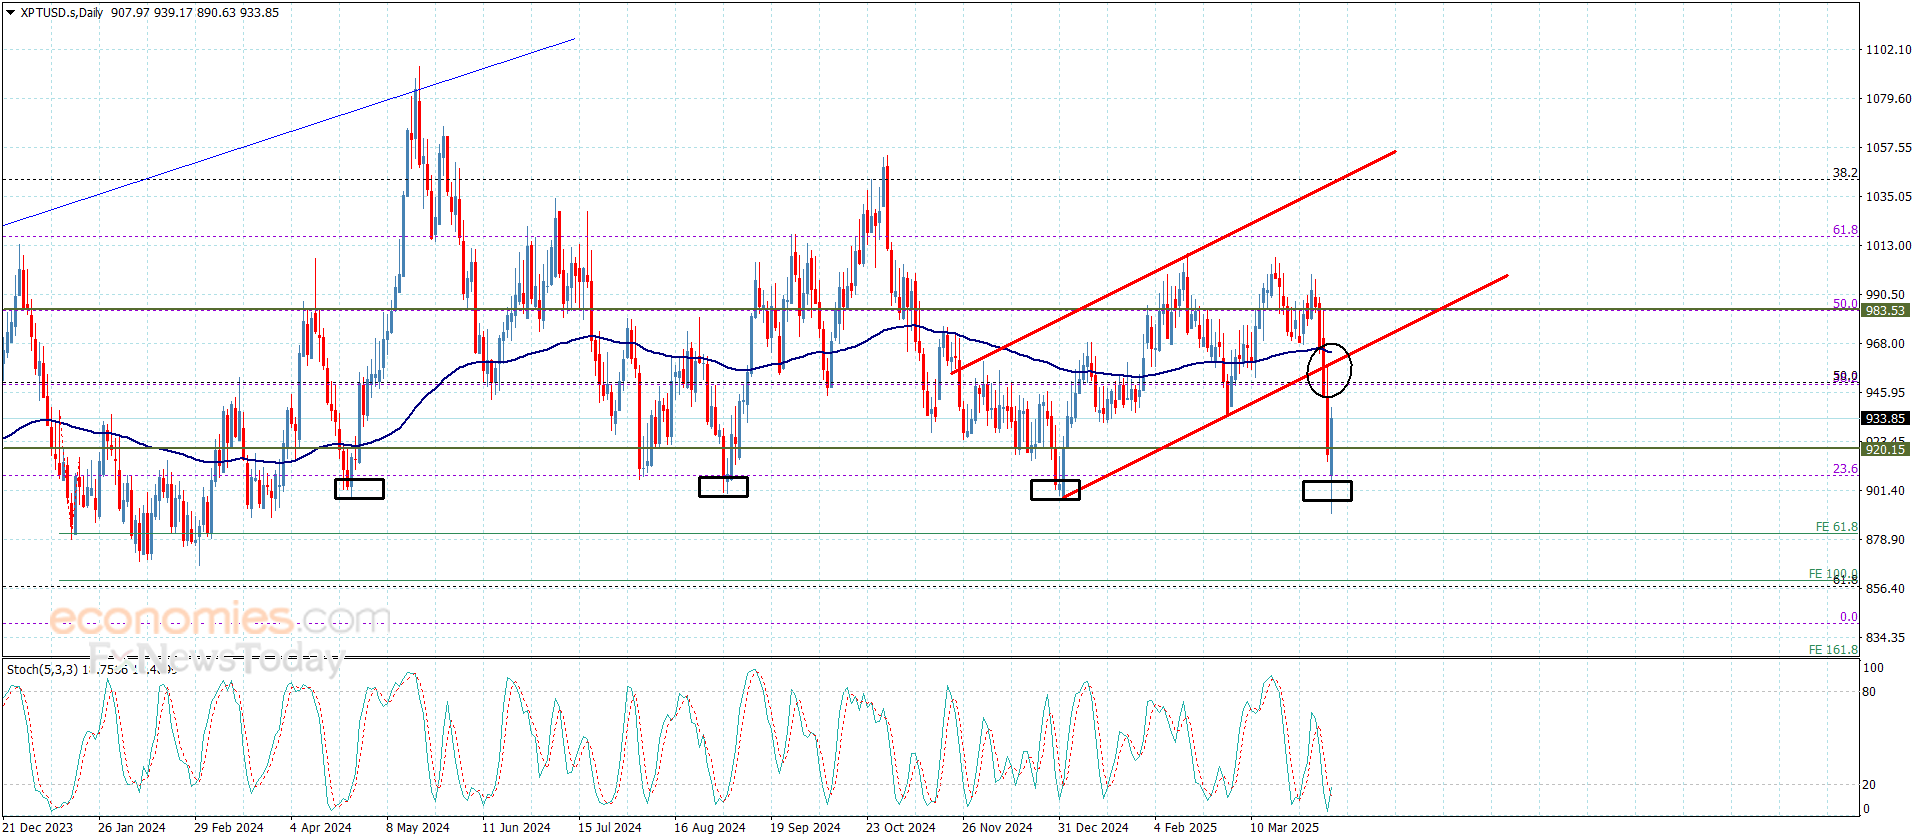
Platinum price continued to form negative trading to reach 890.00$, to begin decreasing the losses by its rebound above the support at 900.00$ level, which represents a historical support as appears in the above image, recovering some of the losses by its stability near 933.00.


Note that the price stability below the broken bullish channel’s support at 958.00$, which forms a main factor to confirm the negative scenario, therefore, we will keep waiting for gathering extra negative momentum, attempting to renew the pressure on the mentioned historical support, while breaking it will extend the losses towards 858.00$ and 880.00$. 


The expected trading range for today is between 880.00$ and 945.00$


Trend forecast: Bearish


Source link

7 04, 2025

USD/JPY Forecast: Yen Soars as Global Risk Appetite Fades

By |2025-04-07T12:21:34+02:00April 7, 2025|Forex News, News|0 Comments

  • The USD/JPY forecast shows solid demand for safe-haven assets like the yen.
  • Trump announced new tariffs affecting almost all its trading partners.
  • Market participants are pricing a higher 55% chance of a Fed rate cut in May.

The USD/JPY forecast shows solid demand for safe-haven assets like the yen amid growing global economic uncertainty. Meanwhile, the dollar slipped as market participants worried about the impact of Trump’s trade policies on the economy. At the same time, the greenback faced pressure from a rise in Fed rate cut expectations. 

–Are you interested to learn more about South African forex brokers? Check our detailed guide-

The yen held steady at the start of the week as safe-haven demand remained high. Traders started flocking to Japan’s currency last week after Trump announced new tariffs affecting almost all its trading partners. As a result, worries about an escalation in trade wars dampened risk appetite. 

At the same time, market participants worried about the impact of these tariffs on the US economy. Most major companies depend on exports and imports. Therefore, an increase in prices will directly impact business. 

Moreover, the labor market might suffer as companies reduce their workers to adjust to the rising costs. Such an outcome would put pressure on the Federal Reserve to lower borrowing costs and spur growth. Currently, market participants are pricing a higher 55% chance of a rate cut in May.

USD/JPY key events today

Market participants do not expect any key economic releases from Japan or the US. Therefore, they will keep digesting recent US trade policy changes.

USD/JPY technical forecast: Bears poised to make new lows below 145.01

USD/JPY 4-hour chart

On the technical side, the USD/JPY price has paused near the 145.01 support level after a steep decline. Still, the bearish bias remains strong since the price sits far below the 30-SMA with the RSI below 50. 

-If you are interested in forex day trading then have a read of our guide to getting started-

Bears took over from bulls when the price paused at its peaks and the RSI made a bearish divergence. As a result, USD/JPY broke below the SMA. After pulling back to retest the SMA line, the price collapsed in a steep downtrend, breaking below the 146.75 support. The decline has paused at the 145.01 level, allowing the price to retest the recently broken 146.75 level. 

Given the solid bearish bias, the price might soon break below 145.01 to make a new low. However, if the support holds firm, it might consolidate before breaking below the support.

Looking to trade forex now? Invest at eToro!

67% of retail investor accounts lose money when trading CFDs with this provider. You should consider whether you can afford to take the high risk of losing your money.

Source link

7 04, 2025

Why the vibrant green tea is so hot right now

By |2025-04-07T12:16:15+02:00April 7, 2025|Dietary Supplements News, News|0 Comments


Tea may be the second-most consumed beverage worldwide, but matcha in particular has been stealing the spotlight lately. Consumption of the Japanese green tea powder is skyrocketing — the matcha market was valued at $3.63 billion in 2024 and is projected to climb to $8.67 billion in 2031 — thanks to health-focused consumers and “green-tea obsessed” influencers drawn to its many potential health benefits, along with an increase in Japanese tourism.

Matcha is traditionally consumed as a beverage, but it’s been steadily finding its way into other products, including ice cream, baked goods and more. Its earthy, umami flavor profile lends itself to a variety of preparations that people just can’t seem to get enough of.

The vibrantly colored green tea powder is growing in popularity, so much so that producers are having difficulty keeping up with demand, leading to a global matcha shortage. Matcha harvesting is time-consuming and labor-intensive (it can take five years for matcha tea shrubs to reach maturity, and the machines that grind the leaves into a fine powder are slow). The highest-quality matcha is harvested just once per year, in the spring, making it impossible for growers to scale up quickly.

The demand for it likely won’t slow down anytime soon. Although some people are drawn to matcha for its distinct flavor, the health benefits are a big appeal. Matcha stands out from other forms of tea thanks to its higher composition of antioxidants and anti-inflammatory compounds. Here’s a look at the potential benefits of matcha:

Heart health

Matcha contains a high concentration of catechins, an antioxidant that helps improve cardiac health. Although the research is mixed, matcha may reduce LDL or “bad” cholesterol and improve HDL or “good” cholesterol.

Blood sugar control

The antioxidants, specifically catechins, found in green tea can help manage blood glucose (aka blood sugar). Matcha consumption may help lower blood glucose levels by reducing carbohydrate digestion and oxidative stress, regulating glucose production and improving insulin sensitivity and the gut microbiome.

Anticancer properties

Studies suggest that matcha may have anticancer properties. “Matcha is full of powerful antioxidants,” registered dietitian Pam Hartnett tells Yahoo Life. “One of the most researched, EGCG, or epigallocatechin gallate, can help lower cancer risk.” Evidence also shows that matcha may reduce tumor mass and decrease the potential of cancer spreading to other areas (metastasizing). However, researchers admit the data is limited, and further studies are needed for a better understanding of these possible health benefits of matcha.

Anti-inflammatory properties

The polyphenols found in matcha have anti-inflammatory properties. “Matcha is rich in antioxidants, which help combat oxidative stress and inflammation,” registered dietitian Morgan Pearson tells Yahoo Life. “As a result, it may protect cells from damage and support the prevention of chronic diseases.”

Brain function

The antioxidant EGCG may also help improve mental clarity and possibly play a role in preventing neurodegenerative diseases like Alzheimer’s thanks to its antioxidant, anti-inflammatory and anti-aging abilities.

Also, the caffeine and L-theanine (an amino acid) found in matcha are known for their positive impact on cognitive function. Registered dietitian Lindsay Fencl tells Yahoo Life that research suggests these ingredients “boost concentration and alertness, providing a smooth, sustained energy lift without the jitters.” (A cup of matcha has about 70 mg of caffeine, compared with a cup of coffee, which contains between 70 and 150 mg of caffeine.)

Easy ways to add matcha to your meals

Want to enjoy some of this potent green tea? Be sure to pick a high-quality matcha from a reputable seller and then start experimenting. Here are some ideas:


Source link

7 04, 2025

Cardano Price Prediction: ADA To Surge Past XRP & SOL, But Is It The Best Crypto To Buy Now?

By |2025-04-07T12:12:40+02:00April 7, 2025|Crypto News, News|0 Comments

Disclaimer: This is a Press Release provided by a third party who is responsible for the content. Please conduct your own research before taking any action based on the content.


The latest Cardano price prediction has taken the crypto world by storm. Everyone thought that the altcoin cycle was over, but Cardano could be on the verge of a breakout and looks ready to run rings around XRP and Solana.

Meanwhile, Rollblock has emerged as a top player in the presale space. Analysts are pointing to Rollblock as the low-cap gem that could blow up to 50x before the end of 2025. Here’s why.

Rollblock (RBLK): The Low Cap Gem Taking Web3 By Storm

Rollblock (RBLK) is racing through its presale and gaining momentum fast, not just for the hype, but because it actually delivers on its promise. This viral Web3 GameFi platform is backed by real numbers, with $11.1 million already raised by early investors and new all-time highs across every key metric in March.

It’s got over 8000 immersive, AI-powered games already live including blackjack, poker, and an addicting real-time sports prediction league that lets users place bids on thousands of fixtures across NBA, soccer, and more.

All of this activity is transparently tracked on the Ethereum chain, which eliminates middlemen and builds trust in a $500 billion industry that is sorely in need of blockchain innovation.

Those credentials, combined with month-on-month growth in signups, deposits, and bets, are why experts are now calling Rollblock a blue chip in the making.


March stats confirm the surge: $1,941,655 in total bets (up 50% from February), deposits up 110%, registrations up 5%, and Gross Gaming Revenue climbing another 50%.

For a closer look at the platform’s massive potential, watch the full review from Professor Crypto here: https://www.youtube.com/watch?v=z1TahMr56Qw

RBLK Tokenomics: Deflation And A Hard Cap That Holds

Rollblock (RBLK) keeps it simple but powerful with a fixed supply of 1 billion tokens that can never be inflated. Every week, 30% of Rollblock’s revenue is used to buy back RBLK from the open market. Of that amount, 60% is burned to reduce the supply, while the remaining 40% funds staking rewards that offer holders up to 30% APY.

This bullish deflationary structure is exactly why long-term investors are calling RBLK the ultimate low-cap play of 2025. Stage 10 tokens are already over 54% sold at $0.063, and prices are expected to rise sharply as major exchange listings go live.

Cardano Price Prediction (ADA): Breakout Looms

Cardano is trading at $0.66 today, up 0.5% in the past 24 hours. The recent uptick has given hope to Cardano holders, and it looks as though the worst of the recent dump could now be over.

As @blockchainballer put it: “Just broke that CHoCH after the BOS looked promising! But we’ve got a big EQH resistance around 0.7000 that’s the rejected price before. I’m watching for a strong close above this level to confirm the move.”

Cardano has been a favorite among long-term holders thanks to its methodical development and loyal army of holders, but its short-term price movement remains tightly boxed in here. Many Cardano holders are keeping the faith, although some are beginning to explore other smaller-cap investments for their more explosive upside.

XRP: Bounce Looks Healthy

XRP is trading at $2.13 today after gaining 3.6% in the last 24 hours. XRP price action has turned many heads this week, with buyers stepping back in and short-term indicators flashing green.

@anastamaverick noted the momentum: “XRP has shaken off the earlier plunge to $1.96 and climbed back above $2.05. The bounce looks healthy on the hourly chart, and momentum indicators are heating up again. The pair is walking a tightrope, but bulls aren’t letting go easily.”


XRP’s recent structure looks encouraging, but many traders remain cautious, as broader crypto market sentiment could still shift quickly. Another dip below $1.95 could be on the cards for XRP if the market falls further in the wake of Trump’s tariff war.

Solana (SOL): Chart Still Bearish As Pressure Builds

Solana is trading at $123 today after losing a woeful 11% in the past seven days. Despite brief attempts at a breakout, Solana continues to face intense sell pressure from whales.

@Crypto_Jobs didn’t sugarcoat it: “Sorry to say, but the chart looks terrible. The current price is trying a breakout attempt of the $130 key monthly support. This could lead to another huge sell pressure.”

Solana’s fundamentals remain solid and many promising developments are on the horizon including the FireDancer upgrade, but technically, the Solana trend is still downward. Solana traders may have to wait a few more weeks for bullish confirmation to see if the worst is over for now.

Rollblock Will Deliver On Its Promise In 2025

Cardano, XRP, and Solana each have strong communities and huge scope for development, but none offer the stunning potential that Rollblock delivers. For investors hunting the next blue chip with 50x potential, Rollblock remains the standout altcoin of the year.

Discover the Exciting Opportunities of the Rollblock (RBLK) Presale Today!

Website: https://presale.rollblock.io/

Socials: https://linktr.ee/rollblockcasino

Source link

Go to Top