About Editorial team of BIPNs

Main team of content of bipns.com. Any type of content should be approved by us.
12 02, 2025

XAU/USD challenges critical support ahead of US CPI inflation test

By |2025-02-12T17:13:01+02:00February 12, 2025|Forex News, News|0 Comments


  • Gold price holds overnight pullback from record highs and stays below $2,900.
  • Trump’s tariffs uncertainty and hawkish Fed Chair Powell’s comments dent Gold price.
  • Gold sellers test the key support on the 4H chart, as US CPI inflation data looms.

Gold price consolidates the previous pullback from record highs of $2,943, struggling below $2,900 early Wednesday. All eyes now remain on the high-impact US Consumer Price Index (CPI) data due later in the day for fresh directional impetus in Gold price.

Will US CPI data accentuate Gold price correction?

Markets are battling uncertainty surrounding US President Donald Trump’s plans for reciprocal tariffs and Federal Reserve (Fed) easing trajectory, leaving Gold price in a limbo, with traders cashing in on their long positions heading into the critical US inflation test.

Traders remain on tenterhooks as they remain expectant of Trump’s reciprocal tariffs coming into effect from Wednesday but it is not yet confirmed whether the tariffs will come through later in the day.

When asked if reciprocal tariffs are still coming on Wednesday at an event to welcome home a hostage released by Russian President Vladimir Putin late Tuesday, President Trump said ‘we’ll see’.

Meanwhile, the Wall Street Journal (WSJ) reported that Trump’s team is working on reciprocal tariffs this week via executive action, bypassing Congress.

The speculations around Trump’s tariffs revive the US Dollar’s (USD) as a safe-haven asset, weighing negatively on Gold price. The bright metal also bears the brunt of the hawkish commetary by Fed Chairman Jerome Powell during his Congressional testimony on Wednesday.

 Powell hinted that the central bank would maintain its current policy stance, saying that “with the economy remaining strong, we do not need to be in a hurry to adjust our policy stance.”

Markets altered their expectations of Fed interest rate cuts this year to only one in July, fuelling a decent recovery in the US Treasury bond yields at the expense of the non-interest-bearing Gold price.

The next directional move in gold price is on the US CPI release and Trump’s implementation of reciprocal tariffs. The US annual CPI inflation is expected to remain at 2.9% in January while the core figure is seen easing slightly to 3.1%. The monthly headline CPI and core numbers will likely arrive at 0.3% in the same period.

An unexpected increase in the headline CPI could double down on the latest hawkish expectations surrounding the Fed’s policy outlook, driving the USD and the US Treasury bond yields northward while exacerbating the pain in Gold price. Conversely, on a downside surprise, Gold could resume its uptrend on renewed bets of two Fed rate cuts.

However, US President Donald Trump’s tariffs announcement could also remain a key market driver in the sessions ahead.

Gold price technical analysis: Four-hour chart

Gold price fell short of the measured target of the Bull Flag on the four-hour chart at $2,962 and pulled back sharply on Tuesday.

Gold sellers remain in control and challenge the critical 21-four hourly Simple Moving Average (SMA) at $2,890.

A four-hourly candlestick closing below that level will provide extra legs to Gold price’s corrective downside, calling for a test of the 50-four hourly SMA at $2,857.

The last line of defense for Gold buyers is the 100-four hourly SMA at $2,808.

The Relative Strength Index (RSI) has turned lower but defends the midline, currently near 52.50, suggesting that the downside could be limited.

Any upswing will need acceptance above the $2,905 static resistance.

If buyers manage to scale the latter decisively, the door will open toward the record high of $2,943.

Gold FAQs

Gold has played a key role in human’s history as it has been widely used as a store of value and medium of exchange. Currently, apart from its shine and usage for jewelry, the precious metal is widely seen as a safe-haven asset, meaning that it is considered a good investment during turbulent times. Gold is also widely seen as a hedge against inflation and against depreciating currencies as it doesn’t rely on any specific issuer or government.

Central banks are the biggest Gold holders. In their aim to support their currencies in turbulent times, central banks tend to diversify their reserves and buy Gold to improve the perceived strength of the economy and the currency. High Gold reserves can be a source of trust for a country’s solvency. Central banks added 1,136 tonnes of Gold worth around $70 billion to their reserves in 2022, according to data from the World Gold Council. This is the highest yearly purchase since records began. Central banks from emerging economies such as China, India and Turkey are quickly increasing their Gold reserves.

Gold has an inverse correlation with the US Dollar and US Treasuries, which are both major reserve and safe-haven assets. When the Dollar depreciates, Gold tends to rise, enabling investors and central banks to diversify their assets in turbulent times. Gold is also inversely correlated with risk assets. A rally in the stock market tends to weaken Gold price, while sell-offs in riskier markets tend to favor the precious metal.

The price can move due to a wide range of factors. Geopolitical instability or fears of a deep recession can quickly make Gold price escalate due to its safe-haven status. As a yield-less asset, Gold tends to rise with lower interest rates, while higher cost of money usually weighs down on the yellow metal. Still, most moves depend on how the US Dollar (USD) behaves as the asset is priced in dollars (XAU/USD). A strong Dollar tends to keep the price of Gold controlled, whereas a weaker Dollar is likely to push Gold prices up.


Source link

12 02, 2025

Pound Sterling bulls retain control after reclaiming technical hurdle

By |2025-02-12T16:55:15+02:00February 12, 2025|Forex News, News|0 Comments

  • GBP/USD holds near 1.2450 after posting strong gains on Tuesday.
  • The technical picture highlights sellers’ hesitancy in the near term.
  • The US economic calendar will feature January inflation data.

Following the bearish action seen at the beginning of the week, GBP/USD reversed its direction on Tuesday and gained more than 0.6%. Ahead of the key January inflation data from the US, the pair holds above key technical area.

British Pound PRICE This week

The table below shows the percentage change of British Pound (GBP) against listed major currencies this week. British Pound was the strongest against the Japanese Yen.

  USD EUR GBP JPY CAD AUD NZD CHF
USD   -0.41% -0.37% 1.46% 0.16% -0.06% 0.37% 0.14%
EUR 0.41%   0.11% 1.99% 0.69% 0.35% 0.87% 0.64%
GBP 0.37% -0.11%   1.72% 0.55% 0.24% 0.76% 0.52%
JPY -1.46% -1.99% -1.72%   -1.32% -1.43% -1.07% -1.28%
CAD -0.16% -0.69% -0.55% 1.32%   -0.19% 0.18% -0.04%
AUD 0.06% -0.35% -0.24% 1.43% 0.19%   0.52% 0.28%
NZD -0.37% -0.87% -0.76% 1.07% -0.18% -0.52%   -0.24%
CHF -0.14% -0.64% -0.52% 1.28% 0.04% -0.28% 0.24%  

The heat map shows percentage changes of major currencies against each other. The base currency is picked from the left column, while the quote currency is picked from the top row. For example, if you pick the British Pound from the left column and move along the horizontal line to the US Dollar, the percentage change displayed in the box will represent GBP (base)/USD (quote).

The US Dollar (USD) came under selling pressure on Tuesday, allowing GBP/USD gain traction. The lack of fresh headlines surrounding US President Donald Trump’s trade policy and Federal Reserve (Fed) Chairman Jerome Powell’s hesitancy to offer fresh insight into the policy outlook helped market mood improve in the American session.

On the first day of his congressional testimony on the semi-annual Monetary Policy Report, Powell repeated that they do not need to be in a hurry to adjust the monetary policy. He added that it’s not for the Fed to comment on tariffs and explained that they will follow incoming data to assess the effects of the trade policy.

In the second half of the day, January Consumer Price Index (CPI) data from the US will be watched closely by market participants. On a monthly basis, the core CPI, which excludes volatile food and energy prices, is forecast to rise 0.3%. A stronger increase than expected could support the USD with the initial reaction and cause GBP/USD to turn south. Conversely, a soft monthly core inflation reading of 0.2% or lower could have the opposite impact on the pair’s action.

Early Thursday, the UK’s Office for National Statistics (ONS) will publish the Gross Domestic Product (GDP) data for the fourth quarter.

GBP/USD Technical Analysis

GBP/USD holds comfortably above the ascending trend line and the 200-period and the 100-period Simple Moving Averages (SMA), reflecting the bullish bias. Additionally, the Relative Strength Index (RSI) indicator on the 4-hour chart stays above 50.

In case GBP/USD confirms 1.2450 (Fibonacci 50% retracement of the latest downtrend) as support, it could target 1.2500 (round level, static level) and 1.2530 (Fibonacci 61.8% retracement) next. On the downside, supports could be seen at 1.2415 (100-period SMA) and 1.2380-1.2370 (200-period SMA, Fibonacci 38.2% retracement, ascending trend line).

Pound Sterling FAQs

The Pound Sterling (GBP) is the oldest currency in the world (886 AD) and the official currency of the United Kingdom. It is the fourth most traded unit for foreign exchange (FX) in the world, accounting for 12% of all transactions, averaging $630 billion a day, according to 2022 data. Its key trading pairs are GBP/USD, also known as ‘Cable’, which accounts for 11% of FX, GBP/JPY, or the ‘Dragon’ as it is known by traders (3%), and EUR/GBP (2%). The Pound Sterling is issued by the Bank of England (BoE).

The single most important factor influencing the value of the Pound Sterling is monetary policy decided by the Bank of England. The BoE bases its decisions on whether it has achieved its primary goal of “price stability” – a steady inflation rate of around 2%. Its primary tool for achieving this is the adjustment of interest rates. When inflation is too high, the BoE will try to rein it in by raising interest rates, making it more expensive for people and businesses to access credit. This is generally positive for GBP, as higher interest rates make the UK a more attractive place for global investors to park their money. When inflation falls too low it is a sign economic growth is slowing. In this scenario, the BoE will consider lowering interest rates to cheapen credit so businesses will borrow more to invest in growth-generating projects.

Data releases gauge the health of the economy and can impact the value of the Pound Sterling. Indicators such as GDP, Manufacturing and Services PMIs, and employment can all influence the direction of the GBP. A strong economy is good for Sterling. Not only does it attract more foreign investment but it may encourage the BoE to put up interest rates, which will directly strengthen GBP. Otherwise, if economic data is weak, the Pound Sterling is likely to fall.

Another significant data release for the Pound Sterling is the Trade Balance. This indicator measures the difference between what a country earns from its exports and what it spends on imports over a given period. If a country produces highly sought-after exports, its currency will benefit purely from the extra demand created from foreign buyers seeking to purchase these goods. Therefore, a positive net Trade Balance strengthens a currency and vice versa for a negative balance.


Source link

12 02, 2025

Seraphina Therapeutics Adds Nutrition Industry Executive Bruce Brown to Lead Growth Strategy for C15:0

By |2025-02-12T16:53:51+02:00February 12, 2025|Dietary Supplements News, News|0 Comments


SAN DIEGO, Calif., Feb. 12, 2025 (GLOBE NEWSWIRE) — Today, Seraphina Therapeutics, the pioneer in healthspan-extending nutrient research, announced an addition to its leadership team. Bruce Brown, formerly the End Use Market Executive for Kerry, joins the company to lead the growth strategy for C15:0, the first essential fatty acid to be discovered in over 90 years.

Bruce Brown joins Seraphina Therapeutics from Kerry Group where he led strategy and commercial responsibilities for the dietary supplement End Use Market. Prior to Kerry Group, Brown spearheaded all commercial activities and operations as President and Chief Operating Officer at Natreon, establishing a leadership position in patented bioactives and extracts for the use in food, beverages and dietary supplements. Brown’s early career started in the public health sector, notably serving communities in West and East Africa with the Centers for Disease Control and Prevention (CDC) and The Carter Center.

Brown’s strong track record for leading, building, transforming, and growing nutrition ingredients will elevate Seraphina Therapeutics’ operations, positioning the company for continued expansion. In addition, Brown will continue to serve in his industry leadership role as Chairman of the Council for Responsible Nutrition (CRN).

“I initially became excited about joining Seraphina Therapeutics because of the groundbreaking science supporting C15:0, and the opportunity to translate this science across numerous consumer markets, with the ultimate goal of positively impacting public health and quality of life,” said Brown. “As the first essential fatty acid to be discovered in over 90 years, C15:0 has the incredible power to prolong long-term health and strengthen against age-related decline. In my new role, I look forward to making C15:0 more accessible to all.”

To learn more about Seraphina Therapeutics and the science and health benefits behind C15:0, visit https://seraphinatherapeutics.com/.

Get the latest news


delivered to your inbox

Sign up for The Manila Times newsletters

By signing up with an email address, I acknowledge that I have read and agree to the Terms of Service and Privacy Policy.

About Seraphina Therapeutics, Inc.

Seraphina Therapeutics, Inc. is a health and wellness company dedicated to advancing global health through the discovery of essential fatty acids and micronutrient therapeutics. Through rigorous breakthrough science, the company develops fatty acid supplements, food fortifiers, and nutritional interventions to strengthen cells, keep mitochondria working and advance cellular homeostasis to counter age-related breakdown. With its team of industry-leading scientists, Seraphina Therapeutics challenges long-held approaches to nutrition, enabling the creation of novel health products designed to support quality of life. For more information, please visit DiscoverC15.com and fatty15.com.

Contact

LaunchSquad for Seraphina Therapeutics

[email protected]


Source link

12 02, 2025

Cardano Whales Scoop 1.41B Tokens, Sparking 107% Price Surge

By |2025-02-12T16:50:47+02:00February 12, 2025|Crypto News, News|0 Comments

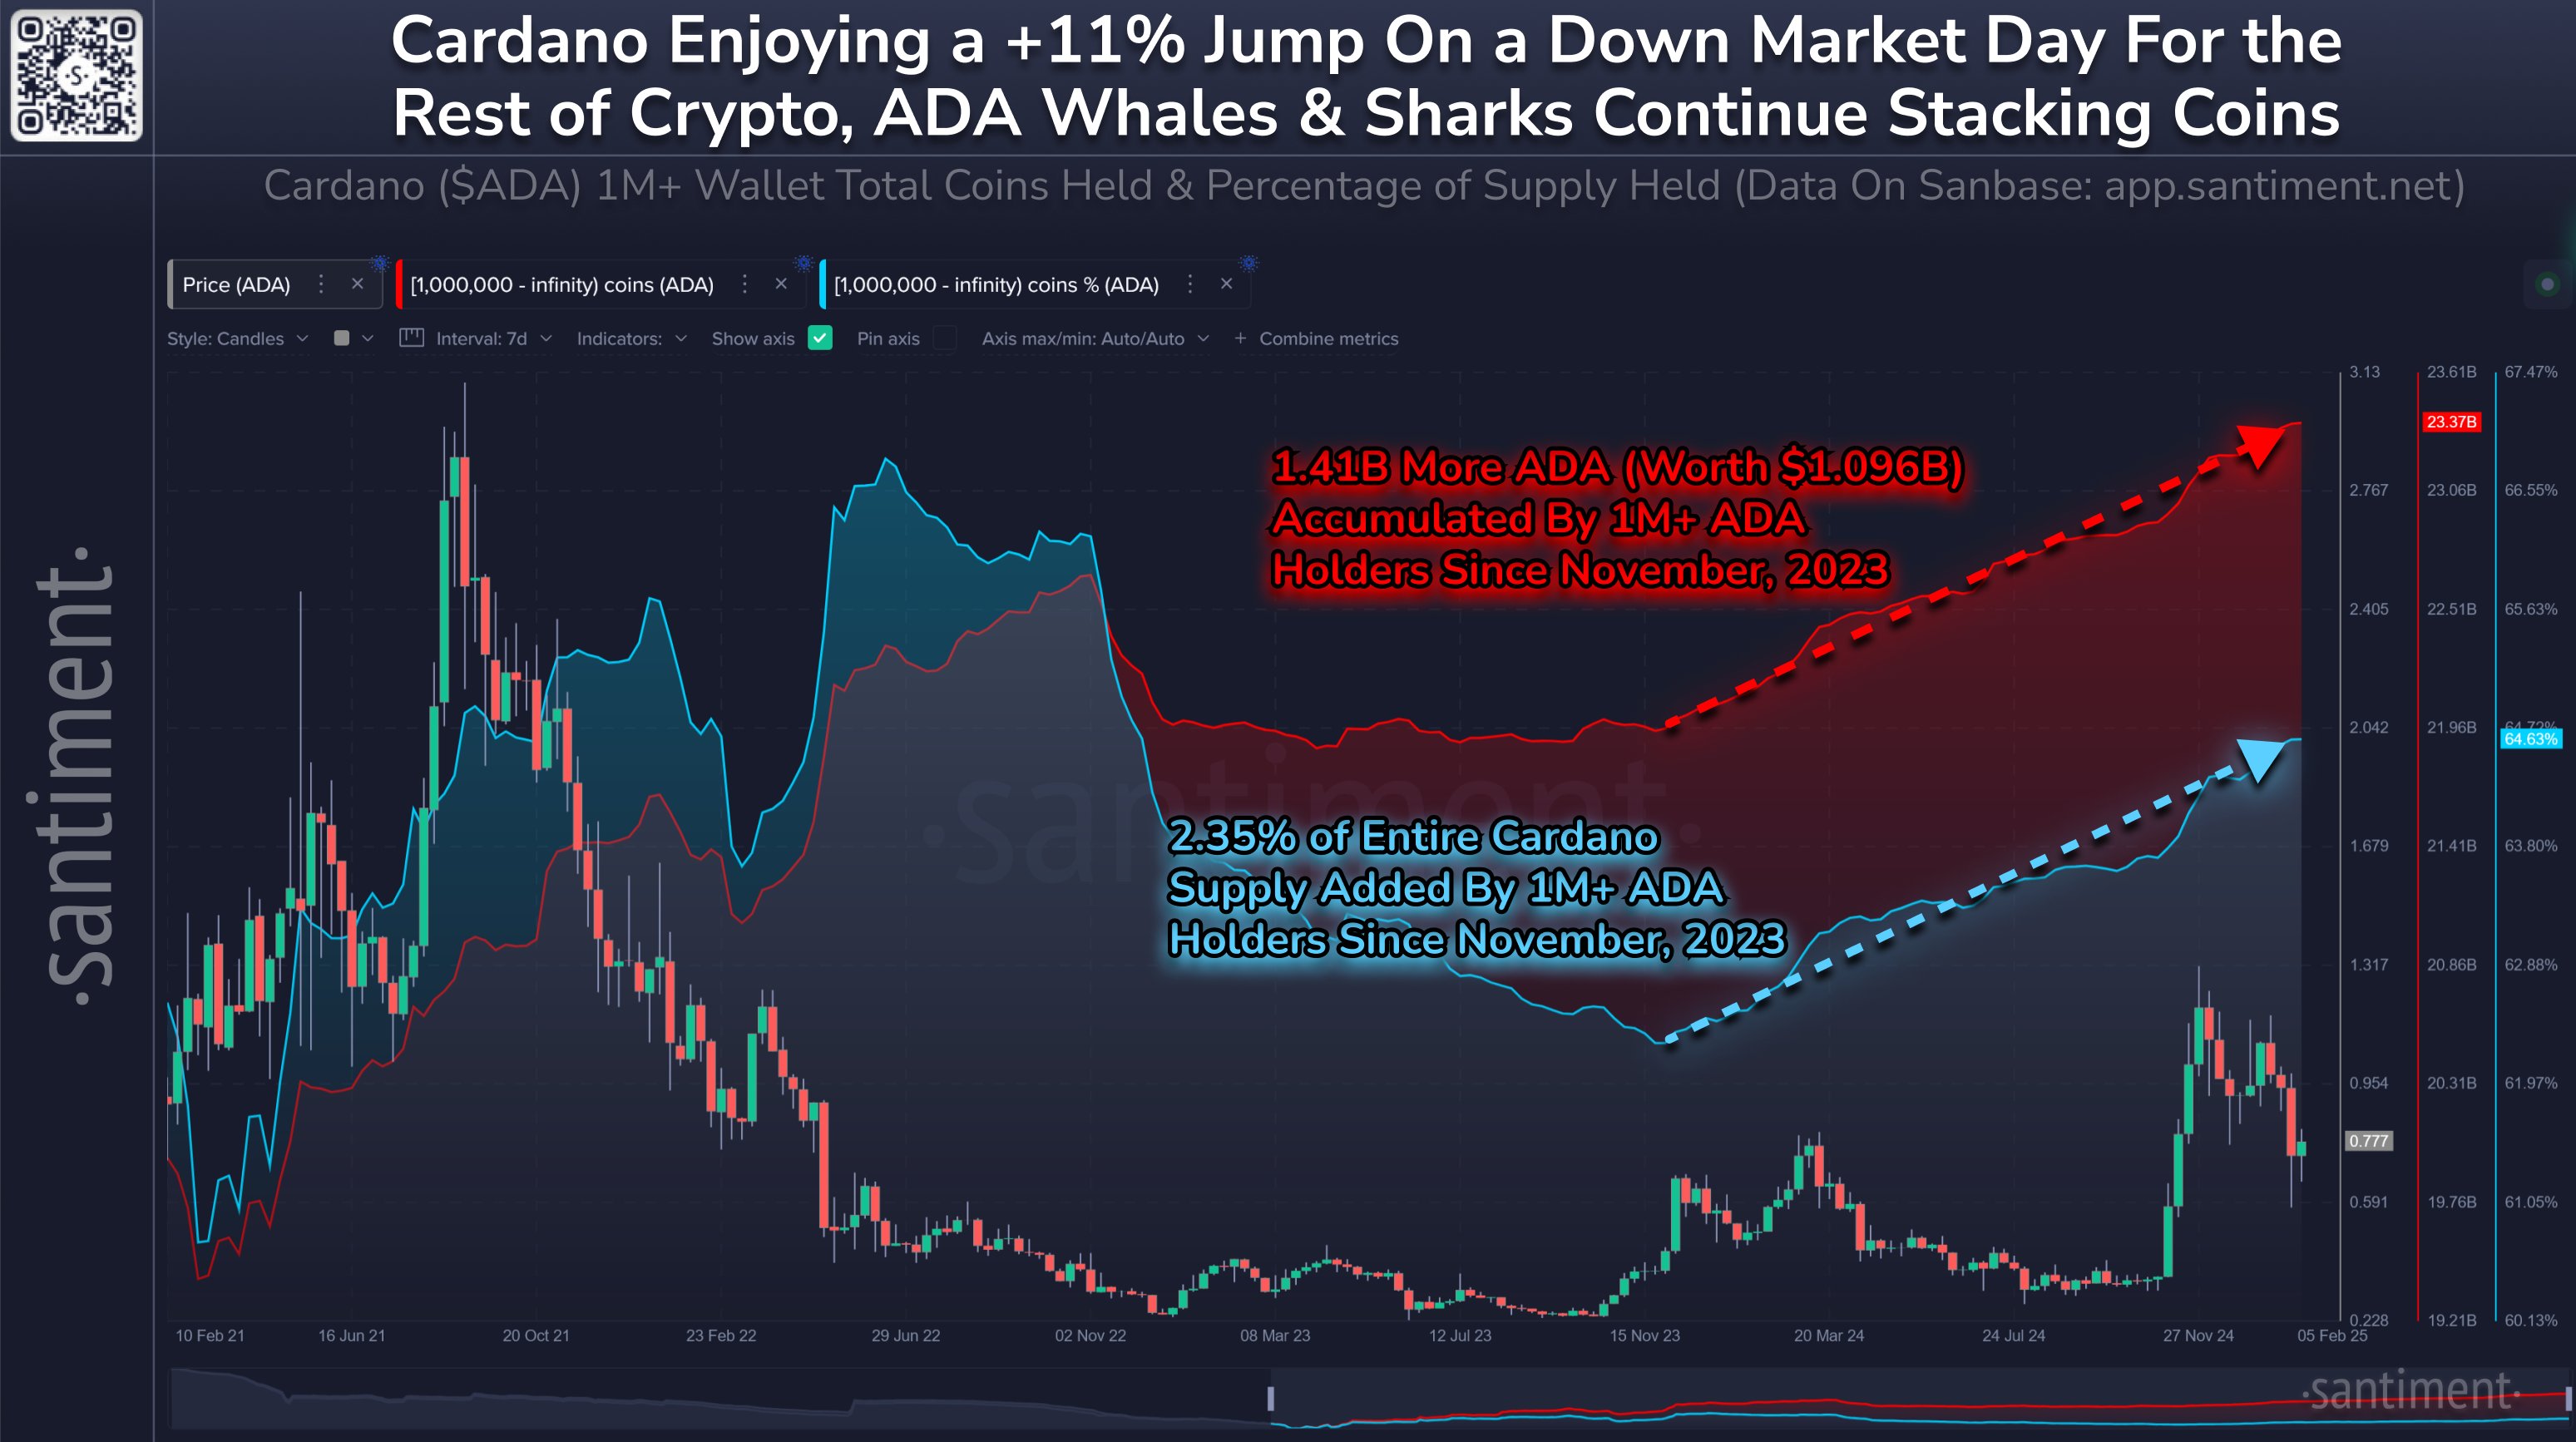
Santiment recently reported that Cardano price surged 107% since whale accumulation began, with 1.41 billion ADA added since November 2023.

Cardano (ADA) has experienced a 4.7% decline in the past 24 hours, trading at $0.7593. The price fluctuated between $0.7562 and $0.815, reflecting short-term volatility. Despite this, ADA has recorded a 41.7% increase over the past year, underscoring its long-term recovery. 

Whale Accumulation and Market Trends

However, amid the short-term decline, market intelligence platform Santiment reported that Cardano’s market capitalization rose by 11% while most crypto assets saw pullbacks. 

The accumulation activity of large ADA holders remains a key factor in this trend. Wallets holding at least 1 million ADA have steadily accumulated since November 2023, adding 1.41 billion ADA. This represents 2.35% of the total Cardano supply, reinforcing confidence among institutional investors and whales.

According to Santiment, despite market volatility, Cardano’s price has surged 107% since the onset of whale and shark accumulation.

Image


Long-term Conviction For Cardano

Supporting data from IntoTheBlock highlights shifting market dynamics. ADA holders with assets for over a year increased their positions by 1.81%, showing long-term conviction. 

Cardano Balances by Time HeldCardano Balances by Time Held
Cardano Balances by Time Held

Mid-term holders, or cruisers, grew their holdings by 7.65%, while short-term traders saw a decline of 11.75%. This shift suggests a growing preference for long-term holding strategies over short-term speculation.

Potential Breakout and Technical Analysis

As whales continue to accumulate ADA, enthusiasts are on the lookout for how the token’s price could perform.

Crypto analyst Trader Steve recently identified ADA’s potential to replicate XRP’s recent price action. He emphasized key Fibonacci retracement levels, with support around the 61.8% and 78.6% ranges.

The analysis suggests a possibility for ADA to mirror XRP’s late 2024 rally, which saw the token break multiple resistance levels before reaching a seven-year high above $3.

ADA, in contrast, has yet to reclaim its December 2024 high of $1.32. Other analysts are also monitoring whether the asset can sustain upward momentum. Crypto trader Yoel Jr. noted that ADA must close above $0.81 to confirm a bullish trend. Failing to do so may leave the asset in what he termed the “boring zone.”

Further, analyst Jonathan Carter pointed to a bull flag formation on the daily chart, suggesting a potential upward move. He indicated that a price retest near $0.60 could provide stronger entry points for buyers. If ADA rebounds from this level, possible price targets include $0.845, $1, and $1.325.

DisClamier: This content is informational and should not be considered financial advice. The views expressed in this article may include the author’s personal opinions and do not reflect The Crypto Basic opinion. Readers are encouraged to do thorough research before making any investment decisions. The Crypto Basic is not responsible for any financial losses.

Source link

12 02, 2025

EIA’s natural gas price forecast climbs 21%

By |2025-02-12T15:12:07+02:00February 12, 2025|Forex News, News|0 Comments


The Department of Energy’s statistical arm boosted its outlook Tuesday for U.S. natural gas prices in 2025 and 2026, tempering hopes for lower heating costs for some Americans.

The U.S. Energy Information Administration included the numbers in its latest short-term energy outlook — the first it has released under the new Trump administration. President Donald Trump pledged last year on the campaign trail to slash energy prices in half in 18 months, even as forecasts have indicated that natural gas prices could rise.

In its latest assessment, EIA said the natural gas price at the U.S. benchmark Henry Hub is expected to average $3.80 per million British thermal units in 2025 — up about 21 percent from its last forecast. EIA also raised its estimate for 2026, putting the annual average price at $4.20 per million Btus, compared with $4 in its January report.

The agency said “above-average withdrawals from underground natural gas storage” in January pushed prices higher, as did cold weather in mid-January. The Henry Hub spot price averaged $4.13 in January, EIA said, up from $3.01 in December.


Source link

12 02, 2025

Euro closes in on key resistance area

By |2025-02-12T14:54:12+02:00February 12, 2025|Forex News, News|0 Comments

  • EUR/USD trades in the positive territory above 1.0350 on Wednesday.
  • January inflation data from the US will be watched closely by market participants.
  • The near-term technical outlook points to a bullish tilt.

EUR/USD gained traction in the second half of the day on Tuesday and rose more than 0.5%. The pair trades marginally higher on the day above 1.0350 in the European session on Wednesday and the technical outlook points to a buildup of bullish momentum.

Euro PRICE This week

The table below shows the percentage change of Euro (EUR) against listed major currencies this week. Euro was the strongest against the Japanese Yen.

  USD EUR GBP JPY CAD AUD NZD CHF
USD   -0.39% -0.36% 1.44% 0.12% -0.08% 0.36% 0.24%
EUR 0.39%   0.10% 1.97% 0.62% 0.30% 0.84% 0.70%
GBP 0.36% -0.10%   1.70% 0.49% 0.20% 0.74% 0.60%
JPY -1.44% -1.97% -1.70%   -1.35% -1.44% -1.07% -1.17%
CAD -0.12% -0.62% -0.49% 1.35%   -0.17% 0.21% 0.08%
AUD 0.08% -0.30% -0.20% 1.44% 0.17%   0.54% 0.38%
NZD -0.36% -0.84% -0.74% 1.07% -0.21% -0.54%   -0.13%
CHF -0.24% -0.70% -0.60% 1.17% -0.08% -0.38% 0.13%  

The heat map shows percentage changes of major currencies against each other. The base currency is picked from the left column, while the quote currency is picked from the top row. For example, if you pick the Euro from the left column and move along the horizontal line to the US Dollar, the percentage change displayed in the box will represent EUR (base)/USD (quote).

In the absence of high-impact data releases, the modest improvement seen in market mood made it difficult for the US Dollar (USD) to find demand on Tuesday, helping EUR/USD push higher. Meanwhile, Federal Reserve (Fed) Chairman Jerome Powell refrained from providing any fresh hints regarding the policy outlook. 

While testifying on the semi-annual Monetary Policy Report before the Senate Banking Committee on Tuesday, Powell reiterated that they do not need to be in a hurry to adjust the monetary policy. “The US is economy strong overall; inflation is closer to 2% goal but still somewhat elevated,” he added.

Later in the day, the US Bureau of Labor Statistics will publish the Consumer Price Index (CPI) data for January. Markets expect the core CPI, which excludes volatile food and energy prices, to rise 0.3% on a monthly basis. A print above the market consensus could weigh on risk mood and boost the USD with the immediate reaction, forcing EUR/USD to reverse its direction. On the other hand, a softer-than-forecast monthly core inflation reading could allow the pair to build on Tuesday’s gains.

Powell will testify before the House Financial Services Committee on Wednesday but he is likely to read the same exact statement from the first day of his testimony.

EUR/USD Technical Analysis

The Relative Strength Index (RSI) indicator rose to 60 and EUR/USD closed the last three 4-hour candles above the 200-period Simple Moving Average (SMA), reflecting an increasing buyer interest.

EUR/USD could face stiff resistance at 1.0390-1.0400 (100-period SMA, Fibonacci 50% retracement of the latest downtrend) ahead of 1.0440 (Fibonacci 61.8% retracement) and 1.0500-1.0510 (round level, Fibonacci 78.6% retracement).

On the downside, first support area could be spotted at 1.0290-1.0300 (Fibonacci 23.6% retracement of the latest downtrend, round level) before 1.0250 (static level) and 1.0200 (round level, static level). 

Euro FAQs

The Euro is the currency for the 19 European Union countries that belong to the Eurozone. It is the second most heavily traded currency in the world behind the US Dollar. In 2022, it accounted for 31% of all foreign exchange transactions, with an average daily turnover of over $2.2 trillion a day. EUR/USD is the most heavily traded currency pair in the world, accounting for an estimated 30% off all transactions, followed by EUR/JPY (4%), EUR/GBP (3%) and EUR/AUD (2%).

The European Central Bank (ECB) in Frankfurt, Germany, is the reserve bank for the Eurozone. The ECB sets interest rates and manages monetary policy. The ECB’s primary mandate is to maintain price stability, which means either controlling inflation or stimulating growth. Its primary tool is the raising or lowering of interest rates. Relatively high interest rates – or the expectation of higher rates – will usually benefit the Euro and vice versa. The ECB Governing Council makes monetary policy decisions at meetings held eight times a year. Decisions are made by heads of the Eurozone national banks and six permanent members, including the President of the ECB, Christine Lagarde.

Eurozone inflation data, measured by the Harmonized Index of Consumer Prices (HICP), is an important econometric for the Euro. If inflation rises more than expected, especially if above the ECB’s 2% target, it obliges the ECB to raise interest rates to bring it back under control. Relatively high interest rates compared to its counterparts will usually benefit the Euro, as it makes the region more attractive as a place for global investors to park their money.

Data releases gauge the health of the economy and can impact on the Euro. Indicators such as GDP, Manufacturing and Services PMIs, employment, and consumer sentiment surveys can all influence the direction of the single currency. A strong economy is good for the Euro. Not only does it attract more foreign investment but it may encourage the ECB to put up interest rates, which will directly strengthen the Euro. Otherwise, if economic data is weak, the Euro is likely to fall. Economic data for the four largest economies in the euro area (Germany, France, Italy and Spain) are especially significant, as they account for 75% of the Eurozone’s economy.

Another significant data release for the Euro is the Trade Balance. This indicator measures the difference between what a country earns from its exports and what it spends on imports over a given period. If a country produces highly sought after exports then its currency will gain in value purely from the extra demand created from foreign buyers seeking to purchase these goods. Therefore, a positive net Trade Balance strengthens a currency and vice versa for a negative balance.


Source link

12 02, 2025

5-Hydroxytryptophan Market Size, Share | CAGR of 7.2%

By |2025-02-12T14:52:47+02:00February 12, 2025|Dietary Supplements News, News|0 Comments


Report Overview

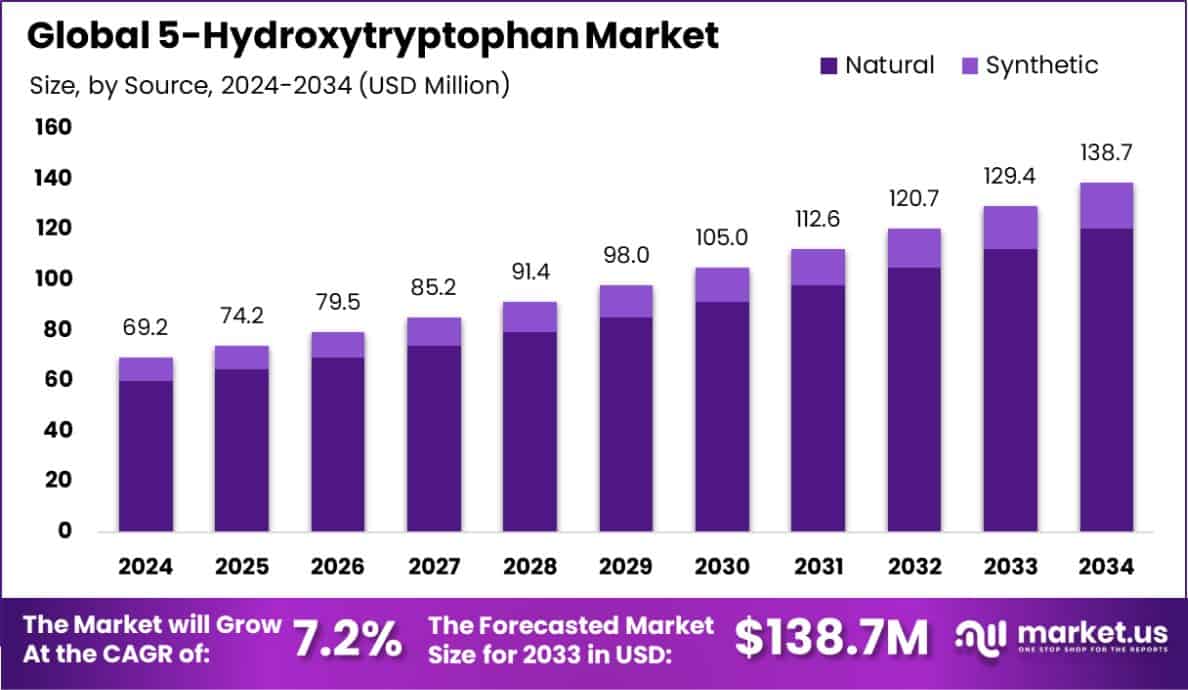
The Global 5-Hydroxytryptophan Market is expected to be worth around USD 138.7 million by 2034, up from USD 69.2 million in 2024, and grow at a CAGR of 7.2% from 2025 to 2034. The Asia-Pacific 5-Hydroxytryptophan market holds 49.8%, worth USD 34.0 million.

5-Hydroxytryptophan, commonly known as 5-HTP, is a naturally occurring amino acid and chemical precursor as well as a metabolic intermediate in the biosynthesis of the neurotransmitter serotonin. Derived primarily from the seeds of Griffonia simplicifolia, a West African medicinal plant, 5-HTP is frequently used as a dietary supplement to enhance serotonin levels in the body, promoting benefits in mood, anxiety, and sleep.

The 5-Hydroxytryptophan market has been witnessing growth due to its increasing popularity in mental health and wellness supplements. Factors such as the rising awareness of mental health issues, the growing prevalence of anxiety and depression, and the shift towards natural dietary supplements significantly drive the demand for 5-HTP. Furthermore, the expanding body of clinical research supporting its therapeutic benefits contributes to its robust market growth.
5-Hydroxytryptophan Market Size, Share | CAGR of 7.2%

Opportunities in the 5-HTP market are abundant, particularly in the development of enhanced formulations and combination dietary supplements that offer improved bioavailability and efficacy. The rising interest in holistic and preventive healthcare, particularly in developed regions, offers a lucrative avenue for market expansion.

Additionally, as consumers increasingly seek plant-based and non-pharmaceutical solutions to health management, the demand for 5-HTP is expected to surge, bolstered by its natural origin and potential health benefits.

The 5-Hydroxytryptophan (5-HTP) market is poised for steady growth, driven by rising consumer interest in mood-enhancing supplements and expanding research investments. The NSF’s $1,998,812 grant (2021-2025) for bioorthogonal chemistries and a $269,999 award (2015-2016) for microbial 5-HTP production highlight sustained R&D momentum, fostering innovation and enhancing production scalability in this evolving market.

Key Takeaways

  • The Global 5-Hydroxytryptophan Market is expected to be worth around USD 138.7 million by 2034, up from USD 69.2 million in 2024, and grow at a CAGR of 7.2% from 2025 to 2034.
  • The 5-Hydroxytryptophan market is dominated by natural sources, accounting for 87.1% of total production volume.
  • High-purity (≥99%) 5-HTP holds a 72.3% market share, reflecting strong demand for premium-quality formulations globally.
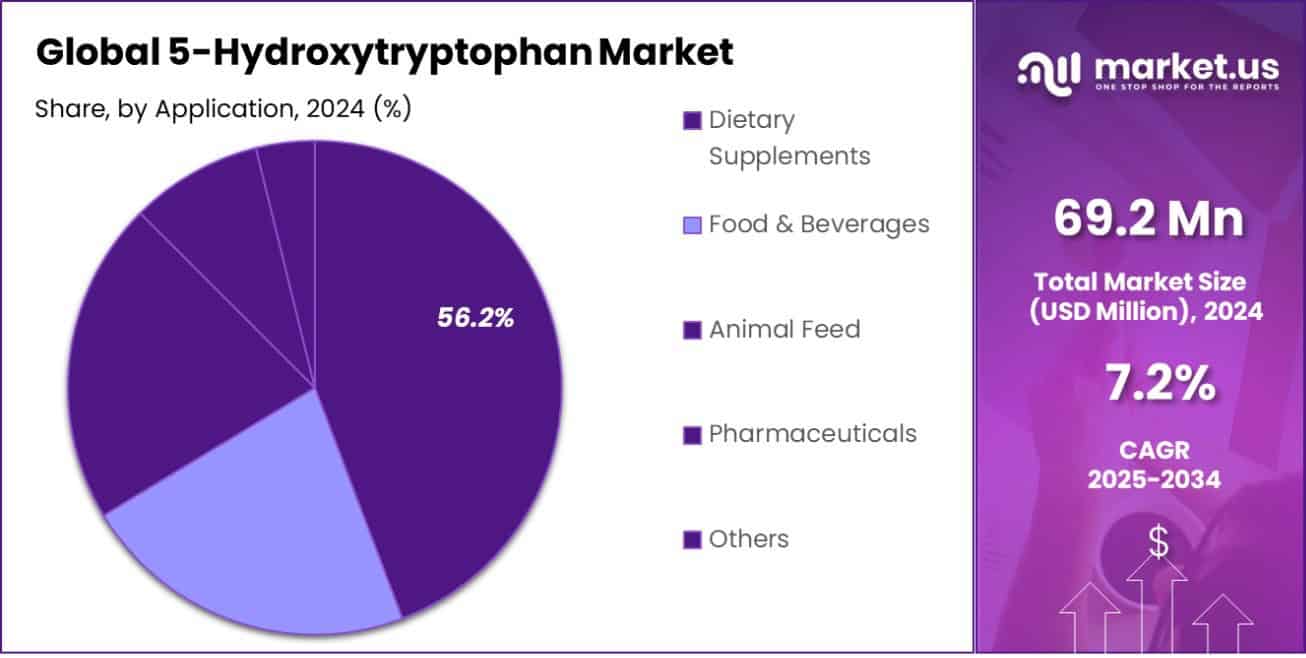
  • Dietary supplements drive 56.2% of the 5-Hydroxytryptophan market, fueled by increasing consumer focus on mental well-being.
  • Online channels lead to 63.4% of 5-HTP sales, highlighting e-commerce’s growing role in supplement distribution strategies.
  • The Asia-Pacific 5-Hydroxytryptophan market holds a 49.8% share, valued at USD 34.0 million.

By Source Analysis

Natural sources dominate the 5-Hydroxytryptophan market, comprising 87.1% of the total supply.

In 2024, Natural held a dominant market position in the By Source segment of the 5-Hydroxytryptophan (5-HTP) Market, accounting for 87.1% of the total market share. The strong preference for naturally derived 5-HTP is primarily driven by increasing consumer demand for plant-based and clean-label supplements, particularly those extracted from Griffonia simplicifolia seeds. This trend aligns with the rising awareness of the health benefits associated with natural ingredients, as well as the expanding nutraceutical and dietary supplement industry.

Meanwhile, the Synthetic segment accounted for the remaining market share. While synthetic 5-HTP offers cost advantages and controlled purity, it has not gained the same traction as its natural counterpart due to consumer skepticism toward artificial additives and growing regulatory scrutiny over synthetic supplement ingredients.

Looking ahead, the natural segment is expected to maintain its lead, supported by continued product innovation, clean-label formulations, and increasing adoption of plant-derived alternatives in the pharmaceutical and functional food industries. However, challenges such as raw material availability and supply chain fluctuations may impact price stability. The Synthetic segment, although smaller, is likely to witness steady demand from industries prioritizing cost-effective and scalable production processes.

By Purity Analysis

High-purity (≥99%) 5-HTP accounts for 72.3% of the market demand.

In 2024, ≥ 99% of Purity held a dominant market position in the By Purity segment of the 5-Hydroxytryptophan (5-HTP) Market, capturing 72.3% of the total market share. The high preference for ≥ 99% purity 5-HTP is driven by its extensive use in pharmaceutical and nutraceutical applications, where stringent quality standards and high bioavailability are critical.

The increasing consumer shift toward premium dietary supplements with superior efficacy further supports the segment’s expansion. Additionally, the rising prevalence of mood disorders, insomnia, and appetite-related conditions has fueled demand for high-purity 5-HTP formulations.

Meanwhile, the < 99% Purity segment accounted for the remaining market share. This category primarily caters to cost-sensitive applications, including functional foods and general wellness supplements, where slightly lower purity levels do not significantly impact product efficacy. However, concerns over impurities and regulatory compliance may limit its widespread adoption.

Going forward, the ≥ 99% Purity segment is expected to maintain its lead, supported by advancements in extraction and purification technologies. The segment’s growth will also be bolstered by increasing investments in clinical research and product standardization, ensuring sustained consumer trust and regulatory compliance.

By Application Analysis

Dietary supplements lead application, capturing 56.2% of the 5-Hydroxytryptophan market share.

In 2024, Dietary Supplements held a dominant market position in the By Application segment of the 5-Hydroxytryptophan (5-HTP) Market, accounting for 56.2% of the total market share. The segment’s strong performance is primarily driven by the rising consumer preference for natural mood-enhancing and sleep-support supplements.

With increasing awareness about mental health, stress management, and sleep disorders, 5-HTP has gained significant traction as a functional ingredient in dietary supplements. Additionally, the growing demand for plant-based and clean-label nutraceuticals has further propelled the adoption of 5-HTP in this segment.

Other segments, including Food & Beverages, Animal Feed, and Pharmaceuticals, accounted for the remaining market share. While Food & Beverages is witnessing the gradual adoption of 5-HTP in functional foods and wellness drinks, regulatory challenges and dosage limitations remain key barriers to widespread use.

Meanwhile, Pharmaceuticals continue to explore 5-HTP for its therapeutic potential in neurological disorders, though clinical research and approval processes influence its market penetration. The Animal Feed segment holds a niche share, primarily driven by research into cognitive and stress-related benefits for livestock and pets.
5-Hydroxytryptophan Market Share5-Hydroxytryptophan Market Share

By Distribution Channel Analysis

Online distribution channels drive sales, representing 63.4% of total market revenue.

In 2024, Online held a dominant market position in the By Distribution Channel segment of the 5-Hydroxytryptophan (5-HTP) Market, capturing 63.4% of the total market share. The strong growth of the online segment is driven by the increasing preference for e-commerce platforms, which offer convenience, competitive pricing, and a wider product selection.

Consumers are increasingly purchasing dietary supplements, including 5-HTP, through online channels due to easy access to product information, customer reviews, and subscription-based models. Additionally, the expansion of direct-to-consumer (DTC) brands and the growing influence of digital marketing strategies have further accelerated online sales.

The Offline segment accounted for the remaining market share, comprising sales through pharmacies, health stores, and supermarkets. While physical retail channels continue to serve a loyal consumer base seeking expert guidance and immediate product availability, the shift toward digital shopping has constrained its growth. Brick-and-mortar stores face challenges such as limited stock-keeping units (SKUs) and higher operational costs compared to online marketplaces.

Going forward, the Online segment is expected to maintain its dominance, driven by rising internet penetration, the growth of e-commerce platforms, and increasing consumer reliance on digital health and wellness solutions. However, strategic collaborations between brands and physical retailers may help sustain the offline segment.

Key Market Segments

By Source

By Purity

  • ≥ 99% Purity
  • < 99% Purity

By Application

  • Food & Beverages
  • Dietary Supplements
  • Animal Feed
  • Pharmaceuticals
  • Others

By Distribution Channel

Driving Factors

Growing Consumer Demand for Natural Mood Boosters

One of the biggest factors driving the 5-Hydroxytryptophan (5-HTP) market is the increasing demand for natural mood-enhancing supplements. More people are looking for plant-based solutions to help with stress, anxiety, and sleep issues, and 5-HTP, derived from Griffonia simplicifolia, fits perfectly into this trend.

With growing awareness about mental well-being and the negative effects of synthetic drugs, consumers are shifting toward natural alternatives. Additionally, the rise of online health-conscious communities and social media awareness is further boosting the demand for 5-HTP supplements worldwide.

Restraining Factors

Regulatory Challenges and Quality Control Issues

A major challenge for the 5-Hydroxytryptophan (5-HTP) market is strict regulations and quality control concerns. Since 5-HTP is used in dietary supplements and pharmaceuticals, it must meet high safety and purity standards. Different countries have different rules for its approval and usage, which can slow down product launches and market expansion.

Additionally, concerns about contamination and inconsistent potency in some low-quality 5-HTP products affect consumer trust. Companies must invest in rigorous testing and compliance measures to overcome these regulatory hurdles and build credibility.

Growth Opportunity

Expansion in Functional Foods and Beverages

A key growth opportunity in the 5-Hydroxytryptophan (5-HTP) market lies in its expanding use in functional foods and beverages. As consumers look for natural ways to improve mood, sleep, and stress management, brands are incorporating 5-HTP into fortified drinks, protein bars, and wellness snacks.

The growing interest in plant-based and clean-label products further supports this trend. While regulatory approvals remain a challenge, companies investing in innovative formulations and clinical-backed claims can unlock new market potential, especially in health-conscious consumer segments.

Latest Trends

Rising Popularity of Vegan and Clean-Label Supplements

A key trend in the 5-Hydroxytryptophan (5-HTP) market is the increasing demand for vegan and clean-label supplements. Consumers today prefer natural, plant-based products without artificial additives, preservatives, or synthetic fillers.

Since 5-HTP is derived from Griffonia simplicifolia, it aligns well with the growing shift toward vegan and organic nutraceuticals. Brands are now highlighting non-GMO, gluten-free, and sustainably sourced 5-HTP products to attract health-conscious buyers. This trend is driving innovation in formulations and packaging, making 5-HTP more appealing to modern consumers.

Regional Analysis

The Asia-Pacific region holds a 49.8% share in the 5-Hydroxytryptophan market, valued at USD 34.0 million.

In 2024, Asia-Pacific dominated the 5-Hydroxytryptophan (5-HTP) market, accounting for 49.8% of the total share, valued at USD 34.0 million. The region’s strong market position is driven by rising consumer awareness of mental health benefits and the increasing demand for natural mood-enhancing supplements.

Countries such as China, Japan, and India are experiencing rapid growth due to expanding nutraceutical industries and higher adoption of plant-based dietary supplements. Additionally, the availability of Griffonia simplicifolia extracts and investments in clean-label formulations are further supporting market expansion.

North America holds a significant market share, supported by the rising prevalence of stress-related disorders and an established dietary supplement industry. The U.S. leads the region with increasing consumer preference for natural sleep aids and mental wellness products. The presence of key market players and a strong e-commerce ecosystem further contribute to growth.

Europe is another key market, benefiting from high consumer spending on nutraceuticals and strict regulatory approvals, ensuring premium-quality 5-HTP products. Countries like Germany, the UK, and France are leading in product innovation, particularly in vegan and organic supplement categories.

Latin America and the Middle East & Africa are emerging markets for 5-HTP, with growing demand from urban health-conscious consumers. However, limited awareness and distribution challenges remain key barriers. Brazil and South Africa are witnessing gradual market expansion due to the increasing penetration of global supplement brands.

5-Hydroxytryptophan Market Region5-Hydroxytryptophan Market Region

Key Regions and Countries

  • North America
  • Europe
    • Germany
    • France
    • The UK
    • Spain
    • Italy
    • Rest of Europe
  • Asia Pacific
    • China
    • Japan
    • South Korea
    • India
    • Australia
    • Rest of APAC
  • Latin America
    • Brazil
    • Mexico
    • Rest of Latin America
  • Middle East & Africa
    • GCC
    • South Africa
    • Rest of MEA

Key Players Analysis

The 5-Hydroxytryptophan (5-HTP) market in 2024 is characterized by strong competition among key players, each leveraging product innovation, distribution expansion, and branding strategies to maintain their market presence.

Companies such as Natrol LLC, Nature’s Way Products, Solgar Inc., and Source Naturals dominate the North American market with well-established brands, extensive retail networks, and trusted formulations. Their strong foothold in the dietary supplement industry, coupled with effective e-commerce strategies, has given them a competitive edge.

In Europe, companies like Biogena Group and Linnea SA focus on premium-quality 5-HTP products, ensuring compliance with stringent regulatory standards. These companies are gaining traction due to the increasing demand for clean-label and clinically tested supplements.

Asia-Pacific players, including Chengdu SanHerb BioScience Co., Ltd., Shaanxi Jiahe Phytochem Co., Ltd., and Rishon Biochem Co., Ltd., play a crucial role in the supply chain by providing high-purity raw materials and bulk extracts to global manufacturers. Their ability to scale production and ensure cost-effectiveness makes them key suppliers for international brands.

Meanwhile, companies such as Douglas Laboratories, Jarrow Formulas, Life Extension Foundation, and Swanson Health Products continue to expand their presence through scientifically backed formulations and customized health solutions. The rising demand for vegan and organic supplements is also pushing brands like Pure Encapsulations and OW Foods to invest in non-GMO, allergen-free formulations.

Top Key Players in the Market

  • 2 Bee Health Limited
  • Alpspure Lifesciences Private Limited
  • Biogena Group
  • CACTUS BOTANICS
  • Chengdu SanHerb BioScience Co., Ltd.
  • Douglas Laboratories
  • Jarrow Formulas
  • Life Extension Foundation
  • Linnea SA
  • Natrol LLC
  • Nature’s Way Products
  • OW Foods
  • Pure Encapsulations
  • Rishon Biochem Co., Ltd
  • Shaanxi Jiahe Phytochem Co., Ltd
  • Solgar Inc.
  • Source Naturals
  • Swanson Health Products

Recent Developments

  • In February 2025, CACTUS BOTANICS revealed its investment in advanced biotechnology to develop a sustainable, plant-based method for 5-HTP production. This initiative aims to reduce reliance on traditional extraction methods and ensure a more stable supply chain.
  • In November 2024, Swanson Health Products merged with a leading online supplement retailer, aiming to enhance its e-commerce presence and distribution network for 5-HTP and other nutritional supplements.
  • In June 2024, Life Extension launched an advanced 5-HTP complex featuring a proprietary blend of 5-HTP, L-theanine, and GABA to promote relaxation and stress relief. The product aims to offer a comprehensive solution for mood and anxiety management
  • In March 2024, Jarrow Formulas introduced a new sustained-release 5-HTP formula designed to provide extended mood and sleep support throughout the day. The product combines 100 mg of 5-HTP with B vitamins and magnesium for enhanced effectiveness

Report Scope


Source link

12 02, 2025

Why Solana (SOL) Price Is Down Today?

By |2025-02-12T14:49:42+02:00February 12, 2025|Crypto News, News|0 Comments

The cryptocurrency market continues recording a mixed price action since the month started. This has resulted in top tokens breaking down their important support trend levels. Following this, the SOL price has plunged below the $200 mark.

Considering the current market trends, investors are curious with questions like “Is this a good time to invest in Solana tokens?” In this article, we at CoinPedia have uncovered the possible short-term Solana Price Analysis just for you!

SOL Price Drops Below The $200 Mark!

The price of Solana has dropped by 4.59% in 24 hours with a trading volume of $3.340 billion, a change of -14.51%. Further, it has plunged 5.59% over the past week, indicating an increase in the selling pressure. With a market cap of $94.605 billion, it has a market dominance of 3.021%.

Why Solana (SOL) Price Is Down Today?
SOL Price Analysis 12th Feb 2025

The Relative Strength Index (RSI) records a steady decline toward the oversold range in the daily time frame. Moreover, its average trendline displays a similar price trend, hinting at a negative outlook for the altcoin in the coming time.

On the other hand, the SMA indicator witnesses a bullish convergence in the Solana price chart. This suggests mixed price sentiment for the 05th largest cryptocurrency in the market.

Will Solana Price Rise Back Up?

Suppose, the bulls regain momentum, the Solana price could retest its immediate resistance level of $200. Furthermore, if the bulls maintain dominance, this could set the stage for this altcoin to head toward its upper resistance level of $210 this month.

On the contrary, a sustained bearish action could result in the price of Solana token plunging toward its crucial support level of $181.50. Moreover, if the bearish sentiment intensifies, this could pull the value of this altcoin toward its low of $155.

Are you one of many who are curious to explore the long-term prospects of SOL tokens? Read CoinPedia’s Solana Price Prediction to uncover the possible mysteries!

FAQs

How much will 1 Solana be worth in 2025?

If the bullish sentiment sustains, the price of SOL token could reach a maximum trading value of $400.

Is Solana a good buy?

With increased adoption and rising dominance, the SOL coin price could range between $716 and $1,351 during the year 2030.

How much is Solana worth now?

At the time of writing, the value of one SOL token was $195.51.

Source link

12 02, 2025

Copper price faces solid resistance – Forecast today – 12-2-2025

By |2025-02-12T13:10:46+02:00February 12, 2025|Forex News, News|0 Comments


Copper price surrendered to the solid resistance formed at 4.6900$ to form correctional bearish rebound and activate the attempts for the expected profit gaining by targeting 4.5200$ level.


Now, stochastic exit from the overbought areas will increase the negative pressures on the price to expect forming additional correctional waves that might push it to reach 4.4600$ and 4.4000$ levels.


The expected trading range for today is between 4.4600$ and 4.6400$


Trend forecast: Bearish


Source link

12 02, 2025

Next upside barrier emerges near 193.50

By |2025-02-12T12:52:52+02:00February 12, 2025|Forex News, News|0 Comments

  • GBP/JPY gains ground to around 191.20 in Wednesday’s early European session. 
  • The cross keeps the negative outlook below the 100-period EMA with the bearish RSI indicator. 
  • The initial support level is seen at 187.70; the key upside barrier to watch is 193.50.

The GBP/JPY cross trades in positive territory near 191.20 during the early European session on Wednesday. The Japanese Yen (JPY) weakens amid the concern that US President Donald Trump’s no-exemption taxes on commodity imports could jeopardize Japan’s economic recovery.

Early Wednesday, Japan’s Finance Minister, Katsunobu Kato, noted that he will assess the impact of US tariffs on the Japanese economy and respond appropriately. 

Technically, the bearish outlook of GBP/JPY remains in place as the cross remains capped below the key 100-day Exponential Moving Average (EMA) on the daily chart. Furthermore, the downward momentum is supported by the Relative Strength Index (RSI), which is located below the midline near 47.45, suggesting that the path of least resistance is to the downside. 

The lower limit of the Bollinger Band at 187.70 acts as an initial support level for the cross. A decisive break below the mentioned level could expose the 187.05-187.00 region, representing the low of February 7 and the psychological mark. Further south, the next contention level is seen at 184.37, the low of September 13, 2024. 

On the bright side, the key resistance level for GBP/JPY emerges near 193.50, the 100-day EMA. Sustained trading above this level could pave the way to 195.15, the upper boundary of the Bollinger Band. The additional upside filter to watch is 197.41, the high of January 6. 

GBP/JPY daily chart

Japanese Yen FAQs

The Japanese Yen (JPY) is one of the world’s most traded currencies. Its value is broadly determined by the performance of the Japanese economy, but more specifically by the Bank of Japan’s policy, the differential between Japanese and US bond yields, or risk sentiment among traders, among other factors.

One of the Bank of Japan’s mandates is currency control, so its moves are key for the Yen. The BoJ has directly intervened in currency markets sometimes, generally to lower the value of the Yen, although it refrains from doing it often due to political concerns of its main trading partners. The BoJ ultra-loose monetary policy between 2013 and 2024 caused the Yen to depreciate against its main currency peers due to an increasing policy divergence between the Bank of Japan and other main central banks. More recently, the gradually unwinding of this ultra-loose policy has given some support to the Yen.

Over the last decade, the BoJ’s stance of sticking to ultra-loose monetary policy has led to a widening policy divergence with other central banks, particularly with the US Federal Reserve. This supported a widening of the differential between the 10-year US and Japanese bonds, which favored the US Dollar against the Japanese Yen. The BoJ decision in 2024 to gradually abandon the ultra-loose policy, coupled with interest-rate cuts in other major central banks, is narrowing this differential.

The Japanese Yen is often seen as a safe-haven investment. This means that in times of market stress, investors are more likely to put their money in the Japanese currency due to its supposed reliability and stability. Turbulent times are likely to strengthen the Yen’s value against other currencies seen as more risky to invest in.


Source link

Go to Top