Alzheimer’s disease (AD), which is a growing concern across the globe, might have found an answer for a better and comprehensive therapy.
The disease, which poses significant challenges in terms of both medical and economic burden, requires treatment and preventive strategies.
According to Mayo Clinic, early symptoms of AD include forgetting recent events or conversations. Over time, Alzheimer’s disease leads to serious memory loss and affects a person’s ability to do everyday tasks.
Researchers at the Institute of Nano Science and Technology (INST) explored a new path involving nanoparticles integrating a polyphenol with antioxidant properties found in green tea, neurotransmitter, and amino acid to treat AD.
How does it work?
According to experts, the new treatment strategy alters the progression of the disease, slowing it down, improving memory, and supporting thinking skills.
The conventional therapies often target only a single pathological feature, such as amyloid aggregation or oxidative stress.
The proposed therapy involved the integration of epigallocatechin-3-gallate (EGCG) an antioxidant found in green tea, dopamine, a neurotransmitter important for mood and tryptophan, an amino acid involved in many cellular functions, into a nanoparticle called EGCG-dopamine-tryptophan nanoparticles (EDTNPs).
The benefit of the nanoparticle is that it acts on multiple targets, such as amyloid aggregation, oxidative stress, inflammation, and neuronal degeneration. It also helped in enhancing neuronal regeneration.
On testing on mouse models, it was observed that these nanoparticles disassembled toxic plaques, reduced inflammation, restored balance inside brain cells, and even improved memory and learning.
Published in the journal Small, experts believe the new therapy path could help people with AD and, in the long run, could make life easier for patients by offering better treatment strategies.
Platinum price began this morning trading with strong positive trading, surpassing the minor bullish channel’s resistance at $1865.00 level, taking advantage of the bullish momentum from the main indicators, to notice recording new historical gains by hitting $1898.00 level.
Note that forming extra support at $1860.00 level and providing bullish momentum by the main indicators, these factors confirm the continuation of the positivity in the near period, attempting to achieve extra gains by reaching $1925.00 followed by 161.8%Fibonacci extension level at $1959.00.
The expected trading range for today is between $1825.00 and $1925.00
The GBPJPY pair succeeded in surpassing the negative pressure, keeping its stability above the initial support at 206.90, noticing the attempt of forming new bullish waves by its rally towards 208.10 barrier, announcing its surrender to the dominance of the sideways bias by the stability of the main levels.
The contradiction between the main indicators confirms the sideways trend in the current trading, to stay aside and monitor the price until surpassing the previously mentioned levels, breaching the barrier and holding above it will open the way for activating the bullish track again and holding below it will force it to force the price to resume the corrective decline, to expect reaching 206.25 and 205.80.
The expected trading range for today is between 207.00 and 208.10
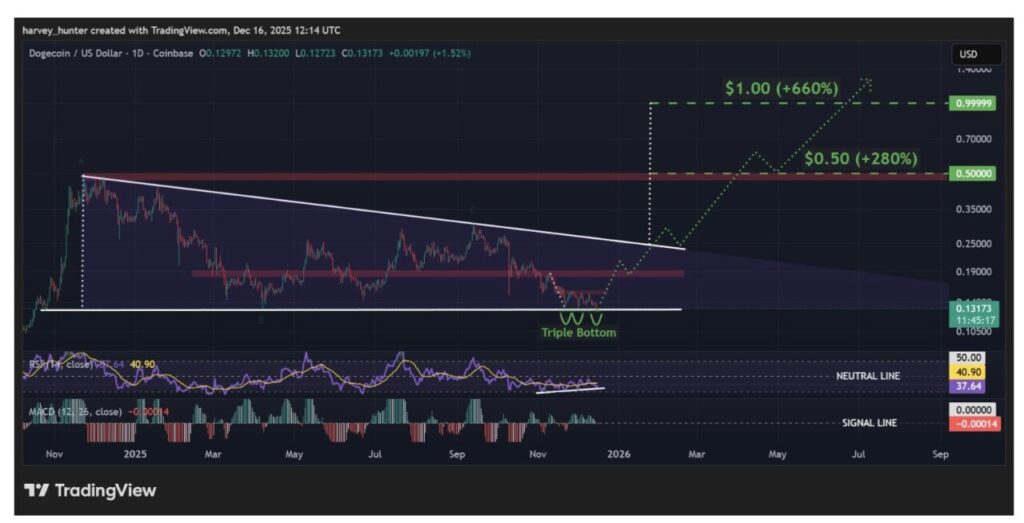
Jakarta, Pintu News – Although Dogecoin has deviated from its historical upward pattern, there is an important demand zone that could be a turning point and drive a bullish rally later in the year. Dogecoin price predictions still leave room for a strong rebound before the year ends.
So, how is the Dogecoin price moving today?
Dogecoin Price Rises 2.00% within 24 Hours
Source: Pintu Market
As of December 17, 2025, Dogecoin posted a 2% gain over the past 24 hours, trading at $0.1314, or approximately IDR 2,188. Over the same period, DOGE fluctuated between IDR 2,129 and IDR 2,211.
At the time of writing, Dogecoin’s market capitalization is estimated at around IDR 335.12 trillion, with a 24-hour trading volume of roughly IDR 16.69 trillion.
Dogecoin is currently testing the $0.13 level which could potentially be the cornerstone of a price rally, with demand likely to return if the year-end bullish trend actually materializes.
A popular analyst under the pseudonym BitGur via the X platform highlighted this pattern, and the green candle that appeared today could be a confirmation that the lowest price has been reached, as buying interest in this meme coin returns.
$DOGE is holding a key demand zone after a prolonged downtrend, showing signs of base formation.
As long as price stays above the current support, a relief bounce toward the marked resistance zone is possible. pic.twitter.com/gOSm3C73PM
The bottom formation mentioned by Bitgur has evolved into a triple bottom pattern, which is a strong reversal structure characterized by three consecutive touches of the basic trendline.
Based on this pattern, analysts expect a reversal of the downward trend over the past two months, with a target of returning to the $0.182 level – a 40% increase.
Historically, the last quarter of the year tends to provide a fairly positive performance for the Dogecoin price. However, 2025 seems to deviate from this pattern as it hasn’t shown a single green month so far.
Source: CryptoRank
So far, the Dogecoin price has weakened by 10.6% during the month of December, reinforcing the ongoing downward trend.
Even so, the analysis from Bitgur could be the turning point that marks December as a green month and maintains the historical pattern that the fourth quarter has at least one month with rising prices.
Dogecoin Price Prediction: December May Be Just the Beginning
The demand zone at $0.13 also coincides with the lower limit of the descending triangle pattern that has been forming for a year, and the triple bottom pattern could be a trigger for a move towards a breakout.
If the triple bottom pattern is successfully confirmed with a clean break above the $0.155 neckline, then the $0.182 target could be a higher and stronger foothold for a further breakout push.
The momentum indicators are still showing bullish tendencies. The RSI indicator continues to form higher lows, pointing towards the neutral line – this indicates buying pressure is slowly building behind the price movement.
Meanwhile, the MACD that had formed a “death cross” below the signal line seems to be temporary, as selling pressure seems to be weakening and losing control of the current trend.
If there is a clean breakout from the triangle pattern, then the upside target of around 260% towards the previous high of $0.50 could be achieved – potentially even towards the full target of $1, which would mean a jump of up to 680%.
However, a move of this magnitude is likely to depend on favorable market conditions – for example, a policy change from the US Fed or the resumption of the quantitative easing (QE) program in 2026 to boost appetite for risky assets.
For now, BitGur’s analysis is a noteworthy scenario in a potential year-end rally – although everything depends on the price’s ability to hold above the $0.13 level.
That’s the latest information about crypto. Follow us on Google News to get the latest crypto news about crypto projects and blockchain technology. Also, learn crypto from scratch with complete discussion through Pintu Academy and stay up-to-date with the latest crypto market such as bitcoin price today, xrp coin price today, dogecoin and other crypto asset prices through Pintu Market.
Enjoy an easy and secure crypto trading experience by downloading Pintu crypto app via Google Play Store or App Store now. Also, get a web trading experience with various advanced trading tools such as pro charting, various types of order types, and portfolio tracker only at Pintu Pro.
*Disclaimer
This content aims to enrich readers’ information. Pintu collects this information from various relevant sources and is not influenced by outside parties. Note that an asset’s past performance does not determine its projected future performance. Crypto trading activities have high risk and volatility, always do your own research and use cold cash before investing. All activities of buying and selling bitcoin and other crypto asset investments are the responsibility of the reader.
Silver price (XAG/USD) posts a fresh all-time high near $66 during the Asian trading session on Wednesday. The white metal extends its bull run as weak United States (US) employment data, Retail Sales, and flash S&P Global Purchasing Managers’ Index (PMI) data raise economic concerns.
The US Nonfarm Payrolls (NFP) report showed on Tuesday that the Unemployment Rate rose to 4.6% in November, the highest level seen since September 2021. In the same period, the economy created 64K fresh jobs, higher than estimates of 50K, but after firing 105K payrolls in October.
Month-on-month Retail Sales remained flat in October, while it was expected to grow steadily by 0.1%. Meanwhile, preliminary S&P Global PMI landed at 53.0, sharply lower than 54.2 in November.
Escalating US economic jitters have raised demand for safe-haven assets, such as Silver.
The broader outlook of the Silver price has remained upbeat due to expectations that the Federal Reserve (Fed) will deliver more interest rate cuts in 2026 than one projected by officials in December’s policy meeting. According to the CME FedWatch tool, there is a 67.6% chance that the Fed will deliver at least two interest rate cuts next year.
Silver technical analysis
Silver price trades almost 3% higher around $66.00 during Asian trading hours. The 20-period Exponential Moving Average (EMA) rises at $63.28, with price holding above the average and keeping the short-term tone positive.
The 14-period Relative Strength Index (RSI) at 69.16 sits near the overbought threshold, signaling that momentum could cool before the next leg higher.
Bias remains firm while the market stays above the rising EMA, where pullbacks would be cushioned. A break below the 20-period EMA would turn the intraday bias down, making Silver fragile towards the psychological level of $60.00. While a persistent hold above it would preserve upside, and keep the odds of further upside towards $70.00
(The technical analysis of this story was written with the help of an AI tool)
Silver FAQs
Silver is a precious metal highly traded among investors. It has been historically used as a store of value and a medium of exchange. Although less popular than Gold, traders may turn to Silver to diversify their investment portfolio, for its intrinsic value or as a potential hedge during high-inflation periods. Investors can buy physical Silver, in coins or in bars, or trade it through vehicles such as Exchange Traded Funds, which track its price on international markets.
Silver prices can move due to a wide range of factors. Geopolitical instability or fears of a deep recession can make Silver price escalate due to its safe-haven status, although to a lesser extent than Gold’s. As a yieldless asset, Silver tends to rise with lower interest rates. Its moves also depend on how the US Dollar (USD) behaves as the asset is priced in dollars (XAG/USD). A strong Dollar tends to keep the price of Silver at bay, whereas a weaker Dollar is likely to propel prices up. Other factors such as investment demand, mining supply – Silver is much more abundant than Gold – and recycling rates can also affect prices.
Silver is widely used in industry, particularly in sectors such as electronics or solar energy, as it has one of the highest electric conductivity of all metals – more than Copper and Gold. A surge in demand can increase prices, while a decline tends to lower them. Dynamics in the US, Chinese and Indian economies can also contribute to price swings: for the US and particularly China, their big industrial sectors use Silver in various processes; in India, consumers’ demand for the precious metal for jewellery also plays a key role in setting prices.
Silver prices tend to follow Gold’s moves. When Gold prices rise, Silver typically follows suit, as their status as safe-haven assets is similar. The Gold/Silver ratio, which shows the number of ounces of Silver needed to equal the value of one ounce of Gold, may help to determine the relative valuation between both metals. Some investors may consider a high ratio as an indicator that Silver is undervalued, or Gold is overvalued. On the contrary, a low ratio might suggest that Gold is undervalued relative to Silver.
Drug marketed as ‘male enhancement’ supplement under scrutiny
All men need to be more careful before taking supplements now.
The FDA urgently announced the recall of a “male enhancement” supplement after it was discovered that the product contained two erectile dysfunction drugs that were not declared on the label.
StuffbyNainax LLC is voluntarily recalling all lots of MR.7 SUPER 700000 capsules, sold as a dietary supplement, after testing showed the product contained erectile dysfunction drugs sildenafil and tadalafil.
Sildenafil, sold under the brand name Viagra and Revatio, and tadalafil, sold under the brand name Cialis, are FDA-approved prescription drugs and active ingredients used to treat male erectile dysfunction.
They belong to a class of drugs known as phosphodiesterase type 5 (PDE 5) inhibitors, and products containing sildenafil or tadalafil cannot be marketed as dietary supplements, the FDA recall noted.
MR.7 SUPER 700000 is an unapproved product and safety and efficacy have not been established for it.
The FDA does not regulate dietary supplements with the same procedures that the use for prescription drugs, however, the agency does step in to issue warnings and recalls after a problem has been reported.
While they are FDA-approved, taking sildenafil and tadalafil carries notable side effect risks, including headache, indigestion, back pain, muscle aches and dizziness.
The male enhancement product was distributed nationwide “to a limited number of online customers between August 2025 and November 2025,” according to the FDA.
Taking sildenafil or tadalafil can be dangerous for the millions of people taking medication to treat chest pain, such as nitroglycerin. Combining them can result in a critical drop in blood pressure.
This can cause dizziness, fainting, falls, heart attack or stroke due to the brain and heart not receiving enough blood flow.
Solana price is consolidating above the critical $120 support zone, with compressed price action and conflicting technical signals leaving traders focused on whether a breakdown or reversal comes next.
Solana price is consolidating near a critical demand zone after an extended corrective phase, with price action showing increasing compression around the $120–$130 range.
Solana current price is $126.95, down -4.33% in the last 24 hours. Source: Brave New Coin
According to Brave New Coin data, Solana is trading near $126.95, down modestly on the day but still holding above a long-standing support band that has repeatedly defined medium-term market structure. As price tightens within this range, traders are increasingly focused on whether SOL can continue to hold its key support levels.
Range Compression Keeps $120–$130 in Focus
A chart from ChiefraT shows Solana continuing to respect a clearly defined horizontal range, with $120–$125 acting as demand and $145–$146 capping upside. Price has revisited the lower boundary multiple times in recent weeks without follow-through selling, reinforcing this zone as a decisive support level.
Solana continues to trade within a well-defined range as volatility compresses. Source: ChiefraT via X
This repeated defense suggests that sellers are struggling to gain momentum below $120, while buyers remain active enough to prevent a clean breakdown. Until SOL decisively exits this range, the market remains in a neutral holding pattern.
Fake-Out Risk Grows as Head-and-Shoulders Becomes Obvious
Elja Boom highlighted a key behavioral dynamic developing on Solana’s chart: the emergence of a widely visible bearish head-and-shoulders structure. Rather than viewing this as a guaranteed breakdown signal, Elja argues that overly obvious patterns often lead to fake-outs designed to flush late sellers.
Obvious bearish structures increase the probability of a shakeout rather than continuation. Source: Elja Boom via X
His outlook suggests that any brief move below the neckline could serve as a liquidity grab, potentially setting the stage for a sharp reversal once selling pressure exhausts. This aligns with SOL’s repeated failure to extend losses despite multiple tests of the same demand region.
Short-Term Rejection Risk Builds Near $129–$132
From a short-term trading perspective, Crypto Tony maintains a bearish outlook on Solana as long as the price fails to reclaim the $129–$132 resistance band. His chart highlights this zone as a key rejection area, where previous bounce attempts have repeatedly stalled.
According to Tony, a clean rejection from this level keeps downside pressure active, with $120–$122 remaining the primary downside target. A breakdown below this support would likely accelerate selling toward the $112–$108 liquidity pocket, which aligns with prior consolidation lows. Until SOL can flip $132 into support, his bias remains firmly tilted toward continuation rather than recovery.
SOL faces repeated rejection risk near $129, keeping downside targets active. Source: Crypto Tony via X
Weekly Structure Weakens as SOL Trades Below EMA200
On higher timeframes, Trader Koala’s analysis reinforces a structurally bearish outlook. His weekly chart shows Solana closing below the weekly EMA200, a level that historically acts as a dividing line between bull and bear phases.
SOL remains structurally weak below the weekly EMA200. Source: Trader Koala via X
Solana chart identifies $120–$118 as the last meaningful weekly support before price risks sliding into the $89–$101 macro demand zone, which he labels as the next major landing area if selling pressure persists. In his broader projection, Koala suggests that a full market reset could eventually drag SOL into the $30–$50 region, though he emphasizes that such levels would likely only come into play under sustained macro weakness.
Solana Price Prediction: Key Levels to Watch
With bearish pressure dominating higher and lower timeframes, Solana price prediction scenarios hinge on a narrow set of technical levels:
Immediate resistance:
Key supports:
$120–$118 remains the primary demand zone.
$112–$108 is the next downside liquidity pocket.
$101–$89 is the weekly macro support.
As long as the Solana price remains capped below $132, downside risk continues to outweigh upside potential. Bulls would need a decisive reclaim of $145+ to invalidate the bearish structures.
Final Thoughts
Solana price is no longer in a neutral zone; it is sitting at a technical inflection point under bearish control. Repeated failures near resistance, combined with weekly closes below the EMA200, suggest that sellers still dictate the broader trend.
Unless SOL can reclaim key resistance levels with conviction, Solana price prediction models favor further downside exploration, particularly if $120 fails to hold. For now, Solana remains in a defensive posture, with rallies viewed as reactive rather than trend-shifting.
Bitcoin price rally prediction: Crypto investment firm and index fund manager Bitwise said that Bitcoin price could climb to new all-time highs again in 2026, even though the cryptocurrency has struggled over the past two months, as per a report.
Bitcoin Price Forecast: BTC USD Could Hit New All-Time Highs in 2026
In its latest outlook, Bitwise predicts that Bitcoin will move beyond its current record of $126,080, which was set in early October, and break away from the traditional four-year cycle that has long shaped crypto market behavior, as per a Decrypt report.
Why Bitwise Says Bitcoin Will Break the Four-Year Market Cycle
Bitwise Chief Investment Officer Matt Hougan said that, “Bitcoin has historically moved in a four-year cycle, with three significant ‘up’ years followed by a sharp pullback year. According to this cycle, 2026 should be a pullback year,” as quoted by Decrypt.
He pointed out that, “We don’t see that happening,” adding, “In our view, the forces that previously drove four-year cycles—the Bitcoin halving, interest rate cycles, and crypto’s leverage-fueled booms and busts—are significantly weaker than they’ve been in past cycles,” as quoted in the report.
Institutional Adoption and Bitcoin ETFs Fuel Bullish Outlook
Bitwise also highlighted the steady flow of institutional money into crypto following the approval of Bitcoin exchange-traded funds, along with improving regulatory conditions, as key reasons Bitcoin could push to fresh highs.
Hougan added that, “We expect the combination of these factors will push Bitcoin to new all-time highs, relegating the four-year cycle to history’s dustbin,” as quoted by Decrypt.
Bitcoin Price Today
Bitcoin was recently trading around $87,800, up about 2% over the past 24 hours, but still more than 30% below its all-time high.
Bitcoin vs Stock Market: How BTC Has Performed Against Nasdaq and S&P 500
Despite reaching new highs earlier in 2025, Bitcoin is down nearly 18% over the past year, according to CoinGecko data. Over the same period, traditional stock markets have performed better, with the Nasdaq up 14.5% and the S&P 500 gaining 12%.
Bitcoin’s Correlation With Stocks Expected to Decline in 2026
Looking ahead, Bitwise expects Bitcoin’s correlation with equities to decline further in 2026, again citing regulatory progress and institutional adoption. The firm also predicts that Bitcoin, historically known for sharp price swings, will be less volatile than Nvidia, the world’s largest publicly traded company by market value, as per the report.
By combining the potential end of the four-year cycle with lower volatility and reduced correlation to stocks, Bitwise believes investors could benefit from what it described as a “trifecta” of strong returns, steadier price action, and diversification.
Ethereum and Solana Price Outlook Hinges on US CLARITY Act
The firm’s broader 2026 outlook includes several additional predictions. Bitwise expects crypto-related equities to outperform traditional tech stocks, believes that half of Ivy League endowments will make crypto investments, and forecasts new all-time highs for Ethereum and Solana, if the US CLARITY Act passes, as per the Decrypt report.
FAQs
What is Bitwise predicting for Bitcoin in 2026? Bitwise believes Bitcoin could reach new all-time highs in 2026.
How has Bitcoin performed compared to stocks over the past year? Bitcoin is down nearly 18%, while the Nasdaq and S&P 500 are both up.
Stronger external demand and a pickup in economic momentum will likely strengthen the yen. Rising yen demand supports a bearish USD/JPY trajectory in the lead-up to the BoJ’s monetary policy decision, with 153 in view.
While market bets on a December BoJ rate hike have strengthened the yen, US retail sales data will give insights into the US economy, triggering USD/JPY volatility.
US Retail Sales to Spotlight the Greenback
Later on Wednesday, US retail sales will fuel speculation about a March Fed rate cut, influencing the US dollar’s trajectory. Economists forecast retail sales to rise 0.3% month-on-month in November after stalling in October.
Stronger retail sales would boost the US economy, given that private consumption accounts for roughly 65% of the GDP. Additionally, consumer spending typically fuels demand-driven inflation, suggesting a more hawkish Fed rate path. Fading bets on a March Fed rate cut will likely lift US dollar demand, cushioning the near-term downside for USD/JPY.
Beyond the data, traders should monitor FOMC members’ speeches for reactions to November’s jobs report and the timeline for a rate cut. Fed Board of Governors Christopher Waller, New York Fed President John Williams, and Atlanta Fed President Raphael Bostic are due to speak mid-week. Support for further monetary policy easing would overshadow upbeat retail sales data, sending USD/JPY lower on weaker US dollar demand.
For context, US unemployment rose from 4.4% in October to 4.6% in November, while wage growth slowed from 3.7% YoY to 3.5% YoY in November. Rising unemployment and softer wage growth may curb consumer spending and dampen demand-driven inflation.
A cooler inflation outlook would support a more dovish Fed rate path and weaken US dollar demand.
According to the CME FedWatch Tool, the probability of a March Fed rate cut increased from 51% on December 15 to 53.3% on December 16 as markets reacted to the US jobs data. A BoJ rate hike and a March Fed rate cut would narrow the US-Japan rate differential, favoring the yen.
The BoJ and the Fed’s policy outlooks support a bearish short- to medium-term outlook for USD/JPY.
Technical Outlook: USD/JPY on a Downward Trajectory
With markets focused on monetary policy, technical indicators, and fundamentals, they will offer critical insights into potential USD/JPY price trends.
Looking at the daily chart, USD/JPY remained above the 50-day and 200-day Exponential Moving Averages (EMAs), signaling a bullish bias. While technicals remained bullish, fundamentals are increasingly outweighing the technical structure, suggesting a bearish outlook.
A break below the Tuesday, December 16, low of 154.394 would bring the 50-day EMA into play. If breached, 153 would be the next key support level. Importantly, a sustained drop below the 50-day EMA would signal a bearish near-term trend reversal, exposing the 200-day EMA and 150.
In Tokyo’s quiet season, the city slows to a simmer. Steam curls from teapots and kitchen windows, carrying whispers of charcoal, broth and roasted leaves. Hands cradle cups; laughter softens over wooden counters. Outside, cold air chills the streets, but inside, time stretches. At these restaurants, tradition isn’t just food, it’s rhythm: a pause, a pour, a shared silence before the next bite. The kind of comfort that lingers through centuries.
Marie Kondo minimalism meets the Japanese tea ceremony in a secluded Zen retreat. Sakurai Japanese Tea Experience is exactly that: an experience steeped in centuries of craft and quiet refinement. It’s an escape from reality, a time-warp portal disguised as a tea shop. How else could a single order of green tea last over an hour? In winter, the air feels warmer here, fragrant with the smoky, hypnotic scent of roasting leaves. The aroma drifts through the space, drawing you in from the cold. Choose your path: a winter course of gyokuro, blended teas, hojicha, matcha and sparkling tea. The staff present a wooden tray of five teas to smell, each carrying its own landscape of vibrant green fields, oven-roasted curls or cold dew on pine needles. If you hesitate, I’d nudge you toward Soufu Yamacha from Fukuoka, umami-rich and deeply soothing. The tea masters move with quiet precision, their white embroidered coats recalling a time when tea was medicine. From your counter seat, watch steam rise as she pours your first cup. “Drink slowly.”
Address: Spiral 5F 5-6-23 Minami Aoyama, Minato-ku 1-minute walk from Omotesando Station Instagram:@sakurai_tea_shop
¥¥¥ Toraya Akasaka Main Store
Photo by Matt Eisenhauer
Above the fan-shaped glass facade and dark gray titanium roof, a fierce kanji emblem reads tora, tiger, hinting at the legacy within. Step through ya-ra-to, the backward-facing noren curtain, where an ikebana display greets you beside an attentive receptionist. Soft classical music floats through the minimalist space. Five centuries of Japanese sweet-making unfold here, a modern shrine to wagashi craftsmanship. Behind glass, artisans dressed in white shape each delicate confection by hand as sunlight spills across hinoki-paneled walls and polished counters. Upstairs, an airy shop displays hanabira mochi and other New Year wagashi beside Toraya’s signature yokan jelly and smooth sweet-bean paste. Put your name down early for the third-floor tea hall. Even at peak hours, the wait is worth it. Order the Akasaka seasonal lunch, served with your choice of wagashi. Eighteen generations later, your number is called. Each gently sweet bite melts on your tongue, followed by a warm, earthy sip of tea that lingers like a kiss. The black lacquered tray catches the light of your smile.
Address:4-9-22 Akasaka, Minato-ku 7-minute walk from Akasaka-Mitsuke Station Instagram:@toraya.confectionery
¥¥¥ Mizutaki Genkai
Photo by bonchan
The blue-green glow of FamilyMart signs hums behind you as taxis slip through Shinjuku’s backstreets. Ahead stands a white three-story building, its exterior divided by inky black stripes like bold brushstrokes. A deep, lacquered red wraps the roofline and the lattice grates that frame the upper windows. At the entrance, a softly lit lantern bears the name Genkai, “mystic sea,” written in bold vertical script. Inside, warmth radiates from private tatami rooms where families and friends gather around steaming pots of mizutaki. Since 1928, Genkai has served this simple yet elegant chicken hot pot, its milky-white broth made with Date chicken from Fukushima and simmered through the founder’s original fukikoboshi “boil-over” method that draws out pure umami and collagen. A kimono-clad attendant quietly interrupts to add rice to the remaining broth. The stock deepens, richer now, with shared laughter and rising steam. After a long year, a meal like this reminds you what endures—and why you keep going.
Address:5-5-1 Shinjuku, Shinjuku-ku 4-minute walk from Shinjuku Gyoen-mae Station Instagram: @mizutaki_genkai_honten
¥¥ Eitaro Sohonpo
Photo from the E-Chaya Café
New Year in Tokyo feels hushed. The city empties as warm green tea fills porcelain cups and sweets rich with meaning take center stage. At Eitaro Sohonpo’s Nihonbashi flagship, history begins beneath your feet. The granite paving stones at the entrance remain unchanged since the shop opened here in 1857. To your right, the E-Chaya Café serves nadai kintsuba, an Edo-era azuki bean sweet grilled to order. A coffee set with sweet bean and butter toast offers a gentle comfort. Toward the back, glass cases display soft, seasonal mochifilled with koshi-an red-bean paste. Pick up an omiyage box of kuromitsu manju (available through December) or butter dorayaki before stepping back into the chilly, ginkgo-lined streets. Just as the New Year does each year, Eitaro bridges time, from Edo to Reiwa, tradition to innovation. Then, at that first chewy bite of mochi, you taste how the years have folded into now.
Address: 1-2-5 Nihonbashi, Chuo-ku 1-minute walk from Nihonbashi Station Instagram:@eitaro_sohonpo