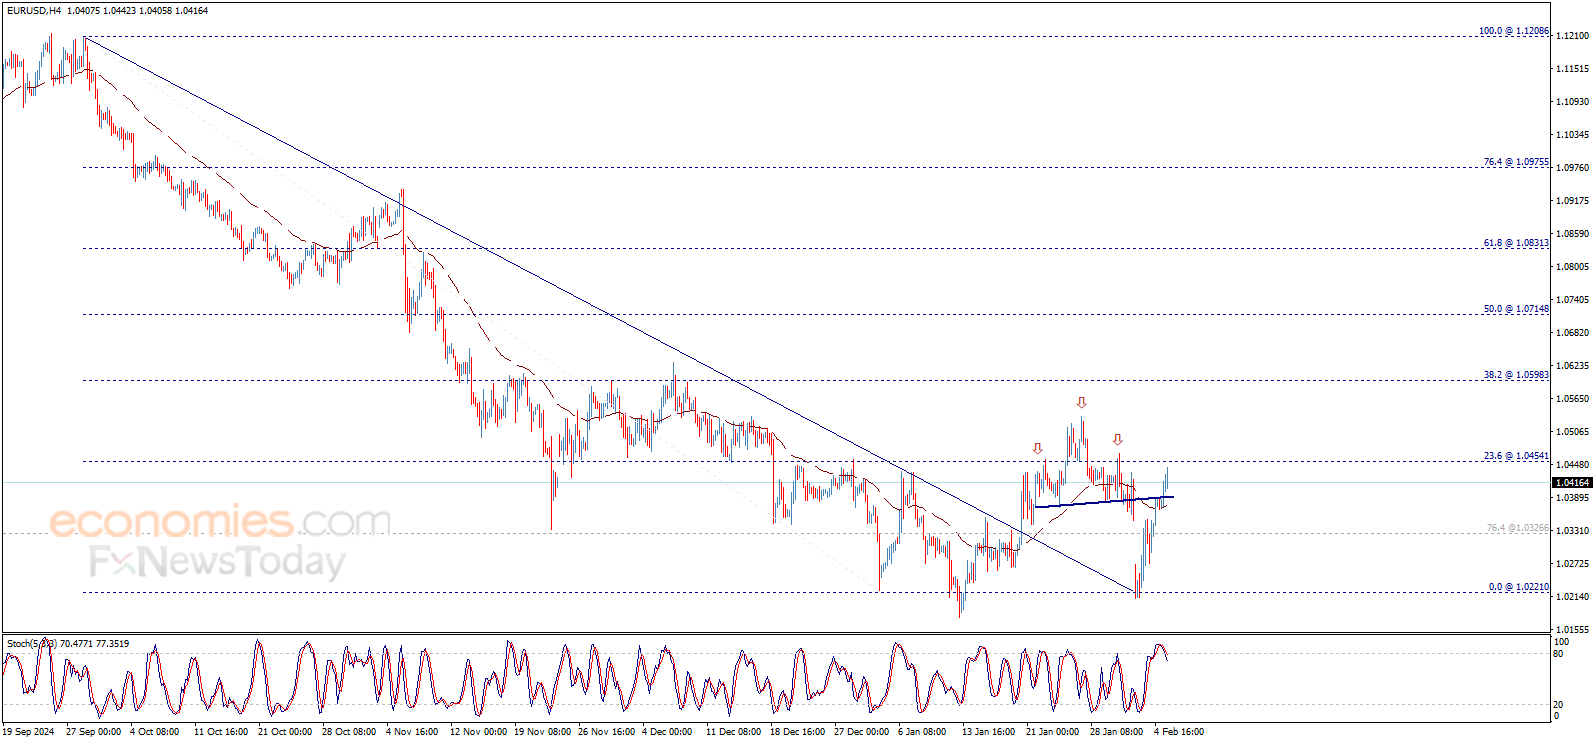
Ethereum price (ETHUSD) finds difficulty to hold above 2764.75$, to move below it now, noticing that stochastic gathers the positive momentum to support the chances to rise in the upcoming sessions and surpass the mentioned level again.
Therefore, we expect to witness positive trades today, and the price needs to breach 2764.75$ resistance to confirm heading towards 3017.30$ that represents our next main target, taking into consideration that failing to breach the mentioned resistance will put the price under additional negative pressure that its targets begin by testing 2480.00$ areas.
The expected trading range for today is between 2580.00$ support and 2890.00$ resistance.
High risk warning:
Foreign exchange trading carries a high level of risk that may not be suitable for all investors. Leverage creates additional risk and loss exposure. Before you decide to trade foreign exchange, carefully consider your investment objectives, experience level, and risk tolerance. You could lose some or all your initial investment; do not invest money that you cannot afford to lose. Educate yourself on the risks associated with foreign exchange trading and seek advice from an independent financial or tax advisor if you have any questions.
Advisory warning:
FOREXLIVE™ is not an investment advisor, FOREXLIVE™ provides references and links to selected news, blogs and other sources of economic and market information for informational purposes and as an educational service to its clients and prospects and does not endorse the opinions or recommendations of the blogs or other sources of information. Clients and prospects are advised to carefully consider the opinions and analysis offered in the blogs or other information sources in the context of the client or prospect’s individual analysis and decision making. None of the blogs or other sources of information is to be considered as constituting a track record. Past performance is no guarantee of future results and FOREXLIVE™ specifically hereby acknowledges clients and prospects to carefully review all claims and representations made by advisors, bloggers, money managers and system vendors before investing any funds or opening an account with any Forex dealer. Any news, opinions, research, data, or other information contained within this website is provided on an “as-is” basis as a general market commentary and does not constitute investment or trading advice, and we do not purport to present the entire relevant or available public information with respect to a specific market or security. FOREXLIVE™ expressly disclaims any liability for any lost principal or profits which may arise directly or indirectly from the use of or reliance on such information, or with respect to any of the content presented within its website, nor its editorial choices.
Disclaimer:
FOREXLIVE™ may be compensated by the advertisers that appear on the website, based on your interaction with the advertisements or advertisers.
usatoday.com wants to ensure the best experience for all of our readers, so we built our site to take advantage of the latest technology, making it faster and easier to use.
Unfortunately, your browser is not supported. Please download one of these browsers for the best experience on usatoday.com
Currently, you are using a shared account. To use individual functions (e.g., mark statistics as favourites, set
statistic alerts) please log in with your personal account.
If you are an admin, please authenticate by logging in again.
Other statistics that may interest you Cryptocurrencies
Overview
3
Users
3
Market cap
5
Exchanges
7
Trading
6
Purchasing
4
Adoption
3
Wallets
4
Energy
3
Fraud
5
Payments
7
Further related statistics
10
* For commercial use only
Based on your interests
Free Statistics
Premium Statistics
Free + Premium Statistics
Reports
Market Insights
Learn more about how Statista can support your business.
CoinGecko. (February 5, 2025). Binance Coin (BNB) price per day from May 11, 2022 to February 3, 2025 (in U.S. dollars) [Graph]. In Statista. Retrieved February 06, 2025, from https://www.statista.com/statistics/1274339/binance-coin-price-index/?__sso_cookie_checker=failed
CoinGecko. “Binance Coin (BNB) price per day from May 11, 2022 to February 3, 2025 (in U.S. dollars).” Chart. February 5, 2025. Statista. Accessed February 06, 2025. https://www.statista.com/statistics/1274339/binance-coin-price-index/?__sso_cookie_checker=failed
CoinGecko. (2025). Binance Coin (BNB) price per day from May 11, 2022 to February 3, 2025 (in U.S. dollars). Statista. Statista Inc.. Accessed: February 06, 2025. https://www.statista.com/statistics/1274339/binance-coin-price-index/?__sso_cookie_checker=failed
CoinGecko. “Binance Coin (Bnb) Price per Day from May 11, 2022 to February 3, 2025 (in U.S. Dollars).” Statista, Statista Inc., 5 Feb 2025, https://www.statista.com/statistics/1274339/binance-coin-price-index/?__sso_cookie_checker=failed
CoinGecko, Binance Coin (BNB) price per day from May 11, 2022 to February 3, 2025 (in U.S. dollars) Statista, https://www.statista.com/statistics/1274339/binance-coin-price-index/?__sso_cookie_checker=failed (last visited February 06, 2025)
Binance Coin (BNB) price per day from May 11, 2022 to February 3, 2025 (in U.S. dollars) [Graph], CoinGecko, February 5, 2025. [Online]. Available: https://www.statista.com/statistics/1274339/binance-coin-price-index/?__sso_cookie_checker=failed
United States data showed services output grew at a slower-than-anticipated pace in January.
Financial markets slowly moved away from panic selling, concerns remain in the background.
XAU/USD is bullish while overbought, speculative interest aims for $2,900.
Spot Gold’s rally to record highs continued on Wednesday, with XAU/USD trading as high as $2,882.34 during American trading hours. As it has been happening these days, demand for safety prevails amid mounting concerns related to United States (US) President Donald Trump’s tariffs. At the same time, the US Dollar (USD) has lost its attractiveness, with stock markets recovering and investors digesting the latest US data.
The latest US macroeconomic figures showed a solid labor market and softer-than-anticipated economic progress. On the one hand, the ADP Employment Change report showed that the private sector added 183,000 new jobs in January, better than the 150,000 anticipated by market players and above the 122,000 gained in December.
On the other hand, the January ISM Services Purchasing Managers’ Index (PMI) rose by 52.8, below the 54 posted in December and the expected 54.3. Other details of the report showed that the Prices Paid Index, the inflation component, dropped to 60.4 from 64.4, while the Employment Index edged higher to 52.3 from 51.3.
Meanwhile, Wall Street struggles to extend its recent recovery. Most Asian and European indexes closed in the green, but among US indexes, only the Dow Jones Industrial Average (DJIA) is up.
XAU/USD short-term technical outlook
From a technical point of view, the daily chart for XAU/USD shows that the bullish momentum prevails despite overbought conditions, as technical indicators keep aiming north despite developing at extreme levels. At the same time, the pair advanced further above bullish moving averages, with the 20 Simple Moving Average (SMA) heading sharply higher at around $2,750.
In the near term, and according to the 4-hour chart, the risk skews to the upside. Technical indicators have resumed their advances within overbought levels and after a limited retracement, suggesting buyers are still willing to add on dips. Finally, XAU/USD develops far above all bullish moving averages, with the shorter 20 SMA at around $2,825.
Support levels: 2,857.80 2,845.30 2,829.10
Resistance levels: 2,883.00 2,900.00 2,915.00
Tariffs FAQs
Tariffs are customs duties levied on certain merchandise imports or a category of products. Tariffs are designed to help local producers and manufacturers be more competitive in the market by providing a price advantage over similar goods that can be imported. Tariffs are widely used as tools of protectionism, along with trade barriers and import quotas.
Although tariffs and taxes both generate government revenue to fund public goods and services, they have several distinctions. Tariffs are prepaid at the port of entry, while taxes are paid at the time of purchase. Taxes are imposed on individual taxpayers and businesses, while tariffs are paid by importers.
There are two schools of thought among economists regarding the usage of tariffs. While some argue that tariffs are necessary to protect domestic industries and address trade imbalances, others see them as a harmful tool that could potentially drive prices higher over the long term and lead to a damaging trade war by encouraging tit-for-tat tariffs.
During the run-up to the presidential election in November 2024, Donald Trump made it clear that he intends to use tariffs to support the US economy and American producers. In 2024, Mexico, China and Canada accounted for 42% of total US imports. In this period, Mexico stood out as the top exporter with $466.6 billion, according to the US Census Bureau. Hence, Trump wants to focus on these three nations when imposing tariffs. He also plans to use the revenue generated through tariffs to lower personal income taxes.
Japan is shifting focus from sencha to tencha, driven by global demand for matcha’s flavor and health benefits.
The Ministry of Agriculture plans to incentivize tencha farming by 2025, enhancing Japan’s tea industry productivity.
Matcha cultivation promotes sustainability through soil vitality and biodiversity improvements.
Social media platforms are showcasing matcha’s appeal, highlighting Japan’s cultural richness and culinary innovation.
This movement intertwines Japanese tradition with modern sustainability, promising economic growth and global culinary influence.
Japan is diving headfirst into a tea transformation, swapping the familiar greens of sencha for the spotlight-stealing tencha, the very essence of matcha. This shift is no mere leaf-turning; it’s a response to a global wave of demand for this vibrant green wonder. As health-conscious consumers from Europe to the US pour over Japanese green teas, tencha becomes the hero plants with its unrivaled flavor and health-boosting properties.
The plot thickens as Japan’s Ministry of Agriculture gears up to roll out financial perks by 2025, empowering farmers to embrace this leafy evolution and keeping Japan’s tea prowess at full throttle on the global stage. But it’s not just about the bottom line. The magic of matcha is also a masterstroke of sustainability—shading methods enhance soil vitality and biodiversity, promising greener practices in every sense.
Meanwhile, Japan’s digital maestros are orchestrating a social media tsunami. Platforms like Instagram teems with frothy lattes and colorful cuisine, captivating thousands with matcha magic and weaving tales of cultural richness into every post. The world is abuzz with matcha mania, and Japan is at the helm, steering this cultural and culinary renaissance.
This bold move doesn’t only promise economic flourishing; it also intertwines tradition with cutting-edge innovation. As Japan redefines its tea tale, blending age-old customs with modern sustainability, the world watches, waits, and sips, ready for this new legacy to steep into the annals of global gastronomy. Keep your eyes (and cups) ready for the next wave of delightful discoveries.
Japan’s Tea Transformation: How Tencha is Redefining Global Tea Culture
How is Japan’s tea transformation impacting the global market?
Japan’s emphasis on matcha, specifically tencha, is reshaping the global tea market. The demand for matcha has seen a significant increase, particularly among health-conscious consumers in Europe and the US seeking its touted health benefits, such as high antioxidant content and metabolism-boosting properties.
The shift to matcha production from sencha is driven by the lucrative international market. Farmers supported by the Japanese government and subsidies are increasingly converting their crops to tencha to meet this global demand. The rise of matcha has led to innovative new product offerings, including matcha-infused beverages, desserts, and beauty products. These innovations not only cater to existing matcha lovers but also attract new consumers, broadening the market scope.
What role does sustainability play in Japan’s tea farming evolution?
Sustainability is a crucial component of Japan’s transformation from sencha to tencha production. The matcha cultivation process, particularly the shading methods used in tencha farming, enhances soil health and promotes biodiversity. These practices align with global demands for environmentally friendly and sustainable agriculture.
By adopting more sustainable growing practices, Japan not only reinforces its position as a leader in premium green tea production but also contributes to broader environmental goals. The government’s strategy includes financial support and incentives for farmers to adopt these practices, ensuring the longevity and sustainability of the industry.
What innovations are being developed in the matcha market?
Innovation within the matcha market extends beyond traditional tea consumption. Brands and companies are leveraging matcha’s vibrant color, unique flavor, and health benefits by integrating it into various products. This includes matcha-based snacks, energy bars, smoothies, and even cosmetics, tapping into new lifestyle and wellness trends.
Additionally, digital platforms like Instagram play a significant role in popularizing these innovations. The social media buzz, fueled by visually appealing matcha lattes and colorful culinary creations, continuously sparks consumer interest and contributes to global matcha mania. Such digital engagement ensures matcha remains a trendy and relevant product in various consumer sectors.
Japan’s move to embrace and promote tencha as the face of its tea industry is driven by global demand and sustainability needs. This transformation is not only reshaping the global tea landscape but also sparking innovation and digital engagement that enhances its cultural significance on a global scale. With these efforts, Japan ensures its tea legacy persists in a modern, environmentally conscious world.
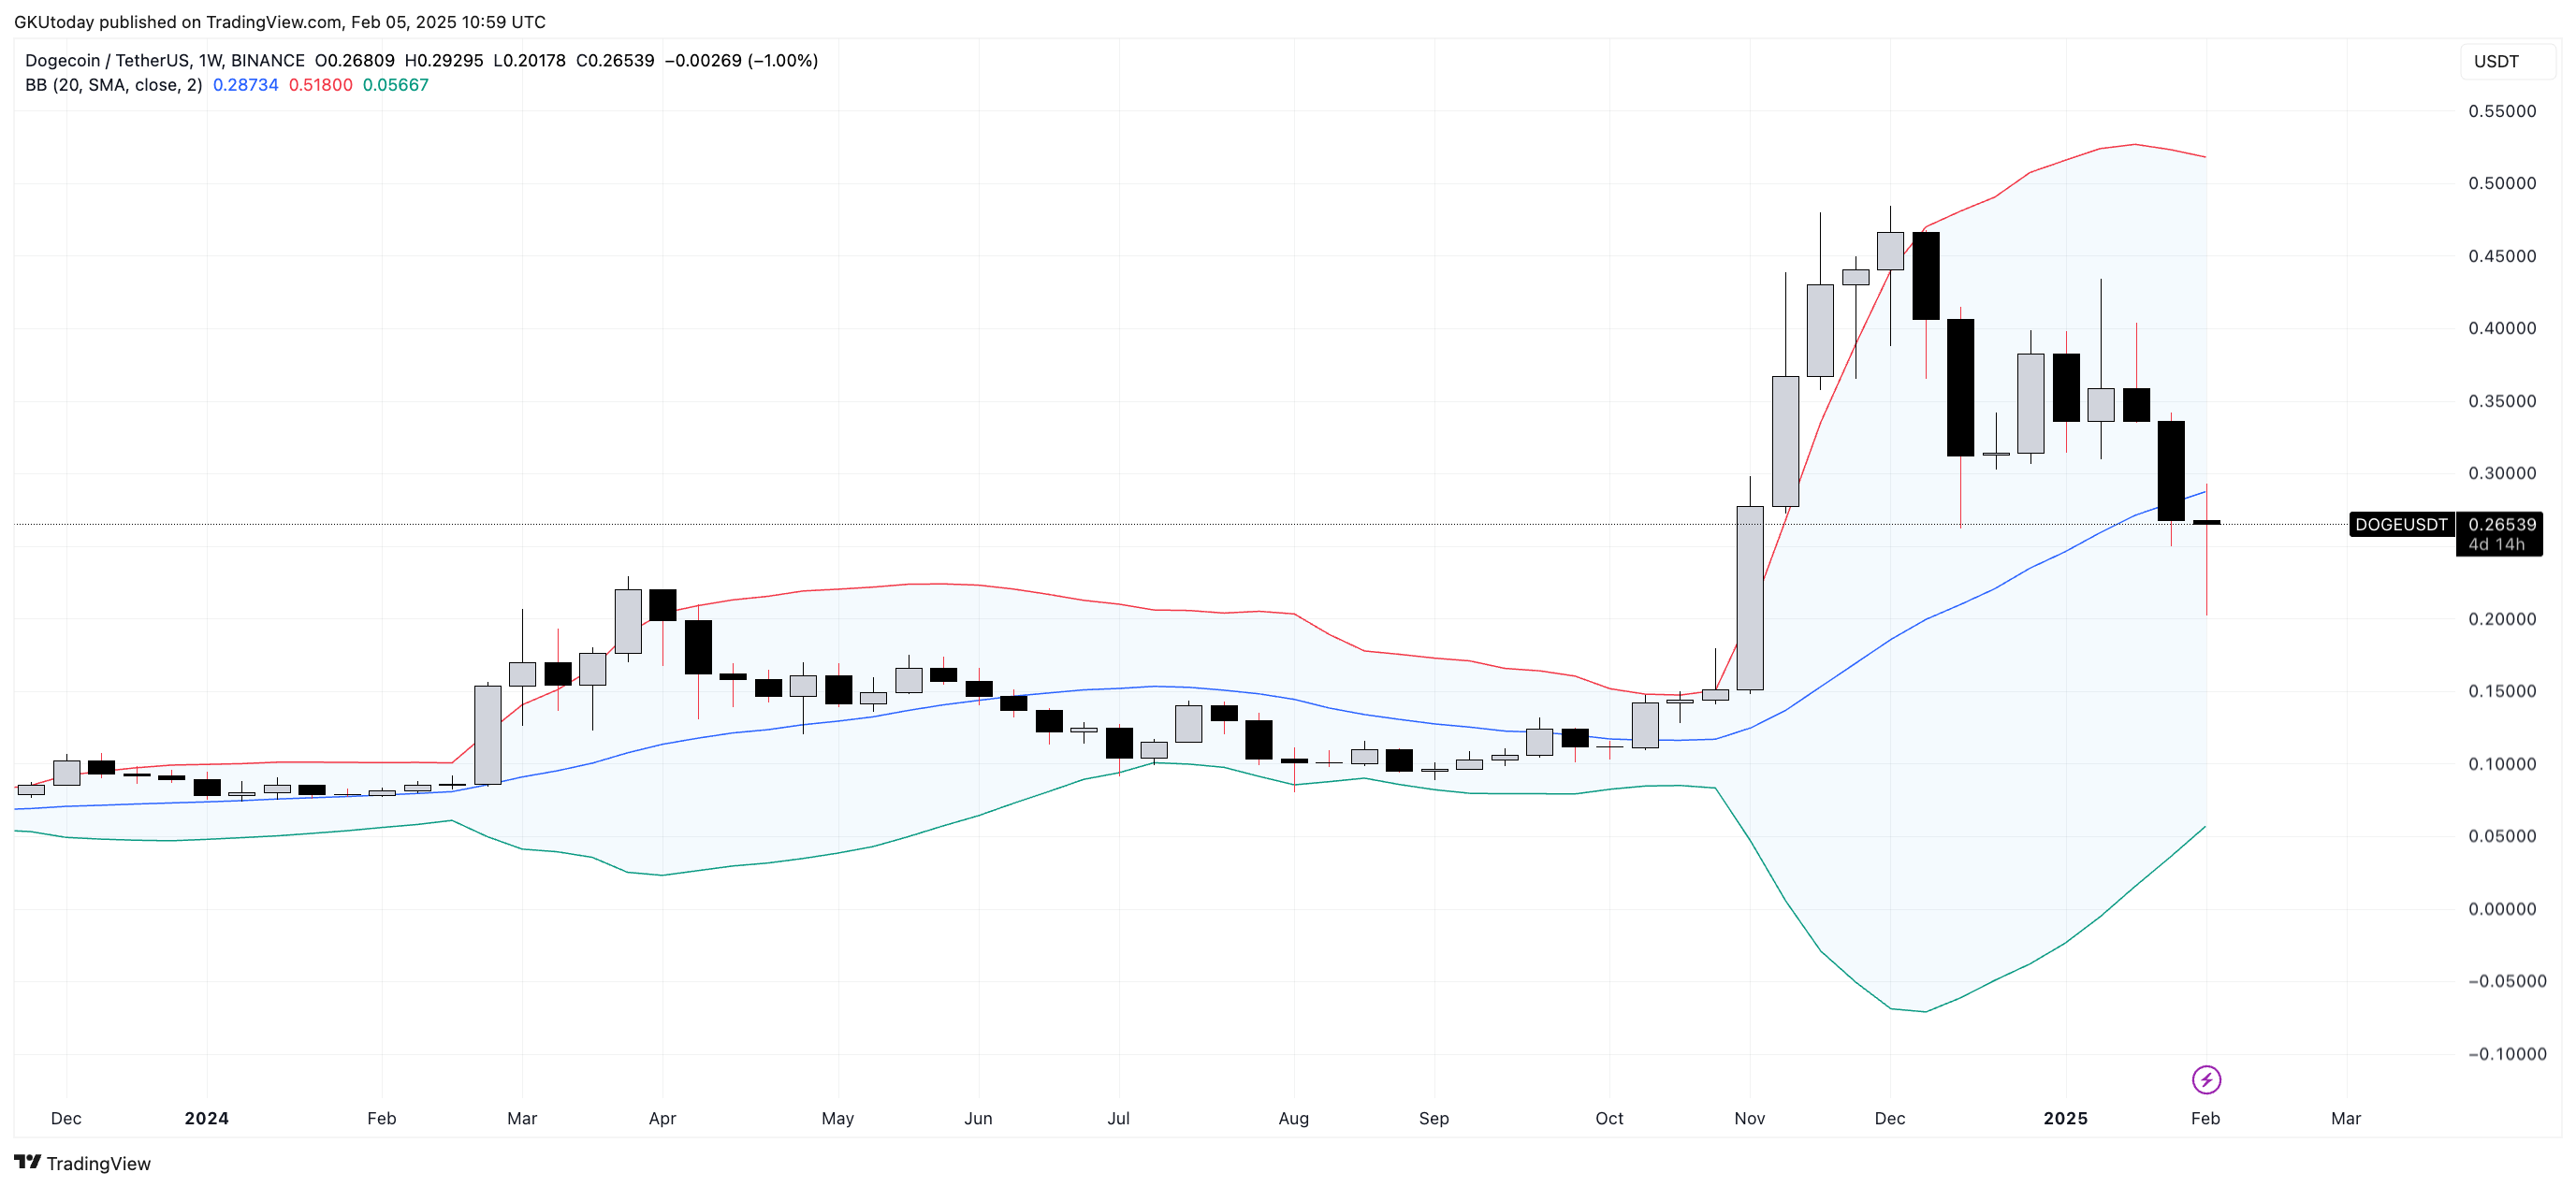
Probably the most popular meme cryptocurrency in the world, Dogecoin (DOGE), is facing a crash that most will not be able to handle. We are talking about the price performance of DOGE, when Bollinger Bands signal a possibility of a 80% drawdown for the meme coin.
The Bollinger Bands, developed by John Bollinger, consist of three curves – the median and two deviations above and below it. Together they form a range movement within which traders can identify the trend and extremes for the price of the asset. The median itself is represented by a 20-day moving average. When the price hits an upper band, it can signal that the asset is overbought, and when it hits the lower band, the price is in oversold territory.
Related
The thing with DOGE is that on the weekly time frame, the price has fallen below the median, with the indicator at $0.28735 and the meme coin trading at $0.265. Such conditions make Dogecoin more vulnerable to the lower band, which is currently stretched around the $0.057 zone.
If the price of the meme coin closes the week below the median, it may indicate a lack of purchasing power and pull Dogecoin closer to the lower band to test buyers there.
On the other hand
The possibility of Dogecoin reaching the $0.06 zone is not short term, and everything can change within weeks. However, as things stand now, the probability of such a development is higher than the probability of a rise to the upper levels from the recent ones.
Related
While not set in stone like everything else on the crypto market, the Bollinger Bands indicate weakness for Dogecoin, and therefore, another medium-term decline is the main scenario right now, with an 80% crash to $0.057 serving as the ultimate and most grim outcome for the beloved meme cryptocurrency.
NAIROBI (CoinChapter.com) — The crypto market is showing signs of renewed momentum, with XRP, TRON (TRX), and Shiba Inu (SHIB) gaining attention amid price rebounds, shifting market sentiment, and increased adoption.
XRP Eyes $6 as Analysts Predict Bullish Surge
XRP’s price saw a 6% surge today as broader market confidence returned following a recent downturn. Analysts remain optimistic about its trajectory, with Dark Defender predicting a potential climb to $6 based on XRP’s current wave cycle. His projections suggest that XRP could hit $5.85 if historical trends persist.
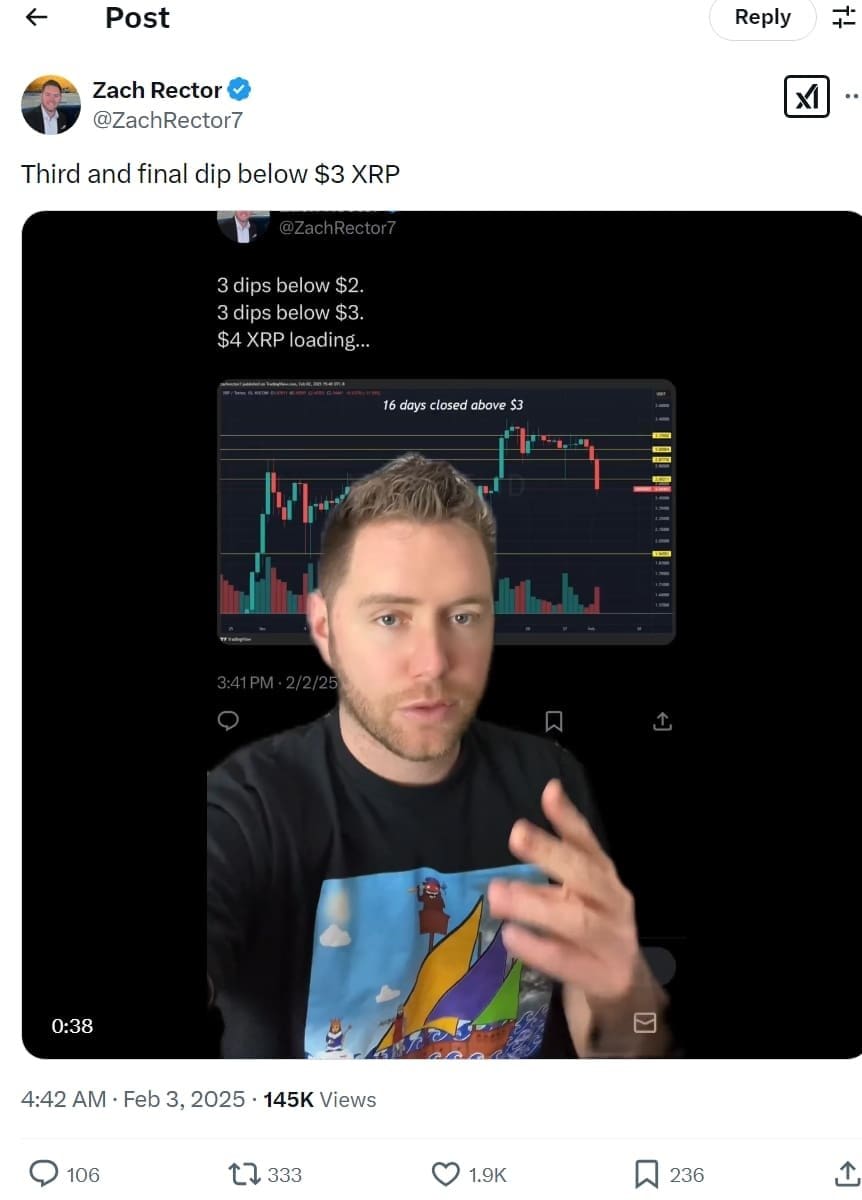
Meanwhile, EGRAG CRYPTO supports this bullish outlook, highlighting an alignment with past market cycles that could push XRP toward $5.2. Other market watchers, including Zach Rector, view the recent dip as a precursor to a rally, with projections for XRP exceeding $4 in the coming weeks.
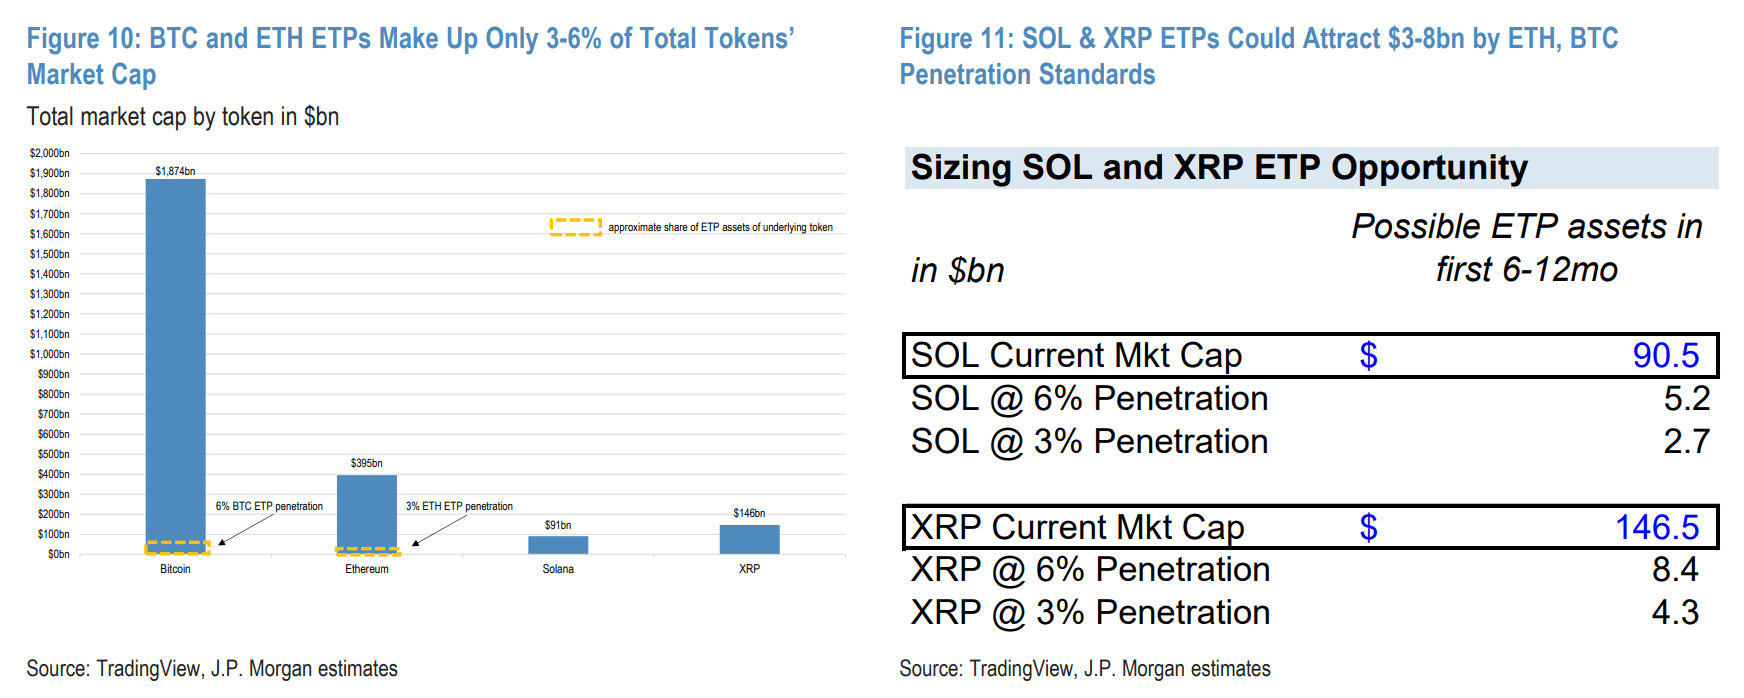
Another factor driving speculation is the growing number of exchange-traded fund (ETF) applications tied to XRP. Currently, the U.S. Securities and Exchange Commission (SEC) is reviewing nine such applications from major asset managers, including Bitwise, WisdomTree, Grayscale, and CoinShares.
SOL and XRP ETPs could attract $3–8 billion. Source: JP Morgan
Analysts at JPMorgan estimate that an approved XRP ETF could bring in $4 billion to $8 billion in new capital within six months, potentially driving XRP’s price higher.
TRON Expands Dominance in Stablecoins and DeFi
TRON has solidified its position as a leading blockchain network for stablecoin transactions and decentralized applications. While its number of monthly active addresses remained stable in 2024, transaction activity has shifted towards decentralized platforms.
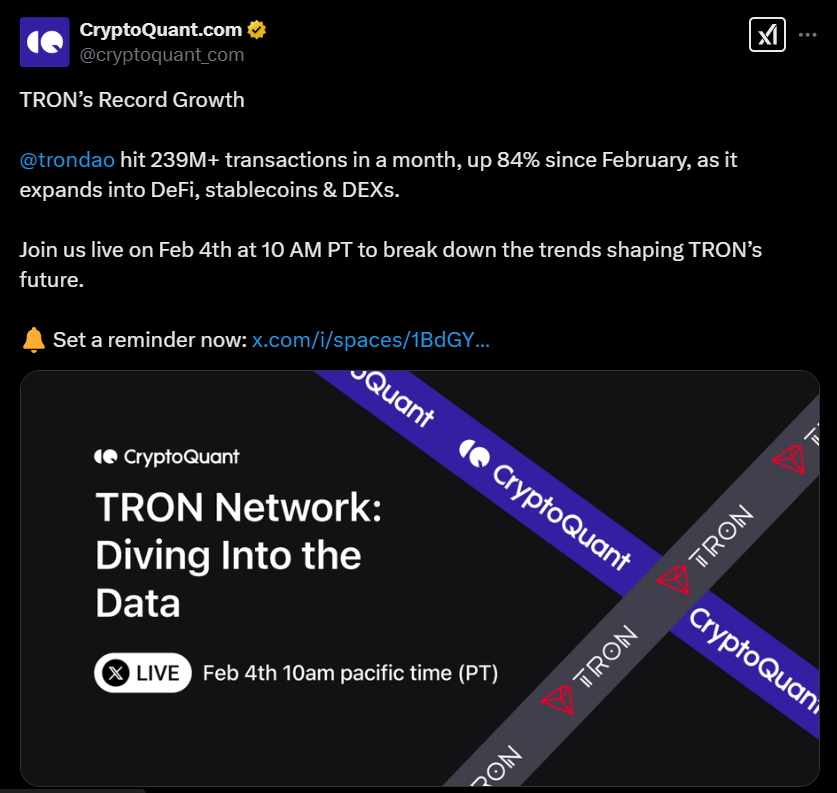
Data shows that TRON processed over 239 million transactions last month, primarily driven by DeFi adoption and stablecoin usage. The blockchain has also attracted growing interest from Latin American financial platforms, particularly Eldorado, which saw a fourfold increase in transaction volume in 2024.
TRON hits 239M+ transactions, up 84% YoY. Source: CryptoQuant
The shift toward decentralized platforms has been a key driver of TRON’s growth. Investors are increasingly engaging with TRON-based decentralized exchanges (DEXs) rather than centralized platforms. Total Value Locked (TVL) on these DEXs has been rising, indicating growing confidence in TRON’s ecosystem.
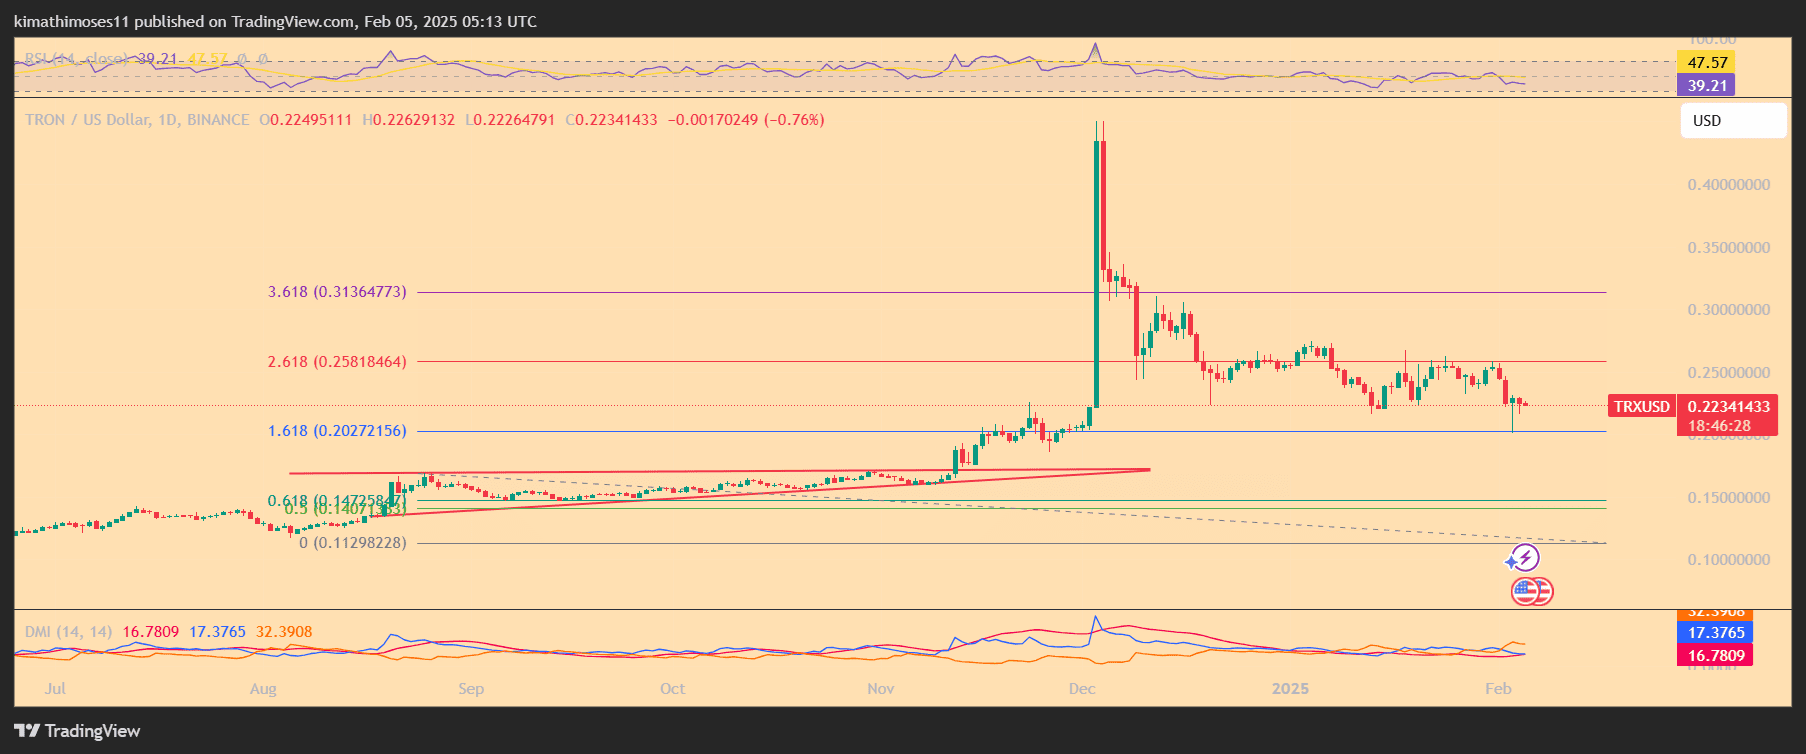
TRX is trading at $0.223, facing resistance at $0.258, which aligns with the 2.618 Fibonacci extension level. A breakout above this zone could push prices toward $0.313. However, failure to break through may lead to consolidation near $0.202, the 1.618 Fibonacci level.
The Relative Strength Index (RSI) hovers around 47, showing a neutral market, while the Directional Movement Index (DMI) signals that sellers currently have the upper hand.
SHIB Sees Whales Accumulating Amid Market Turbulence
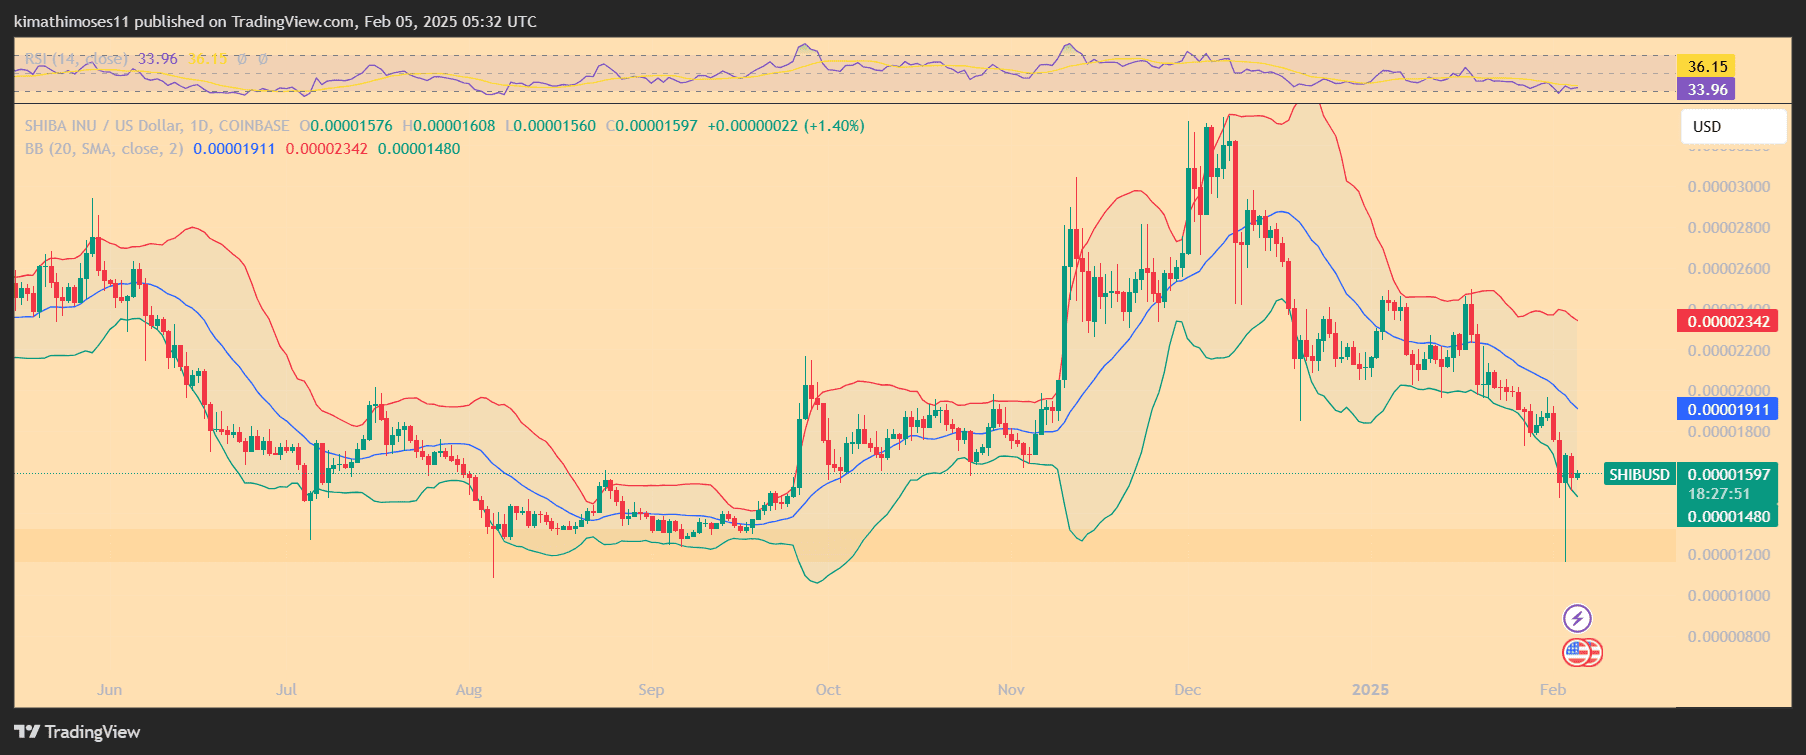
Shiba Inu (SHIB) has shown mixed performance, with a recent 2% price increase following a partnership with the United Arab Emirates Ministry of Energy and Infrastructure (MOEI). However, SHIB’s price remains volatile, having lost 30% of its value in the past month. Despite this, large-scale investors—Shiba Inu whales—have been actively accumulating the token.
Shiba Inu Large Transactions vs. SHIB price. IntoTheBlock
Meanwhile, on-chain data has revealed an unprecedented surge in SHIB whale activity. In the past 24 hours alone, large-scale investors transferred 15.1 trillion SHIB, valued at approximately $253.05 million. This follows an earlier 4.3 trillion SHIB transfer, marking a rapid increase in whale accumulation.
Despite the broader crypto market downturn, large SHIB holders have increased their positions by 553.59% in the past week.
XRP, TRON, and SHIB are navigating a volatile crypto landscape, each with unique catalysts driving market sentiment. XRP’s potential rally hinges on bullish forecasts and ETF speculation, while TRON continues to gain traction in DeFi and stablecoins. SHIB remains in focus due to whale accumulation and a strategic partnership in the United Arab Emirates.
Short-term resistance is at today’s high of $3.37 and support was at the low of the day, at $3.16. Despite the minor bullish indication from today’s price action, further consolidation within the day’s range is also possible. If the low of the day is broken to the downside, there is the possibility of a gap filling at $3.12. A rising trendline can also be watched for signs of support if recent lows are retested.
It is interesting to note that this week’s low, that was hit today, successfully found support around the 20-Week MA (not shown), which is $3.15. Notably, natural gas fell below the 20-Week MA last week and closed below it on a weekly basis. That was bearish price behavior. But the reclaim of the 20-Week line this week countered with bullish indications.
Weekly Bullish Sign
Therefore, support around $3.15 needs to continue to hold to confirm the bullish posture. Staying above the 20-Week line will provide another piece of bullish evidence, increasing the chance for a continuation of the bounce from last week’s low of $2.99. Regardless, natural gas is likely to complete this week as an inside week given last week’s wide trading range from $2.99 to $3.83.
Next Up is $3.51 Price Zone
A decisive breakout above Wednesday’s high of $3.37 points to higher targets for natural gas. The 50-Day MA at $3.52 is the next upside target where resistance may be seen. It is confirmed by the 38.2% Fibonacci retracement at $3.51. Since the 50-Day line had been dynamic support for the rising trend previously, until last Tuesday, there is a strong chance it will be tested as resistance at a minimum.
For a look at all of today’s economic events, check out our economic calendar.
WLD currency price (WLDUSD) fell in the intraday levels, amid the dominance of the main downward trend in the medium term, while trading alongside the secondary short-term trend line, with negative pressure due to trading below the 50-day SMA, as the price readies to pierce the pivotal support of$1.28587183 with negative signals from the RSI despite reaching oversold levels.
Therefore we expect more losses for the price, provided the aforementioned support of $1.28587183 was reliably breached, thus targeting the support of $0.49942978.







 Shiba Inu Large Transactions vs. SHIB price.