About Editorial team of BIPNs

Main team of content of bipns.com. Any type of content should be approved by us.
16 01, 2025

The USDJPY price under the negative pressure – Forecast today

By |2025-01-16T06:11:09+02:00January 16, 2025|Forex News, News|0 Comments

Energy Markets Experienced a Strong Start at the Beginning of 2025

Energy markets experienced a strong start at the beginning of 2025, with global oil prices jumping to their highest levels in five months, registering a notable increase of an average of 10%.

This significant rise was driven by growing concerns over the potential reduction of Russian crude oil supplies to the global market, especially after the United States imposed a new round of sanctions on Russia’s energy sector.

Additionally, rising expectations of improved global demand, particularly with the strong economic growth led by the United States alongside intensive measures to stimulate the Chinese economy, contributed to this surge.

Recent decisions by the OPEC+ alliance also played a crucial role in determining the price trajectory, as an extension of production restrictions was announced to better balance supply and demand in the market.

On the other hand, geopolitical tensions in some oil-producing regions have heightened concerns among traders about supply stability. This has led to increased insurance costs for shipments, which in turn has impacted prices.

Furthermore, the decline in U.S. inventories has boosted optimism about market recovery, with recent data showing a significant drop in commercial stocks.

In light of these developments, energy experts expect the positive momentum of oil prices to continue during the first quarter of the year, with expectations of further increases if current conditions persist. However, the market remains sensitive to any sudden changes that might affect supply or demand.

This report details the main reasons behind the surge in oil prices, with a comprehensive analysis of future trends that may determine the market’s path in the coming months.

Price Outlook

  • Since the beginning of 2025, the price of U.S. crude oil has risen by more than 10%, reaching its highest level in five months at $79.19 per barrel during trading on January 13.
  • Brent crude oil prices increased by 9.25%, reaching $81.64 per barrel on January 13, the highest level since August 2024.

US Sanctions on Russia

On January 10, 2025, the United States imposed a new package of sanctions on Russia’s energy sector, targeting major companies such as “Gazprom Neft” and “Surgutneftegaz,” in addition to over 180 oil tankers.

These measures aim to reduce Russia’s revenues from oil and gas exports, as part of ongoing efforts to pressure Moscow due to the ongoing war in Ukraine.

Details of the Sanctions

  • Targeted Companies: The sanctions include “Gazprom Neft” and “Surgutneftegaz,” two of Russia’s largest oil producers.
  • Oil Tankers: Approximately 183 ships were listed in the sanctions, hindering their ability to transport Russian oil to global markets.

Reactions

  • The Kremlin: Kremlin spokesperson Dmitry Peskov expressed concern that these sanctions could destabilize global energy markets, emphasizing that such decisions do not contribute to market stability.
  • International Analysts: Energy experts indicated that these sanctions could increase pressures on global oil markets, leading to higher prices and supply fluctuations.

Potential Impact

These sanctions are expected to affect Russia’s ability to export oil and gas, potentially reducing its revenues from the energy sector. They may also cause disruptions in global energy markets, given Russia’s prominent role as a major source of oil and gas.

Top Russian Crude Oil Importers

In 2024, India and China emerged as the largest importers of Russian crude oil, benefiting from competitive prices and discounts offered by Moscow amidst Western sanctions.

India

  • Import Volume: India imported approximately 1.64 million barrels per day of Russian oil during the 2023-2024 fiscal year, representing a 57% increase compared to the previous year.
  • Share of Total Imports: Russian oil accounted for about 35% of India’s total crude imports, compared to 22% in the previous year.
  • Impact on Other Sources: This shift led to a decrease in the Middle East oil share in India’s imports to 46%, the lowest level ever.

China

  • Import Volume: China’s imports of Russian oil increased by 17% since the beginning of 2024, reaching 37.79 million tons, equivalent to approximately 2.28 million barrels per day.
  • Share of Total Imports: Russian oil constituted about 22% of China’s total crude imports, compared to 18% in the previous year, reflecting increased reliance on Russian oil due to competitive prices.
  • Impact on Other Sources: This shift resulted in a reduction in the share of traditional suppliers, such as Saudi Arabia, whose exports to China declined by 8% compared to the previous year.
  • It also affected oil imports from the United States and Africa, as China preferred Russian oil due to its lower cost and the favorable payment terms offered by Moscow.

Turkey

  • Share of Imports: Turkey accounted for about 7% of Russia’s total crude oil exports from December 2022 to December 2024.

European Union

  • Share of Imports: Despite the sanctions, the European Union imported about 6% of Russia’s total crude oil exports during the same period.

This shift in oil flows reflects a reshaping of the global energy map, as Russia seeks to strengthen its relations with Asian countries to overcome the impact of Western sanctions, while countries like India and China benefit from opportunities to obtain oil at discounted prices.

Opinions and Analyses on the Sanctions

Traders and analysts have stated that Russian oil exports will be severely affected by the new sanctions, pushing China and India to obtain more crude from the Middle East, Africa, and the Americas, which will drive up prices and shipping costs.

  • Analyst at BVM “Tamas Farga”: There are real concerns in the market about supply disruptions from Russia. It seems that the worst-case scenario for Russian oil could become a reality.
  • Farga added: However, it is unclear what will happen when “Donald Trump” takes office next week. Farga clarified that the sanctions include a cooling-off period until March 12, so there may not be significant disruptions until now.
  • Goldman Sachs estimates: The ships targeted by the new sanctions transported 1.7 million barrels per day of oil in 2024, or 25% of Russia’s exports.
  • Analysts wrote in a memo: Goldman Sachs: It is increasingly likely that its Brent range forecast between $70 and $85 per barrel will lean upwards.
  • Analysts at RBC Capital Markets: Doubling the number of tankers sanctioned to transport Russian barrels could pose a significant logistical problem affecting crude oil flows.
  • Head of Research at Onix Capital Group “Harry Chelengiorian”: The latest round of sanctions by the U.S. Office of Foreign Assets Control targeting Russian oil companies and a large number of tankers will have particularly severe consequences for India.
  • Analysts at JP Morgan: Russia has some room to maneuver despite the new sanctions, but it will ultimately need to acquire unsanctioned tankers or offer crude at $60 per barrel or less to use Western insurance as stipulated in the Western price cap.
  • Market Strategist at IG “Yap Jon Rong”: The main headlines surrounding Russian oil sanctions have been the dominant driver of oil prices recently, coupled with resilient U.S. economic data, witnessing tighter supply and demand dynamics some momentum.
  • Rong added: With prices rising rapidly and sharply by about 10% since the beginning of the year, it is driving profit-taking activity with some risks emerging around upcoming U.S. inflation data releases.
  • Analysts at ING in a memo: These sanctions have the potential to pull up to 700,000 barrels per day from the market’s supply, which would erase the surplus we expect this year.
  • Analysts added: However, the actual decline in flows is likely to be less, as Russia and buyers find ways to circumvent these sanctions, and it is clear there will be more pressure on unsanctioned ships within the shadow fleet.
  • Philip Jones Lux from Sparta Commodities: The new sanctions on Russian tankers are expected to affect crude supplies to China and India, although the main players in these countries are still assessing the legal situation and possible solutions.

Extension of OPEC+ Production Cuts

In December last year, the OPEC+ alliance announced an extension of oil production cuts by two million barrels per day for an additional year, until the end of 2026 instead of 2025, as part of its ongoing efforts to support the stability of global oil markets and enhance the balance between supply and demand.

Additionally, the eight countries contributing to the voluntary oil production cuts, amounting to 2.2 million barrels per day, decided to extend the timeline for lifting these cuts by an additional three months, so they end at the end of March 2025 instead of the previous deadline at the end of the current December.

OPEC+ members are currently implementing production cuts totaling 5.9 million barrels per day, equivalent to about 5.7% of global demand.

  • Included Cuts: Two million barrels per day from OPEC+ members continue until the end of 2026 after the latest decision.
  • Contributed by 9 Member Countries: (Saudi Arabia, UAE, Iraq, Kuwait, Kazakhstan, Algeria, Oman, Gabon, and Russia) reducing production by 1.7 million barrels per day, ending by the end of 2025.
  • Additional Voluntary Cuts: Eight countries (Saudi Arabia, Russia, UAE, Kuwait, Algeria, Oman, Iraq, and Kazakhstan) agreed to implement additional voluntary production cuts amounting to 2.2 million barrels per day, to end by the end of March 2025.

Harsh Weather and Global Demand

Harsh weather in Europe and the United States has had a notable impact on oil markets recently, as unusual weather conditions have contributed to increased demand for fuel and higher prices. The main impacts are as follows:

  1. Increased Demand for Heating Fuel: A sharp drop in temperatures in Europe and the United States has led to increased consumption of heating fuels, such as diesel and heating oil. This rise in demand for refined products has put pressure on refineries and increased crude oil prices, the primary source of these products.
  2. Production and Transportation Disruptions: In the United States, snowstorms and ice have led to the closure of some oil fields, particularly in major production areas like Texas. Transportation networks and infrastructure have been disrupted, affecting producers’ ability to deliver oil to local and international markets.
  3. Short-Term Price Boost: Cold weather has helped support oil prices, which have seen significant increases. For example, futures contracts for Brent crude and West Texas Intermediate (WTI) crude have risen with ongoing expectations of cold weather conditions.
  4. Impact on Inventories: Increased consumption of heating fuel has led to faster-than-expected draws from strategic inventories, especially in the United States, raising concerns about market balance. Energy Information Administration (EIA) data showed a larger-than-expected decline in inventories, prompting investors to buy more futures contracts in anticipation of potential shortages.
  5. Divergence in Global Demand: While demand for oil rose in Europe and the United States, demand in Asia remained relatively stable due to milder weather conditions. This divergence has helped mitigate the sharp rise in prices on a global level.
  6. Seasonal Factors: Although cold weather boosts oil demand during winter, the market is anticipating a return to milder temperatures in the coming months, which may lead to a gradual decline in prices. Outlook: If harsh weather continues longer than expected, the market may experience further upward pressure on prices. However, the return to climatic stability will rebalance supply and demand, especially if producing countries respond by increasing production to compensate for any shortages.

Global Interest Rate Cuts

Major central banks in the United States, Europe, the United Kingdom, Canada, and New Zealand continue to cut interest rates and ease tight monetary policies, aiming to halt the decline in economic activity and preserve achieved gains. Low interest rates typically reduce borrowing costs, which can boost economic activity and increase demand for oil.

Economic Stimulus in China

Chinese authorities took additional new stimulus measures during the last quarter of 2024 to support the country’s weak economic activities, which will also reflect in improved oil demand levels in the world’s largest crude importer.

Chinese authorities announced that they will adopt a “somewhat accommodative” monetary policy, according to an official statement issued by a meeting of senior Communist Party officials, a term last used in 2010 when they sought to support recovery from the global financial crisis.

According to the ruling party’s political office, the country will adopt a “sufficiently accommodative” monetary policy in 2025, alongside a more proactive fiscal policy to stimulate economic growth.

Key Challenges Affecting Oil Prices in 2025

The crude oil market in 2025 faces numerous challenges that could significantly impact its prices, including the following:

  • Continued Geopolitical Uncertainty:

    • The ongoing war in Ukraine and tensions in the Middle East cast shadows over oil markets, leading to significant price volatility.
    • The war in Ukraine continues with no clear solutions in sight, keeping oil prices in a state of uncertainty.
    • China escalates its claims of sovereignty over Taiwan, raising fears of a war between the two countries.
    • Many countries impose sanctions on some oil-producing nations.

  • Global Economic Slowdown:

    • A slowdown in global economic growth could lead to a decrease in fuel demand.
    • Many major global economies face recession risks this year, casting a gloomy shadow on oil demand forecasts and price declines.

  • Increased Production from Non-OPEC+ Countries:

    • Some non-OPEC+ countries, such as the United States and Canada, are seeking to increase their oil production. This could lead to an oversupply in the market and negatively pressure prices.

  • Shift Towards Renewable Energy:

    • Many countries are aiming to reduce their reliance on fossil fuels and transition to renewable energy sources.
    • The shift to renewable energy in the long term could lead to a decrease in oil demand and exert downward pressure on prices.

  • Climate Change Concerns:

    • Concerns about climate change are increasing pressure on governments and companies to reduce carbon emissions.
    • These pressures could lead to restrictions on oil usage and a decline in demand and prices.

Top Oil Price Forecasts for 2025

  • Bank of America expects oil prices to stabilize around $80 per barrel this year.
  • Goldman Sachs Group forecasts oil prices to rise to $80 per barrel this year.
  • Citibank Group expects oil prices to stabilize around $75 per barrel this year.
  • Morgan Stanley Group forecasted oil prices to reach $75 per barrel by the end of 2025.
  • Deutsche Bank expects oil prices to reach $90 per barrel by the end of 2025, citing supply shortages as a key factor supporting prices.
  • Barclays Bank also raised its oil price forecasts by five dollars above the target price of $90 per barrel by the end of this year.
  • Geoffries Financial Consulting Institute indicated that Brent crude could end the year at $95 per barrel.
  • The World Bank expects the average Brent crude price to be $93 per barrel in 2025, attributing this to ongoing geopolitical tensions and OPEC+ production slowdowns.
  • The International Energy Agency expects the average Brent crude price to be $90 per barrel in 2025.
  • Argus Media expects the average Brent crude price to be $95 per barrel in 2025.

Best Oil Trading Companies January 2025


  • Pepperstone – Best overall crude oil trading broker for beginners. Multiple regulated licenses. Founded 2010. Minimum deposit: $0. 20% discount on deposit.
  • FPMarkets  – Established 2005. Ideal for trading Crude Oil (WTI/Brent) with competitive spreads and fast execution. Minimum deposit: $100.
  • Plus500 – Best licensed broker for investing in crude oil futures. Founded 2008. Multiple regulated licenses. Minimum deposit: $100.
  • XM – Top crude oil WTI trading platform for educational materials and copy trading. Founded 2009. Multiple regulated licenses. Minimum deposit: $5. Periodic competitions and bonuses.


Pepperstone

Licenses:

CySEC, BaFin, FCA, SCB, CMA

74-89% of CFD retail investor accounts lose money.

FPMarkets Logo

FPMarkets

Licenses:

ASIC, CySEC, CMA, STV, FSCA, FSA


Plus500

Licenses:

CySEC, ASIC, IFSC, DFSA, FSA

Plus500 Futures trading is available to US residents only.


XM Logo

XM

Licenses:

CySEC, ASIC, IFSC, DFSA, FCA


Technical Analysis of Crude Oil Prices

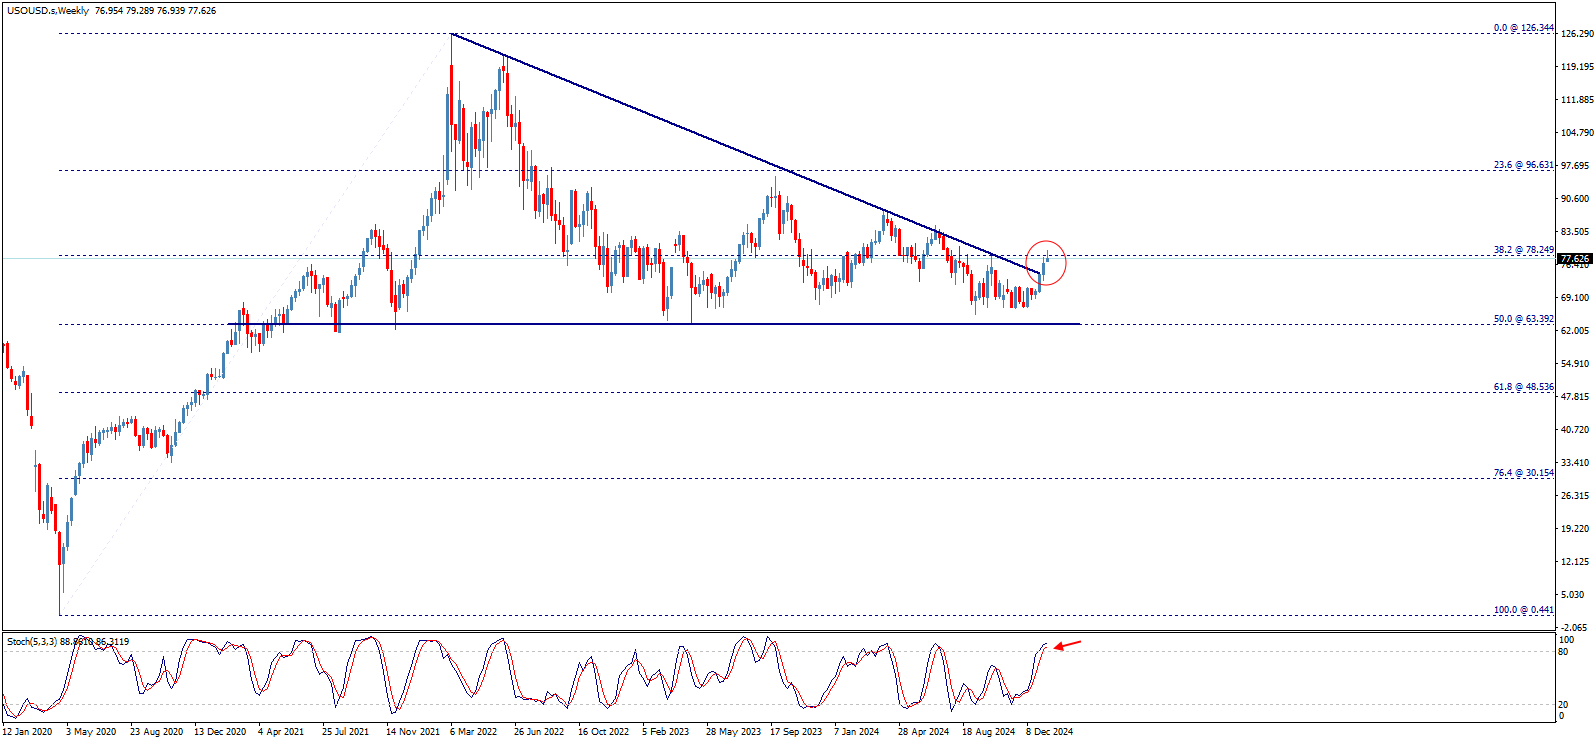
When applying the Fibonacci correction rule to different timeframes of oil prices, we find that there are signals suggesting the price direction towards recovering the upward trend in the medium to long term. After several attempts to reach the 50% Fibonacci level for the entire rise measured from historical lows around $0.44 to the recorded peak at $126.34, the price bounced upward and broke through a significant resistance level, as shown in the following weekly chart:
 

oil


The price is attempting to break through the resistance level formed at the previously broken 38.2% Fibonacci correction level, forming a significant resistance at $78.25. Breaking this level represents a key confirmation for the continuation of the upward wave and the direction to achieve positive targets starting at $84.40 and extending to areas of $90.00 and then $96.60 in the medium term.

The Stochastic indicator shows negative signals on the weekly timeframe, which may hinder the price’s task of achieving the required breakout at $78.25 and delay the confirmation of the breakout. This indicates that we need a weekly close above this level to confirm the continued rise.

On the other hand, on the daily timeframe, we find that the price began an upward correction from the recorded low in 2023 at $63.76. We observe that the price surpassed the 23.6% Fibonacci level to build more upward waves in the short term, targeting the visit to the 85.70% level as the next corrective target.


oil


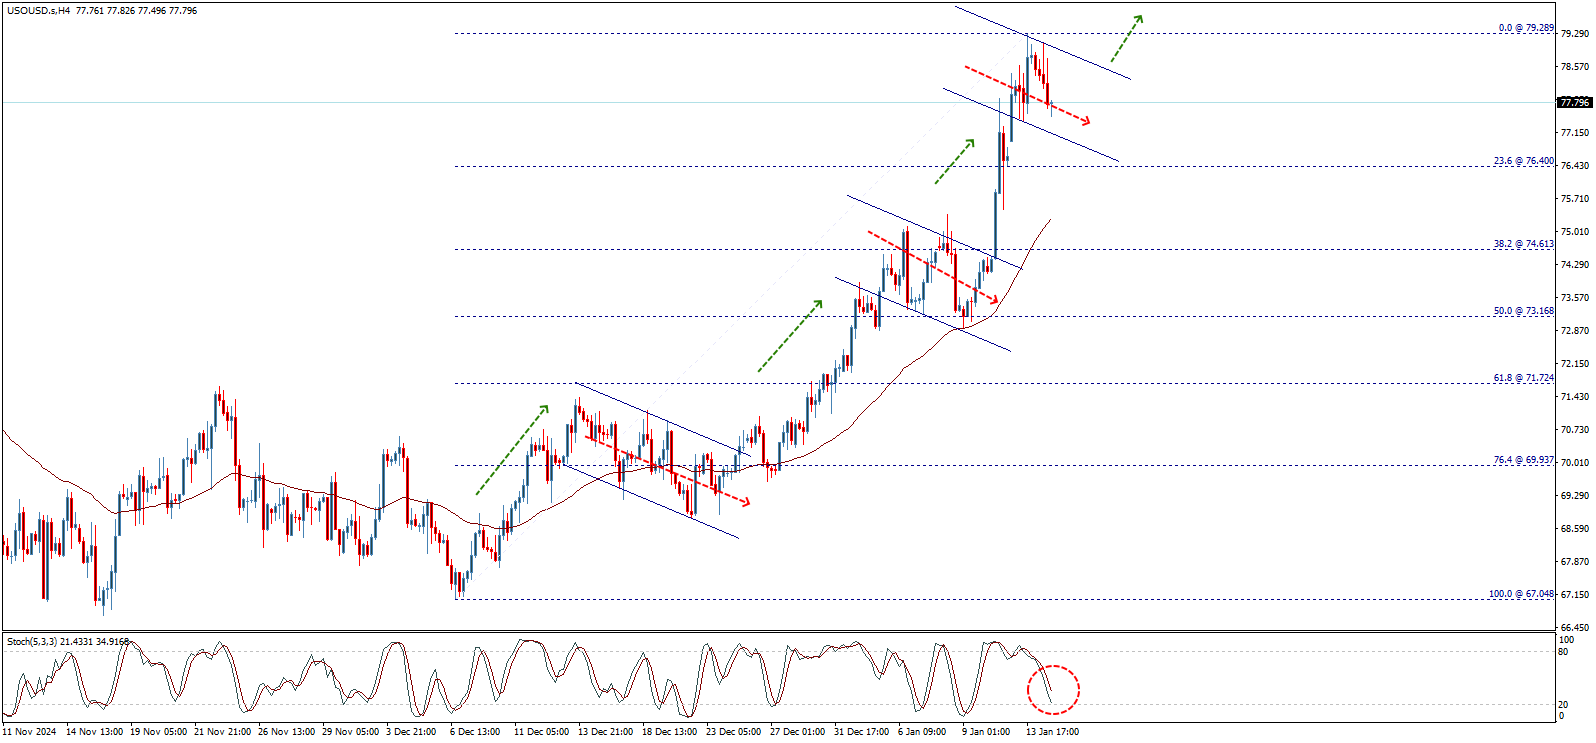
Continuing the application of Fibonacci corrections to different timeframes, the four-hour chart shows that the upward wave initiated by the price from the $67.05 area faced temporary downward retracements, followed by a resumption of the main upward trend. This contributed to pushing the price higher by forming ascending flag patterns, as shown in the chart below. Currently, the price is undergoing a downward correction that may lead it to test the $76.40 areas before resuming the upward wave again.
 

oil


The recent trades are confined within a descending sub-channel forming a continuation flag pattern, meaning that breaking $78.90 will provide a good positive incentive supporting the continued upward trend in the upcoming period, aiming to achieve the aforementioned positive targets.

In summary, the expected overall trend for the upcoming period is upward, confirmed by breaking $78.25 and then $78.90, to receive positive incentives contributing to the surge towards levels of $84.40, then further to areas of $90.00 and $96.60.

Conversely, it is crucial to note that failing to confirm the breach of $78.90 and a downward rebound breaking the $74.60 level will force the price to turn downward, incurring new losses that could reach areas of $63.40 in the short term.

Fibonacci Levels

  • 50% Fibonacci Level: A Fibonacci correction level reached from $0.44 to $126.34.
  • 38.2% Fibonacci Level: A significant resistance level at $78.25.
  • 23.6% Fibonacci Level: A corrective level on the daily timeframe at $85.70.

Technical Indicators

  • Stochastic Indicator: Shows negative signals on the weekly timeframe, which may hinder the price’s task of achieving the required breakout.

Four-Hour Chart

The four-hour chart shows that the upward wave initiated by the price from the $67.05 area faced temporary downward retracements, followed by a resumption of the main upward trend. This contributed to pushing the price higher by forming ascending flag patterns, as shown in the chart below. Currently, the price is undergoing a downward correction that may lead it to test the $76.40 areas before resuming the upward wave again.

Trading Channels

  • Descending Sub-Channel: Recent trades are confined within a descending sub-channel forming a continuation flag pattern.

Summary

In summary, the expected overall trend for the upcoming period is upward, confirmed by breaking $78.25 and then $78.90, to receive positive incentives contributing to the surge towards levels of $84.40, then further to areas of $90.00 and $96.60.

Conversely, it is crucial to note that failing to confirm the breach of $78.90 and a downward rebound breaking the $74.60 level will force the price to turn downward, incurring new losses that could reach areas of $63.40 in the short term.

Conclusion

In conclusion, the expected overall trend for the upcoming period is upward based on technical analysis, with necessary confirmations at $78.25 and $78.90 levels to support the continuation of the upward trend and achieve positive targets. However, attention must be paid to critical support levels at $74.60 and $63.40 in the event of negative reversals.

Closing

The overall expected trend for the upcoming period is upward based on technical analysis, with the necessity to monitor vital support and resistance levels to ensure the achievement of desired targets and avoid potential risks.



Source link

16 01, 2025

Tea Market to Grow Rapidly, Hitting US$ 33.9 Billion by

By |2025-01-16T06:08:10+02:00January 16, 2025|Dietary Supplements News, News|0 Comments


Wilmington, Delaware, Transparency Market Research Inc. –, Jan. 15, 2025 (GLOBE NEWSWIRE) — The global tea market (pasar the) was valued at US$ 20.2 billion in 2023 and is projected to grow at a CAGR of 5.9% from 2024 to 2032, reaching US$ 33.9 billion by the end of 2032. This growth is fueled by increasing consumer preference for healthy beverages, innovations in tea flavors and formats, and the rising popularity of organic and specialty teas. Expanding tea culture globally and growing awareness about the health benefits of tea are key factors driving the market’s expansion.

Tea, one of the most beloved beverages in the world, continues to hold a significant place in global markets. From its deep cultural roots to its evolving appeal as a health drink, the tea market is growing at a robust pace. With diverse varieties, innovative blends, and increasing consumer interest in wellness, the tea market has expanded into a vibrant and dynamic industry. This blog will explore the current trends, market segmentations, and growth opportunities in the tea market.

For more insights, Request a sample report: https://www.transparencymarketresearch.com/sample/sample.php?flag=S&rep_id=4187


Key Players in the Tea Market

Several global and regional players dominate the tea market, each offering a diverse range of products. Some of the notable brands include:

  • Unilever (Lipton, TAZO): Leading with both mass-market and premium offerings.
  • Tata Consumer Products (Tetley): Focused on sustainability and quality.
  • Twining’s: Known for its premium and specialty teas.
  • Bigelow Tea: A leader in herbal and organic blends.
  • Celestial Seasonings: Specializing in herbal and wellness teas.
  • Nestlé (Nestea): A major player in the RTD tea segment.

The Global Appeal of Tea

Tea is a universal beverage enjoyed in almost every culture. Its popularity stems from its variety, versatility, and the health benefits associated with many types. Whether it’s black, green, herbal, oolong, or specialty tea blends, consumers are drawn to the rich flavors, antioxidant properties, and cultural significance that tea offers.

Key Trends in the Tea Market

The tea market is undergoing a transformation, influenced by shifting consumer preferences, innovations, and changing lifestyles. Here are some of the major trends driving the market:

1. Health and Wellness Boom

Consumers are increasingly seeking beverages that offer health benefits. Green tea, herbal tea, and specialty teas with added functional ingredients like turmeric, ginger, and chamomile are gaining traction for their antioxidant and calming properties.

2. Premiumization and Specialty Teas

There is a growing demand for premium teas, such as single-origin, organic, and artisanal blends. Consumers are willing to pay a premium for high-quality, sustainable, and ethically sourced products.

3. Rise of Ready-to-Drink (RTD) Teas

Convenience is key, and ready-to-drink teas are becoming a popular choice. Bottled green tea, iced tea, and herbal tea beverages are dominating the RTD market, especially among younger consumers.

4. Sustainability and Ethical Sourcing

Consumers are more conscious of the environmental and social impact of their purchases. Brands are emphasizing sustainable packaging, fair trade certifications, and eco-friendly practices.

5. Growth of E-Commerce

The rise of online retail has made tea more accessible to consumers. Specialty brands and global tea varieties are just a click away, thanks to e-commerce platforms.

Request Customization to Get Tailored Insights for Your Business Needs: https://www.transparencymarketresearch.com/sample/sample.php?flag=S&rep_id=4187

Growth Opportunities in the Tea Market

The tea market offers significant growth potential as consumer preferences shift toward health and sustainability. Some of the emerging opportunities include:

  • Functional and Medicinal Teas

Teas infused with adaptogens, CBD, probiotics, and other functional ingredients are gaining popularity for their specific health benefits, such as stress relief and digestion improvement.

  • 2. Expanding into Emerging Markets

Rising disposable incomes and growing health awareness in countries like Brazil, South Africa, and the Middle East present opportunities for expansion.

  • 3. Innovative Tea-Based Products

The introduction of tea-infused snacks, desserts, and beverages, such as tea lattes and sparkling tea, is creating new product categories and expanding consumer interest.

Brands are leveraging the cultural heritage of tea to offer immersive experiences, such as tea plantation tours and tea-tasting events.

Market Segmentations of the Tea Market

  • Black Tea: Traditional and widely consumed globally.
  • Green Tea: Popular for its health benefits and antioxidants.
  • Herbal Tea: Infusions with ingredients like chamomile, mint, and hibiscus.
  • Oolong Tea: A niche but growing segment, combining characteristics of black and green tea.
  • Specialty/Flavored Tea: Blends infused with flavors like fruit, spices, or floral notes.
  • Loose Leaf Tea: Preferred by tea connoisseurs for its fresh flavor.
  • Tea Bags: Convenient and popular for daily use.
  • Ready-to-Drink Tea: Bottled or canned, targeting busy consumers.
  • Powdered Tea: Instant tea mixes, commonly used in offices or on the go.
  • Online Stores: Direct-to-consumer platforms and e-commerce marketplaces.
  • Supermarkets and Hypermarkets: Dominant retail channels for mass-market teas.
  • Specialty Tea Stores: Focused on premium and artisanal offerings.
  • Cafes and Restaurants: Driving demand through tea-based beverages.
  • Household Consumers: Regular tea drinkers in homes.
  • Commercial: Restaurants, hotels, and cafés.
  • Asia-Pacific: The largest consumer, driven by countries like China and India.
  • Europe: High demand for premium and specialty teas.
  • North America: A growing market for green, herbal, and iced teas.
  • Rest of the World: Emerging interest in health-focused tea varieties.

Buy This Premium Research Report Now to Get Detailed Analysis: https://www.transparencymarketresearch.com/checkout.php?rep_id=4187&ltype=S

The tea market is poised for steady growth as it adapts to changing consumer preferences and global trends. With its diverse product offerings, health benefits, and cultural significance, tea remains an integral part of daily life worldwide. As the industry continues to innovate with new flavors, formats, and sustainability practices, the future of tea is bright, promising exciting opportunities for brands and consumers alike. Whether it’s a cup of traditional black tea or an exotic herbal blend, the world of tea has something for everyone.

Explore Latest Research Reports by Transparency Market Research:

  • Dried Herbs Market – (ドライハーブマーケット) is estimated to grow at a CAGR of 4.9% from 2023 to 2031 and reach US$ 5.5 Billion by the end of 2031
  • Rice Flour Market– (米粉市場) is estimated to grow at a CAGR of 4.8% from 2023 to 2031 and reach US$ 1.3 Billion by the end of 2031.

About Transparency Market Research

Transparency Market Research, a global market research company registered at Wilmington, Delaware, United States, provides custom research and consulting services. Our exclusive blend of quantitative forecasting and trends analysis provides forward-looking insights for thousands of decision makers. Our experienced team of Analysts, Researchers, and Consultants use proprietary data sources and various tools & techniques to gather and analyses information.

Our data repository is continuously updated and revised by a team of research experts, so that it always reflects the latest trends and information. With a broad research and analysis capability, Transparency Market Research employs rigorous primary and secondary research techniques in developing distinctive data sets and research material for business reports.

Contact:

Transparency Market Research Inc.
CORPORATE HEADQUARTER DOWNTOWN,
1000 N. West Street,
Suite 1200, Wilmington, Delaware 19801 USA
Tel: +1-518-618-1030
USA – Canada Toll Free: 866-552-3453
Website: https://www.transparencymarketresearch.com    
Email: sales@transparencymarketresearch.com
Follow Us: LinkedIn| Twitter | Blog | YouTube


Source link

16 01, 2025

XAG/USD rallies past 200 and 50-day SMAs

By |2025-01-16T05:21:14+02:00January 16, 2025|Forex News, News|0 Comments


  • Silver climbs, breaching 200-day SMA at $29.98, enhancing buying momentum.
  • Major resistance at $31.00; break could aim for December 12 high of $32.32.
  • Pullback below 50-day SMA might prompt retest of 200-day SMA, down to $28.74.

Silver’s price stages a comeback, rising above the 50-day Simple Moving Average (SMA) at $30.32 and eyeing a break of the 100-day SMA. At the time of writing, the XAG/USD trades at $30.64, having gained over 2.64% on Wednesday.

XAG/USD Price Forecast: Technical outlook

On its way toward its current price, XAG/USD cleared the 200-day SMA at $29.98, which exacerbated the upward move. Yet buyers need to clear the 100-day SMA at $30.82 so Silver can extend its gains.

Momentum favors further upside, yet consolidation lies ahead as the Relative Strength Index (RSI) is flat, but above the latest peak.

If buyers clear the 100-day SMA, $31.00 emerges as the next key resistance level. A break above this level opens the door to testing the latest cycle high at $32.32, the December 12 daily high.

On the other hand, if sellers step in and push XAG/USD below the 50-day SMA, it could pave the way towards $29.98, the 200-day SMA. On further weakness, the next stop would be December’s 19 swing low of $28.74.

XAG/USD Price Chart – Daily

Silver FAQs

Silver is a precious metal highly traded among investors. It has been historically used as a store of value and a medium of exchange. Although less popular than Gold, traders may turn to Silver to diversify their investment portfolio, for its intrinsic value or as a potential hedge during high-inflation periods. Investors can buy physical Silver, in coins or in bars, or trade it through vehicles such as Exchange Traded Funds, which track its price on international markets.

Silver prices can move due to a wide range of factors. Geopolitical instability or fears of a deep recession can make Silver price escalate due to its safe-haven status, although to a lesser extent than Gold’s. As a yieldless asset, Silver tends to rise with lower interest rates. Its moves also depend on how the US Dollar (USD) behaves as the asset is priced in dollars (XAG/USD). A strong Dollar tends to keep the price of Silver at bay, whereas a weaker Dollar is likely to propel prices up. Other factors such as investment demand, mining supply – Silver is much more abundant than Gold – and recycling rates can also affect prices.

Silver is widely used in industry, particularly in sectors such as electronics or solar energy, as it has one of the highest electric conductivity of all metals – more than Copper and Gold. A surge in demand can increase prices, while a decline tends to lower them. Dynamics in the US, Chinese and Indian economies can also contribute to price swings: for the US and particularly China, their big industrial sectors use Silver in various processes; in India, consumers’ demand for the precious metal for jewellery also plays a key role in setting prices.

Silver prices tend to follow Gold’s moves. When Gold prices rise, Silver typically follows suit, as their status as safe-haven assets is similar. The Gold/Silver ratio, which shows the number of ounces of Silver needed to equal the value of one ounce of Gold, may help to determine the relative valuation between both metals. Some investors may consider a high ratio as an indicator that Silver is undervalued, or Gold is overvalued. On the contrary, a low ratio might suggest that Gold is undervalued relative to Silver.


Source link

16 01, 2025

6 Best Weight Loss Supplements for Women in 2025

By |2025-01-16T04:07:32+02:00January 16, 2025|Dietary Supplements News, News|0 Comments


Weight loss is a challenging journey influenced by habits, stress, hormonal imbalances, and modern sedentary lifestyles. Weight loss supplements can complement healthy diets and exercise by boosting metabolism, curbing appetite, and filling nutritional gaps. While they offer support, they should never replace a balanced lifestyle.

Choosing legitimate supplements is essential to achieving results safely. In this article, we will be dealing with 6 best weight loss supplements for women. Each of the formulas is analyzed in detail to provide a comprehensive overview of them.

  1. LeanBiome

  2. Mitolyn

  3. PhenQ

  4. Java Burn

  5. Keto ACV Gummies

FitSpresso

Best Weight Loss Supplements For Women In The Market

Here are the best fat burner for women reviews.

1. LeanBiome

LeanBiome is a natural fat burner for women that was developed to diversify the gut microbiome by delivering a set of lean bacteria. This supplement helps suppress the appetite, electrifies metabolism, and reduces fat storage.

Reversing the bacterial imbalance in the gut microbiome treats and improves the root cause of unexplained belly fat and stubborn body fat. It is made using high-quality natural ingredients in an FDA-approved lab facility.

Ingredients

  1. Lactobacillus gasseri

  2. Lactobaci;llu rhamnosus

  3. Lactobacillus fermentum

  4. Greenselect phytosome

Benefits

●Regulates appetite

●Boost metabolism

●Reduce fat accumulation

●Support gut health

Pros

●Made using natural ingredients

●Non-habit-forming

●Comes in an easy-to-use capsule form

Cons

●Might take time to deliver results

Usage

Take 2 capsules religiously on an empty stomach in the morning with a big glass of water.

2. Mitolyn

Mitolyn is one of the best weight loss supplements for women. It is made by fusing clinically tested natural ingredients and processed in a well-maintained lab facility.

It targets the root cause of visceral fat in the female body and blends six exotic nutrients and plants to support healthy mitochondria levels. This way it supports healthy and increased fat burning in the body to support weight loss.

Ingredients

  1. Maqui berry

  2. Rhodiola

  3. Haematococcus

  4. Amla

  5. Theobroma cacao

  6. Schisandra

Benefits

●Promotes cardiovascular health

●Support brain health

●Boost immunity

●Ease digestive processes

Pros

●Comes at an affordable price

●Backed by a risk-free money-back guarantee for 90 days

●Manufactured in a well-maintained lab facility

Cons

●Face frequent shortages of stocks

Usage

Use 1 tablet of this formula every day with a big glass of water in the morning.

3. PhenQ

PhenQ is a dietary supplement that focuses on 5 key areas of metabolic health to shed excess fat, reduce cravings, and support natural energy. Regular use of this supplement supports metabolism and reduces fat accumulation to support overall body weight. It also enhances your mood and reduces fatigue.

The manufacturer of these weight loss pills assures that it is made under the strict supervision of medical professionals and uses high-grade ingredients in the making.

Ingredients

  1. Capsimax powder

  2. Chromium picolinate

  3. Caffeine

  4. Nopal cactus

  5. L-carnitine fumarate

Benefits

●Enhances overall mood

●Boost energy levels

●Reduce fat accumulation

●Suppress cravings and hunger

Pros

●Free US shipping on all orders

●Easily available through its official website

●Does not contain harsh chemicals, additives, stimulants, and GMOs

Cons

●Not suitable for pregnant and breastfeeding women

Usage

Take 2 capsules regularly in the morning with a big glass of water.

4. Java Burn

Java Burn is based on a simple coffee hack that boosts metabolism and releases excessive stored fat. It supplies a steady source of energy and helps you perform all your daily activities easily. This formula also balances high levels of blood sugar and cholesterol to support the healthy functioning of the heart.

Java Burn is formulated using organically sourced ingredients and is manufactured in a strict lab facility that is FDA-accredited and GMP-certified.

Ingredients

  1. Chlorogenic acid

  2. Camellia sinensis

  3. Chromium

  4. L-carnitine

  5. L-theanine

  6. Vitamin complex

Benefits

●Controls hunger and cravings

●Balance blood sugar levels

●Promotes heart health

●Supports cognitive functions

Pros

●High-grade natural ingredients are used

●Reasonably priced

●Comes in an easy-to-use powder form

Cons

●Individual results may vary

Usage

Mix a pack of Java Burn with your morning coffee and have it daily.

5. Keto ACV Gummies

Keto ACV gummies work to support ketosis in the body by burning fat or energy. It converts the burned fat directly into energy and supports increased energy.

In addition, this belly fat burner releases fat stores and reduces fat accumulation in the body. Every batch of this formula is exposed to various levels of clinical trials and is assured to be safe and effective.

Ingredients

  1. BHB salt

Benefits

●Amplifies metabolism levels

●Supports energy levels

●Release stored fat

Pros

●Processed in a strict lab facility

●Does not cause addiction

●Easy to use

Cons

●Not available through any other sites or retail stores

Usage

Simply take 1 gummy a day either by chewing it or with a big glass of water

6. FitSpresso

FitSpresso is a natural weight loss formula that is made using organic ingredients to boost metabolism levels. It increases the rate of fat burning and supports healthy weight loss in the body. These diet pills help suppress appetite and reduce fat absorption from the intestines.

The supplement is made under strict safety standards and quality control measures in an FDA-approved lab facility that is also GMP-certified.

Ingredients

  1. CGA

  2. Chromium

  3. L-carnitine

  4. L-theanine

  5. EGCG

Benefits

●Increase fat burning

●Controls appetite and reduces cravings and hunger

●Boost energy levels

●Support a strong immune system

Pros

●Non-addictive supplement

●Comes at an affordable price

●Easily available through its official website

Cons

● This might cause variations in individual results.

Usage

Take 2 tablets daily with a big glass of water in the morning on an empty stomach.

Who Should Use and Who Should Avoid These Weight Loss Pills?

The above-mentioned supplements are suitable for all women above the age of 18. Each of these supplements targets specific aspects of weight loss and provides ample results to all those seeking a natural weight loss formula. Customers can use them to burn their stubborn body fat as they focus on treating the root cause of stubborn body fat.

The manufacturer of these supplements specifically mentions that they are not suitable for children under 18 years of age, pregnant women, and feeding mothers. If you are under any prescription medicine or if you have any known health condition, it is advised to get approval from a doctor before using it.

Make sure that you read the supplement label of each formula carefully and follow the instructions to avoid complications.

Final Words On Best Weight Loss Supplements For Women

This concludes our analysis of the 6 best weight loss supplements for women. In this article, we explored high-quality formulas that are designed to support weight management and hence overall health.

All 6 formulas discussed above are effective and legitimate supplements that are suitable for long-term use, making them reliable options for supporting weight management. It is crucial to choose natural supplements like the ones mentioned above to achieve results without the risks of side effects.

Considering these aspects, investing in any one of these five supplements is a worthwhile step towards achieving your health and weight loss goals.

Best Weight Loss Supplements For Women FAQs

●Can I use these anti-obesity medications if I am already taking any other prescription medicines?

If you are already taking any other prescription medicines or have any known health condition, getting approval from a doctor before using any of these weight loss medications is strictly advised. This will help you avoid complications caused by overlapping of ingredients.

●Are weight loss supplements safe for women?

Weight loss supplements can be safe for women when used as directed and chosen carefully. However, their safety depends on the ingredients used and individual health conditions. So it is essential to choose a natural and safer supplement that is clinically tested and proven to be chemical-free and authentic.

●Can fat burner pills work without exercise?

Fat burner pills are created to provide support for weight loss by boosting the metabolism and reducing the appetite. However, their effectiveness is significantly limited without exercise. Physical activities enhance the working of the formula and they promote calorie burning and muscle retention which are the key components of weight loss.

●Can women over 40 or 50 lose weight using fat burners?

Women over 40 and 50 can lose weight using fat burners. However, their effectiveness is entirely dependent on individual lifestyle and metabolism. Fat burners should always be combined with a healthy diet and proper exercise as age-related changes can make weight loss challenging.

●Are weight loss pills suitable for women with diabetes?

Women with diabetes should exercise caution while choosing weight loss supplements as some pills may interfere with diabetes medications and can cause fluctuations in glucose levels. It is crucial to choose supplements that are diabetic-friendly and make sure that they contain no ingredients that have potential effects on your blood sugar levels.


Source link

16 01, 2025

A Bullish Outlook for 2025 – Blockchain News, Opinion, TV and Jobs

By |2025-01-16T04:05:34+02:00January 16, 2025|Crypto News, News|0 Comments

Key events shaped the altcoin space. US President Donald Trump endorsed crypto after his victory. Ripple also won its case against the US SEC. These developments caused Solana’s price to rally by 200%. It reached an intra-year peak of $266 by the end of November 2024. In 2025, the cryptocurrency began with higher lows. This pattern often signals upward movement.

From Early Gains to New Heights

Solana, which initially was not high priced, only started growing earlier this year and reached $260 by year-end. That was its highest level until November 2024, when SOL/USD crossed that point and attained $266. Analysts estimate that the next upward target is $300 in Q1 of 2025, while a $500 per barrel is feasible in 2025.

Consequently, through most of 2023, Solana prices experienced significant volatility in 2022 after its extreme growth in 2021, ranging from around $20-$30. Interest in the market restarted at the end of 2023 in a market-wide pump in which Bitcoin and Solana made fresh all-time highs, with Bitcoin at $8000 and Solana price even hitting $120. This price level remained stable in 2024, although some regulatory insecurity is still linked to the SEC.

Solana’s Strong Recovery in 2024

From 2024, the value of Solana price reached $94, and then a steady rise began as the general sentiment of the crypto assets improved. It came over $200 by mid-year but started trading below the level for some time, with $120 as a crucial support floor. The price recovery began in September as the 50-week SMA provided a floor, the same timeframe as Ripple’s legal victory and the democrats winning a super-majority in both houses of the US Congress for president Republicans and the sweeping electoral victory.

After a fantastic period in late November, Solana price was over $265, making a new record high. Even after a pullback below this level in December, the 20-week SMA remained atop, further endorsing the larger bullish narrative up to 2025.

Innovations Driving Solana’s Success

Solana’s friendly applications, millions of customers, and its extraordinary structure of thousands of nodes also provide censorship freedom. Regarding transaction costs, which is a major concern across other developing blockchain platforms, developers pay a transaction fee of about $0.00025, and the confirmation time takes only 400 milliseconds, thus making it a wonderful host for decentralized applications (dApps).

Solana is an open-source project that started operating in 2020 and was developed by Solana Labs, with Anatoly Yakovenko and Raj Gokal as its founders. The Consensus mechanism implemented here is proof of stake, and the architecture Sealevel allows for parallel transaction processing with a TPS of 20,000. Some prioritization fees are also charged on an optional basis to help maintain order during a period of congestion.

Solana Price Outlook for 2025

As Solana enters 2025, its strong technical foundation, growing adoption, and favorable market conditions suggest continued bullish momentum. With targets of $300 and beyond, Solana’s trajectory could further cement its position as a leading blockchain platform in the future. Solana price prediction shows a potential rebound and a bullish outlook as per the analyst prediction and market momentum.

SOL has remained relatively stable as investors observed DEX market movements similar to those in Bitcoin and other altcoins this month. It reversed slightly down from Monday but was back in the green as investors applauded its increased market share in the DEX segment. Experts have quickly begun questioning if not for these trends; the cryptocurrency could hit $300.

Defi Llama statistics show that Solana ranked as the busiest DEX system last week, with $27 billion in turnover. Solana’s valuation has grown even bigger, dwarfing Ethereum, valued at $16 billion in the same period. Major DEXs in the Solana ecosystem, including Raydium, Lifinity, Orca, and Stabble, are the major contributors to this growth.

A Bullish Outlook for 2025 – Blockchain News, Opinion, TV and Jobs

According to Dune analytics data, solana weekly transactions are about 718.65 million, a 1 percent decrease in key metrics. There are around 25.22 million weekly active addresses, with a 4.67% difference. The total value locked (TVL) is around $8.19 billion, a 4.61% drop. These metrics show Solana’s network activity, user engagement, and the value invested in its decentralized finance (DeFi) protocols.

Solana Price Prediction: What’s Next for SOL Price in 2025?

Solana’s ascend in the DEX sector has been boosted more by memecoins such as Bonk and Dogwifhat, among others. Altogether, these tokens have a market capitalization greater than $16 billion and 24-hour trading volume above $3 billion.

A higher incidence of DEX activity benefits Solana’s ecosystem because it generates higher network fees. Some of these fees are returned to SOL holders as staking rewards, making the token even more attractive to investors.

As the DEX industry grows and people become increasingly positive about the approval of ETFs, many market spectators are now waiting to see how Solana can take advantage of this opportunity and head toward the $300 level.

Solana ETFs to Attract Billions

The crypto and investment community are concerned about Solana’s (SOL) potential approval of an exchange-traded ETF. After the launch of Bitcoin and Ethereum ETFs, several asset managers have filed with the US Securities and Exchange Commission (SEC) to launch Solana-based ETFs. Companies such as Grayscale Investments, VanEck, 21Shares, Bitwise, and Canary Capital are among those seeking approval.

Initial decisions on these applications are expected in early 2025 as the SEC reviews this process. For example, Grayscale’s application with the SEC will be reviewed by January 23, 2025, and the other firms by January 25, 2025.

A Solana ETF approval has the potential to upbeat market analysts and industry experts. Strong institutional interest is signaled by JPMorgan’s projects that ETFs for Solana could draw at least $3bn to $6bn of net assets within the first year. Solana’s price is rising in anticipation of approval on the ETF front, supported by rising optimism and growing momentum in the DEX space.

Moreover, Bitcoin ETFs like BlackRock’s iShares Bitcoin Trust (IBIT) have seen over $52 billion in assets, showing how investors seek to diversify their crypto investments.

The regulatory landscape may depend on changes in the political environment. When Donald Trump becomes the new president of the United States, his plans to appoint crypto-friendly officials in key regulatory positions have signaled a pro-crypto stance for the incoming administration. Such a twist could make the ground more accommodating for cryptocurrency ETFs, even though some are based on Solana.

Solana Price Analysis

In November 2023, Solana (SOL) reached an all-time high of $264.75 as the market increased. Since then, the price has dropped and entered a local bear market due to a shift in the cryptocurrency community’s mood.

Although the SOL has retested a significant support level at $188.15, this is a bright spot as it marks SOL’s highest swings last month and even last July. The price retest suggests forming a break-and-retest chart pattern and, therefore, price stabilization.

Moreover, the SOL has erected a double bottom pattern around $175, indicative of an upside reversal. A developing falling wedge pattern, formed when two descending and converging trendlines develop, would further support an upcoming bullish break. A breakout along these lines would set SOL up to retest its 2024 high of $265 and, with a move-through, potentially sail into the $300 region.

Solana Price Prediction: What’s Next for SOL Price in 2025?

On the contrary, the price of SOL has dipped under the 50-day weighted moving average, which implies a bearish market. If bearish momentum continues, this movement may also signal a decline toward the $150 support level.

Currently, the SOL price is $198.75, a 6.24% increase from the previous day if a recent price drop of 1.94% is disregarded. 


Source link

16 01, 2025

Japanese Yen Technical Analysis: USD/JPY, GBP/JPY, EUR/JPY

By |2025-01-16T02:09:07+02:00January 16, 2025|Forex News, News|0 Comments

Japanese Yen Talking Points:

  • Japanese Yen strength showed against the U.S. Dollar in the aftermath of this morning’s U.S. CPI report.
  • While questions remain around the Fed’s ability to cut rates this year, both Europe and the U.K. could drive bearish fundamental backdrops, making the prospect of carry unwind in GBP/JPY and EUR/JPY as more attractive concepts.
  • I look into these pairs each week in the Tuesday webinar, and you’re welcome to join: Click here for registration information.

USD/JPY Support Break


The U.S. Dollar showed a move of weakness around the U.S. CPI print this morning, and while DXY has bounced back and the EUR/USD sell-off has caught another shot-in-the-arm, USD/JPY is holding relatively close to the morning’s lows.

There’s also the breach of a support zone that had showed as prior resistance, taken from the 76.4 and 78.6% Fibonacci retracements of the July-September sell-off. This zone had previously helped to hold resistance in November, but more recently it had helped to hold support over the past two weeks, until this morning’s breach down to a lower-low.


USD/JPY Daily Price Chart

Chart prepared by James Stanley, USD/JPY on Tradingview

Get our exclusive guide to USD/JPY trading in 2025

USD/JPY Four-Hour


On a shorter-term basis we can see where this morning’s sell-off brought upon a fresh 2025 low in the pair; but the bounce from that has, so far, held resistance at the bottom of the support zone noted above.

For overhead resistance, there’s a prior swing-low at 156.91 and the top of the Fibonacci zone at 157.17. And for next support below the 156.00 handle, it’s the 155.00 psychological level that looms large.


USD/JPY Four-Hour Chart

usdjpy four hour 11525Chart prepared by James Stanley, USD/JPY on Tradingview


GBP/JPY


It’s been a slippery start to the year for the British Pound and I had looked at GBP/JPY in the weekly forecast, highlighting a bearish backdrop as prices had started to push below a long-term zone. Monday saw another spill in GBP/JPY and the pair made a fast push down to the 190.00 handle before catching a sizable bounce. Resistance held overnight at 193.00 and sellers have went back for another run, but chasing this at this point could be a challenge.

From the weekly chart below, we can see a longer-term trend that’s come more and more into question, as shown by lower-highs over the past six months. But if the pair gives up the 190.00 level, the door could soon open to breakdown scenarios.


GBP/JPY Weekly Chart

gbpjpy weekly 11525Chart prepared by James Stanley, GBP/JPY on Tradingview


GBP/JPY Four-Hour


Given how quickly the pair has moved off of that 193.00 level, chasing could be challenging. But, there’s also context for a lower-high around the 192.40 level; and if that doesn’t come into the picture, the 190.81 Fibonacci level could potential be used to work with breakdown scenarios into the 190.00 psychological level.


GBP/JPY Four-Hour Price Chart

gbpjpy four hour 11525Chart prepared by James Stanley, GBP/JPY on Tradingview


EUR/JPY


EUR/JPY is currently within a symmetrical triangle formation and earlier this week, it was around the 160.00 level that had held the lows after bears attempted to continue the sell-off that started after resistance at the 165.00 level around the end of 2024.

Similar to GBP/JPY above, that can be a tough move to chase. But the weekly chart shows the bigger-picture where, if we do see a notable sell-off and a breach of recent congestion, a longer-term move could come into play.


EUR/JPY Weekly Chart

eurjpy weekly 11525Chart prepared by James Stanley, EUR/JPY on Tradingview


EUR/JPY Four-Hour


From the four-hour chart of EUR/JPY, we can see another Fibonacci level coming into play at 160.90 to help hold the lows so far today. This is quite near the earlier week swing low and this could, again, be a challenging place to chase price-lower. But – it does highlight lower-high resistance potential at 161.44 or 162.04, both of which could keep the door open for a 160.00 test.

Or – if no pullback shows, a breach of 160.00 opens the door to bigger picture breakdown potential, with the next notable level-lower the Fibonacci level at 158.66.


EUR/JPY Four-Hour Chart

eurjpy four hour 11525Chart prepared by James Stanley, EUR/JPY on Tradingview


— written by James Stanley, Senior Strategist


Japanese Yen Talking Points:

  • Japanese Yen strength showed against the U.S. Dollar in the aftermath of this morning’s U.S. CPI report.
  • While questions remain around the Fed’s ability to cut rates this year, both Europe and the U.K. could drive bearish fundamental backdrops, making the prospect of carry unwind in GBP/JPY and EUR/JPY as more attractive concepts.
  • I look into these pairs each week in the Tuesday webinar, and you’re welcome to join: Click here for registration information.

USD/JPY Support Break


The U.S. Dollar showed a move of weakness around the U.S. CPI print this morning, and while DXY has bounced back and the EUR/USD sell-off has caught another shot-in-the-arm, USD/JPY is holding relatively close to the morning’s lows.

There’s also the breach of a support zone that had showed as prior resistance, taken from the 76.4 and 78.6% Fibonacci retracements of the July-September sell-off. This zone had previously helped to hold resistance in November, but more recently it had helped to hold support over the past two weeks, until this morning’s breach down to a lower-low.


USD/JPY Daily Price Chart

usdjpy daily 11525Chart prepared by James Stanley, USD/JPY on Tradingview


USDJPY AD


USD/JPY Four-Hour


On a shorter-term basis we can see where this morning’s sell-off brought upon a fresh 2025 low in the pair; but the bounce from that has, so far, held resistance at the bottom of the support zone noted above.

For overhead resistance, there’s a prior swing-low at 156.91 and the top of the Fibonacci zone at 157.17. And for next support below the 156.00 handle, it’s the 155.00 psychological level that looms large.


USD/JPY Four-Hour Chart

usdjpy four hour 11525Chart prepared by James Stanley, USD/JPY on Tradingview


GBP/JPY


It’s been a slippery start to the year for the British Pound and I had looked at GBP/JPY in the weekly forecast, highlighting a bearish backdrop as prices had started to push below a long-term zone. Monday saw another spill in GBP/JPY and the pair made a fast push down to the 190.00 handle before catching a sizable bounce. Resistance held overnight at 193.00 and sellers have went back for another run, but chasing this at this point could be a challenge.

From the weekly chart below, we can see a longer-term trend that’s come more and more into question, as shown by lower-highs over the past six months. But if the pair gives up the 190.00 level, the door could soon open to breakdown scenarios.


GBP/JPY Weekly Chart

gbpjpy weekly 11525Chart prepared by James Stanley, GBP/JPY on Tradingview


GBP/JPY Four-Hour


Given how quickly the pair has moved off of that 193.00 level, chasing could be challenging. But, there’s also context for a lower-high around the 192.40 level; and if that doesn’t come into the picture, the 190.81 Fibonacci level could potential be used to work with breakdown scenarios into the 190.00 psychological level.


GBP/JPY Four-Hour Price Chart

gbpjpy four hour 11525Chart prepared by James Stanley, GBP/JPY on Tradingview


EUR/JPY


EUR/JPY is currently within a symmetrical triangle formation and earlier this week, it was around the 160.00 level that had held the lows after bears attempted to continue the sell-off that started after resistance at the 165.00 level around the end of 2024.

Similar to GBP/JPY above, that can be a tough move to chase. But the weekly chart shows the bigger-picture where, if we do see a notable sell-off and a breach of recent congestion, a longer-term move could come into play.


EUR/JPY Weekly Chart

eurjpy weekly 11525Chart prepared by James Stanley, EUR/JPY on Tradingview


EUR/JPY Four-Hour


From the four-hour chart of EUR/JPY, we can see another Fibonacci level coming into play at 160.90 to help hold the lows so far today. This is quite near the earlier week swing low and this could, again, be a challenging place to chase price-lower. But – it does highlight lower-high resistance potential at 161.44 or 162.04, both of which could keep the door open for a 160.00 test.

Or – if no pullback shows, a breach of 160.00 opens the door to bigger picture breakdown potential, with the next notable level-lower the Fibonacci level at 158.66.


EUR/JPY Four-Hour Chart

eurjpy four hour 11525Chart prepared by James Stanley, EUR/JPY on Tradingview


— written by James Stanley, Senior Strategist

Source link

16 01, 2025

Dietary Supplement Shown to Reduce Aggression by Up to 28% : ScienceAlert

By |2025-01-16T02:05:56+02:00January 16, 2025|Dietary Supplements News, News|0 Comments


Keep calm and try omega-3. The fatty acids, available as dietary supplements via fish oil capsules and thought to help with mental and physical well-being, could also cut down on aggression, according to a 2024 study.


These findings haven’t come out of nowhere: omega-3 has previously been linked to preventing schizophrenia, while aggression and antisocial behavior are thought in part to stem from a lack of nutrition. What we eat can influence our brain’s chemistry.


Researchers from the University of Pennsylvania built on earlier, smaller studies of omega-3 supplementation effects on aggression. Their meta-analysis looked at 29 randomized controlled trials across 3,918 participants in total.


Across all the trials, a modest but noticeable short-term effect was found, translating to up to a 28 percent reduction in aggression across multiple different variables (including age, gender, medical diagnosis, and length and dosage of treatment).

Flow diagram of literature search leading to 28 suitable papers. (Raine & Brodrick, Aggression and Violent Behavior, 2024)

“I think the time has come to implement omega-3 supplementation to reduce aggression, irrespective of whether the setting is the community, the clinic, or the criminal justice system,” said neurocriminologist Adrian Raine when the meta-analysis was published.


The trials included in the study, carried out between 1996 and 2024, ran for an average of 16 weeks. They covered a variety of demographics, from children aged 16 and under to older people aged between 50 and 60.


What’s more, the reductions in aggression included both reactive aggression (in response to provocation) and proactive aggression (behavior planned in advance). Before this study, it wasn’t clear if omega-3 could help with these different types of aggression.


While larger studies across longer periods of time are going to be needed to further establish this relationship, it adds to our understanding of how fish oil pills and the omega-3 in them might be beneficial for the brain.


“At the very least, parents seeking treatment for an aggressive child should know that in addition to any other treatment that their child receives, an extra portion or two of fish each week could also help,” Raine said.

One Dietary Supplement Found to Reduce Aggression by Up to 28%
Natural sources of omega-3 in foods. (Ekaterina Kapranova/iStock/Getty Images Plus)

The researchers think something in the way that omega-3 reduces inflammation and keeps vital brain processes ticking over might be helping regulate aggression. There are still a lot of unanswered questions, but the team suggests there’s enough evidence to look into this further.


Add in the studies that show that medications derived from fish oil can help reduce the risk of fatal heart attacks, strokes, and other heart health problems, and there seems to be plenty of upside to adding some omega-3 to your diet.


“Omega-3 is not a magic bullet that is going to completely solve the problem of violence in society,” said Raine.


“But can it help? Based on these findings, we firmly believe it can, and we should start to act on the new knowledge we have.”


The research has been published in Aggression and Violent Behavior.

An earlier version of this article was published in June 2024.


Source link

16 01, 2025

Here’s Why The Dogecoin And Shiba Inu Prices Are Surging Today

By |2025-01-16T02:04:06+02:00January 16, 2025|Crypto News, News|0 Comments

The Dogecoin and Shiba Inu prices are surging today, recording significant gains in the process. This price surge for the foremost meme coins came following a recent development on the macro side, which provided some relief for the crypto market. 

Why The Dogecoin And Shiba Inu Prices Are Surging

CoinMarketCap data shows that the Dogecoin and Shiba Inu prices have recorded considerable gains today, marking a price rebound for the foremost meme coins. Dogecoin and Shiba Inu have enjoyed this price recovery following the release of the cooler-than-expected US Producer Price Index (PPI) data, which provided relief for the crypto market.  

The US PPI rose to 3.3% year-on-year (YoY), lower than the earlier projections of 3.5%. This inflation data provided a boost for risk assets including Dogecoin and Shiba Inu, seeing as they rebounded following the data release. The PPI is one of the economic indicators that the Federal Reserve considers when cutting rates. A cooler-than-expected figure suggests inflation is declining, which is bullish for risk assets like these meme coins. 

The Dogecoin and Shiba Inu prices were also bound to surge as the Bitcoin price recently broke above $97,000. These meme coins share a strong positive price correlation with the flagship crypto and are know to mirror its price movement. Bitcoin was also reacting to the positive inflation data and led the broader crypto market to this price rebound. 

The inflation data evidently provided some optimism for market participants who had been waiting on the sidelines due to market uncertainty. This is particularly true for Dogecoin investors, as IntoTheBlock data shows a 41% spike in DOGE’s large transactions in the last 24 hours, with $23.35 billion traded during this period. This surge in Whale transactions also contributed to the price rebound, as these investors are known to significantly influence the market. 

What Next For These Meme Coins?

Crypto analysts have provided insights into what could come next for the Dogecoin and Shiba Inu prices. In an X post, crypto analyst Kevin Capital stated that if the market remains bullish, then Dogecoin’s short-term goal is to clear the .415 Fibonacci level. The crypto analyst asserted that DOGE can head back to the macro golden pocket at $0.48 once it clears this Fib level. 

Source: X

Crypto analyst Master Kenobi also recently provided a bullish outlook for Dogecoin. He predicted that the foremost meme coin could reach a new high around January 20, the day of Donald Trump’s inauguration. 

For Shiba Inu, crypto analyst CW stated that the meme coin did not break the previous low. As such, he remarked that the target price is still $0.00041. The crypto analyst added that SHIB is expected to reach this target price sooner than the pattern that he highlighted on his accompanying chart. 

Dogecoin price chart from Tradingview.com (Shiba Inu)
DOGE price moves to claim new local highs | Source: DOGEUSDT on Tradingview.com

Featured image created with Dall.E, chart from Tradingview.com

Source link

16 01, 2025

CoinRank Partners with RiverLand to Transform Web3 Gaming on TON Blockchain

By |2025-01-16T01:41:59+02:00January 16, 2025|News, NFT News|0 Comments


CoinRank, a global blockchain news blog, now formally collaborates with RiverLand, a Web3 idle farming game built with Cocos Studio on TON Blockchain. It is a partnership that seeks to transform the gaming industry by integrating innovative blockchain in the games.

Opening New Frontiers for Web3 Gaming

RiverLand is an example of idle games that let the players build their farming empires and earn gold coins while progressing toward becoming an ultimate farming tycoon. With this in mind, RiverLand guarantees the game can run smoothly on TON Blockchain with secure transactions and worthwhile incentives for players.

Blockchain news platform CoinRank contributes significantly to the partnership by offering detailed information about RiverLand’s ecosystem. With individual research and precise reports, future CoinRank wants to focus on how Web3 gaming audience and blockchain investors can be interested in RiverLand.

Core Components of the Partnership

  • Enhanced Gaming Experience: The synergy with CoinRank keeps RiverLand reaching more people while nurturing well-informed players in Web3 gaming.
  • Comprehensive Reporting: The analysis made by CoinRank will increase awareness of RiverLand’s features, token, and performance within the expanding ecosystem of the TON Blockchain.
  • Community Engagement: In the end, both platforms work together to provide a more active community of users, always updated with the new postings and site development.

RiverLand on TON Blockchain

Being part of the TON ecosystem, RiverLand leverages the inherent features of the blockchain, such as its low latency and high speeds of transaction, which are invaluable in real-time gaming. This partnership means a new wave for blockchain as a useful and entertaining tool that RiverLand represents with a connection between decentralized technologies and the gaming industry.

A Unified Vision

Through this partnership, the audiences of the RiverLand game will receive additional updates and valuable information regularly, and CoinRank will be able to dive deeper into a developing and promising sector of Web3 games.Stay tuned for more information on collaborations between CoinRank and RiverLand to raise blockchain gaming in the TON ecosystem.


Source link

16 01, 2025

Crude oil price cancels the negative formation

By |2025-01-16T01:18:07+02:00January 16, 2025|Forex News, News|0 Comments


Brent oil price attempted to rise but it declines again to keep the correctional bearish scenario active for today, waiting to visit 79.404 as a first station, which breaking it represents the key to extend the bearish wave towards 77.83$ areas.


Therefore, our bearish overview will remain valid and active unless breaching 81.00$ and holding above it.


The expected trading range for today is between 78.40$ support and 81.40$ resistance.


Trend forecast: Bearish


Source link

Go to Top