About Editorial team of BIPNs

Main team of content of bipns.com. Any type of content should be approved by us.
13 01, 2025

Hawkish Fed and dovish ECB equal parity

By |2025-01-13T15:35:42+02:00January 13, 2025|Forex News, News|0 Comments

  • Solid United States employment data smashed the odds for an interest rate cut.
  • Hotter-than-anticipated European inflation to maintain the ECB on the dovish path.
  • EUR/USD faces immediate resistance at 1.0197, the September 2022 monthly high.

The EUR/USD pair remained under selling pressure this week, with the US Dollar (USD) retaining its overall strength. The Greenback benefited from risk-aversion bouts, triggered by United States (US) President-elect Donald Trump’s tariffs plan. The pair heads into the weekend trading at around 1.0250, not far from the multi-year low posted on Friday at 1.0212.

Trade-war: Trump tariffs heat financial boards

The Washington Post reported on Monday that Donald Trump’s transition team was working on narrowing tariffs, focusing only on key sectors deemed vital to national security, such as defence, medical supplies and energy, narrowing the universal tariffs plan that Trump anticipated during his campaign. Latter in the day, however, Trump denied the headlines, saying that the story about paring back tariffs was wrong.

The EUR/USD pair jumped to 1.0431 with the initial headlines, as markets welcomed the idea of limited tariffs. Trump’s denial, on the other hand, boosted the US Dollar (USD) while sending stocks into a selling spiral.

Fears resumed mid-week when CNN reported that Trump was considering declaring a national economic emergency to impose widespread tariffs. Using the International Economic Emergency Powers Act (IEEPA) will unilaterally authorize a president to manage imports during a national emergency.

FOMC Minutes: Politics should not be in the way, but they are

The Federal Open Market Committee (FOMC) released the Minutes of the December Federal Reserve (Fed) monetary policy meeting on Wednesday, and the document brought some negative headlines.

Yet what caught investors’ attention is that the Minutes showed almost all members judged that the upside risk to inflation has increased. Officials mentioned “potential changes in trade, immigration, fiscal, and regulatory policies” as the reasons behind their fresh growth and inflation-related concerns.  Without saying it, officials said they are concerned about what Trump’s policies would mean to the economy.

Solid US employment data

Meanwhile, the US released multiple employment figures. The December ADP Employment Report showed that the private sector added 122K new jobs in the month, missing expectations of 140K. Additionally, Initial Jobless Claims for the week ended January 3 increased by 201K, better than the 218K expected and below the previous 211K. Also, US-based employers announced 38,792 cuts in December, a 33% decrease from the 57,727 cuts announced one month prior. It is up 11% from the 34,817 cuts announced in the last month of 2023, according to the Challenger Job Cuts report.

Finally, on Friday, the US published the Nonfarm Payrolls (NFP) report, which showed 256,000 new jobs were added in December. The reading was much stronger than the 160,000 anticipated and the November 212,000 reading. Even further, the Unemployment Rate edged lower to 4.1% from 4.2%, while the Labor Force Participation remained steady at 62.5%. Finally, annual wage inflation, as measured by the change in the Average Hourly Earnings, declined to 3.9% from 4%.

Markets turned risk-averse with the news, with the US Dollar rallying and stocks plummeting, as such figures suggest the Federal Reserve (Fed) will refrain from cutting interest rates in the upcoming months.

No good news in Europe  

European data fell once again short of encouraging. The preliminary estimate of the German Harmonized Index of Consumer Prices (HICP) was higher than anticipated, as the index rose 2.8% on its yearly comparison, above the 2.6% anticipated and the previous 2.4%. Retail Sales in the country fell 0.6% in November, while Factory Orders declined by 5.4% in the same period. 

The Eurozone HICP rose 2.7% in the year to December as expected, yet the Producer Price Index (PPI) was down 1.2% YoY in November, higher than the previous -3.3% or the -1.3% expected.

The European Central Bank (ECB) will likely continue trimming interest rates. That would keep the Euro on the downside, while a hawkish Fed means a stronger US Dollar. EUR/USD at parity is in the foreseeable future.

For the upcoming week, the focus will be on the US Consumer Price Index. The country will publish it next Wednesday, and Retail Sales will be published on Thursday. Other than that, the macroeconomic calendar has little relevant to offer.

EUR/USD technical outlook  

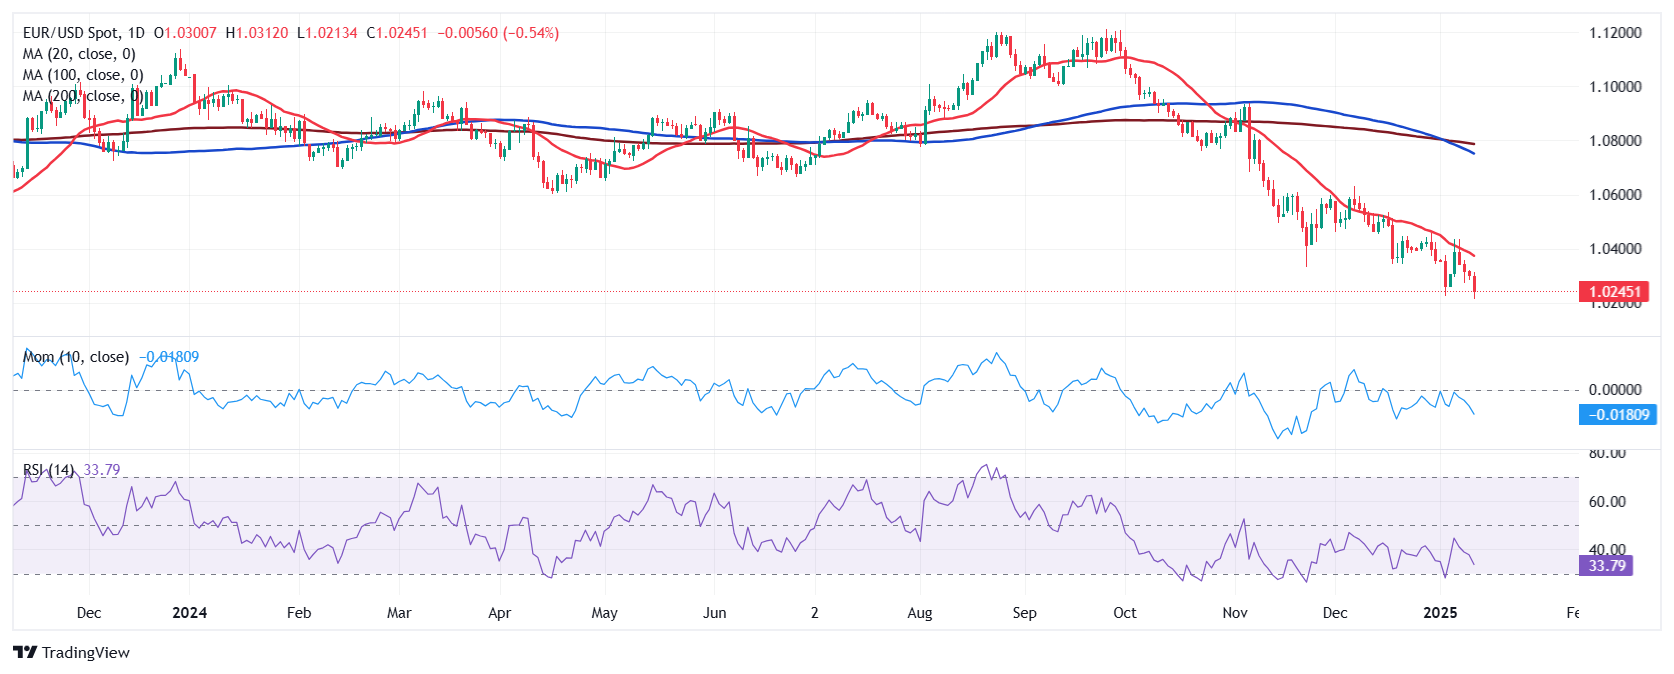
From a technical perspective, the EUR/USD pair is down for a fifth consecutive week and there are no technical signs that suggest an interim bottom is nearby. Indeed, EUR/USD is oversold in the weekly chart, yet the Relative Strength Index (RSI) indicator keeps heading south despite being at 28. The Momentum indicator in the same chart bounced just modestly from extreme levels but remains far below its midline, not enough to suggest an upcoming bounce. Finally, the 20 Simple Moving Average (SMA) has accelerated its slump and crossed below a flat 100 SMA, reflecting sellers’ strength.

In the daily chart, EUR/USD has plenty of room to extend its slide. Technical indicators head south within negative levels, still far from oversold readings. Even further, the EUR/USD pair posted lower lows after a couple of failed attempts to overcome a bearish 20 SMA, currently providing dynamic resistance at around 1.0380. In the same chart, the 100 SMA crossed below the 200 SMA after holding above it for roughly five months. Both moving averages stand around the 1.0800 level, not only anticipating additional slides but also reflecting sellers’ strength.

September 2022 high at 1.0197 is the immediate support level, ahead of the 1.0100 figure. A break below the latter exposes parity, albeit further slides seem unlikely in the upcoming days. The 1.0300 – 1.0330 area provides near-term support ahead of the 1.0400 mark.
 

US Dollar PRICE Last 7 days

The table below shows the percentage change of US Dollar (USD) against listed major currencies last 7 days. US Dollar was the strongest against the British Pound.

  USD EUR GBP JPY CAD AUD NZD CHF
USD   -0.04% 1.03% -0.19% 0.02% 0.52% 0.40% 0.30%
EUR 0.04%   1.05% -0.15% 0.05% 0.54% 0.43% 0.33%
GBP -1.03% -1.05%   -1.16% -0.99% -0.50% -0.61% -0.71%
JPY 0.19% 0.15% 1.16%   0.20% 0.69% 0.58% 0.48%
CAD -0.02% -0.05% 0.99% -0.20%   0.48% 0.38% 0.28%
AUD -0.52% -0.54% 0.50% -0.69% -0.48%   -0.11% -0.21%
NZD -0.40% -0.43% 0.61% -0.58% -0.38% 0.11%   -0.10%
CHF -0.30% -0.33% 0.71% -0.48% -0.28% 0.21% 0.10%  

The heat map shows percentage changes of major currencies against each other. The base currency is picked from the left column, while the quote currency is picked from the top row. For example, if you pick the US Dollar from the left column and move along the horizontal line to the Japanese Yen, the percentage change displayed in the box will represent USD (base)/JPY (quote).

 

Source link

13 01, 2025

Prime Shred Fat Burner for Men Now Available from

By |2025-01-13T15:34:33+02:00January 13, 2025|Dietary Supplements News, News|0 Comments


PrimeShred #FatBurner #MensHealth #Fitness #HealthnutritionLimited

Prime Shred Fat Burner for Men Now Available from Healthnutrition Limited

A powerful new fat-burning supplement designed to help men achieve their weight loss and fitness goals.

Maximize Your Fat-Burning Potential with Prime Shred

Healthnutrition Limited is thrilled to announce the release of Prime Shred, a groundbreaking fat burner formulated specifically for men. Prime Shred combines a potent blend of natural ingredients to accelerate fat loss, boost energy, and enhance mental focus. This innovative supplement is designed to help men achieve their weight loss and fitness goals more effectively and efficiently.

Prime Shred’s powerful formula includes ingredients such as green tea extract, caffeine anhydrous, and L-theanine, which work together to increase thermogenesis, boost metabolism, and promote fat burning. The addition of natural nootropics helps improve mental clarity and focus, making it easier for users to stay motivated and committed to their fitness journey.

Prime Shred is produced in a GMP-certified facility, ensuring the highest quality and safety standards. With no artificial additives or preservatives, Prime Shred is a clean and effective solution for men looking to achieve a leaner, more defined physique.

Visit here for more info – https://www.mnqhs02jd.com/3D7DCMD4/3QQG7/

Health Nutrition Limited, 1 & 2 Heritage Park, Hayes Way, Cannock, Staffordshire, WS11 7LT , United Kingdom – Healthnutrition Limited is excited to announce the availability of Prime Shred, a new fat burner for men, now available for purchase online and at select retailers.

Prime Shred is designed to provide a comprehensive approach to fat loss for men. Its unique blend of ingredients works synergistically to boost metabolism, increase thermogenesis, and enhance energy levels. By supporting the body’s natural fat-burning processes, Prime Shred helps users achieve their weight loss goals more efficiently.

In addition to its fat-burning properties, Prime Shred also enhances mental focus and clarity. The inclusion of natural nootropics helps users stay motivated and on track with their fitness goals. With consistent use, Prime Shred can help men achieve a leaner, more sculpted physique and improved overall health.

Click here to learn more – https://www.mnqhs02jd.com/3D7DCMD4/3QQG7/

Primeshred facts

Accelerates fat loss

Boosts metabolism and thermogenesis

Increases energy levels

Enhances mental focus and clarity

Contains natural ingredients

Manufactured in a GMP-certified facility

No artificial additives or preservatives

Company description:

About Healthnutrition Limited:

Healthnutrition Limited is a leading provider of premium nutritional supplements. Dedicated to innovation and quality, the company offers a wide range of products to support health and wellness. Healthnutrition Limited’s mission is to help individuals achieve their fitness goals and lead healthier lives through scientifically-backed supplements.

Contact information:

+1 (888) 270-3240 (USA)

support@healthnutrition.com

Hashtags:

PrimeShred #FatBurner #MensHealth #Fitness #HealthnutritionLimited

Contact details

+1 (888) 270-3240 (USA)

support@healthnutrition.com

Write to us

Health Nutrition Limited

1 & 2 Heritage Park,

Hayes Way,

Cannock,

Staffordshire,

WS11 7LT

United Kingdom

About Healthnutrition Limited:

Healthnutrition Limited is a leading provider of premium nutritional supplements. Dedicated to innovation and quality, the company offers a wide range of products to support health and wellness. Healthnutrition Limited’s mission is to help individuals achieve their fitness goals and lead healthier lives through scientifically-backed supplements.

This release was published on openPR.


Source link

13 01, 2025

3 Reasons Why It’s Happening

By |2025-01-13T15:33:25+02:00January 13, 2025|Crypto News, News|0 Comments

Cover image via www.freepik.com

Disclaimer: The opinions expressed by our writers are their own and do not represent the views of U.Today. The financial and market information provided on U.Today is intended for informational purposes only. U.Today is not liable for any financial losses incurred while trading cryptocurrencies. Conduct your own research by contacting financial experts before making any investment decisions. We believe that all content is accurate as of the date of publication, but certain offers mentioned may no longer be available.

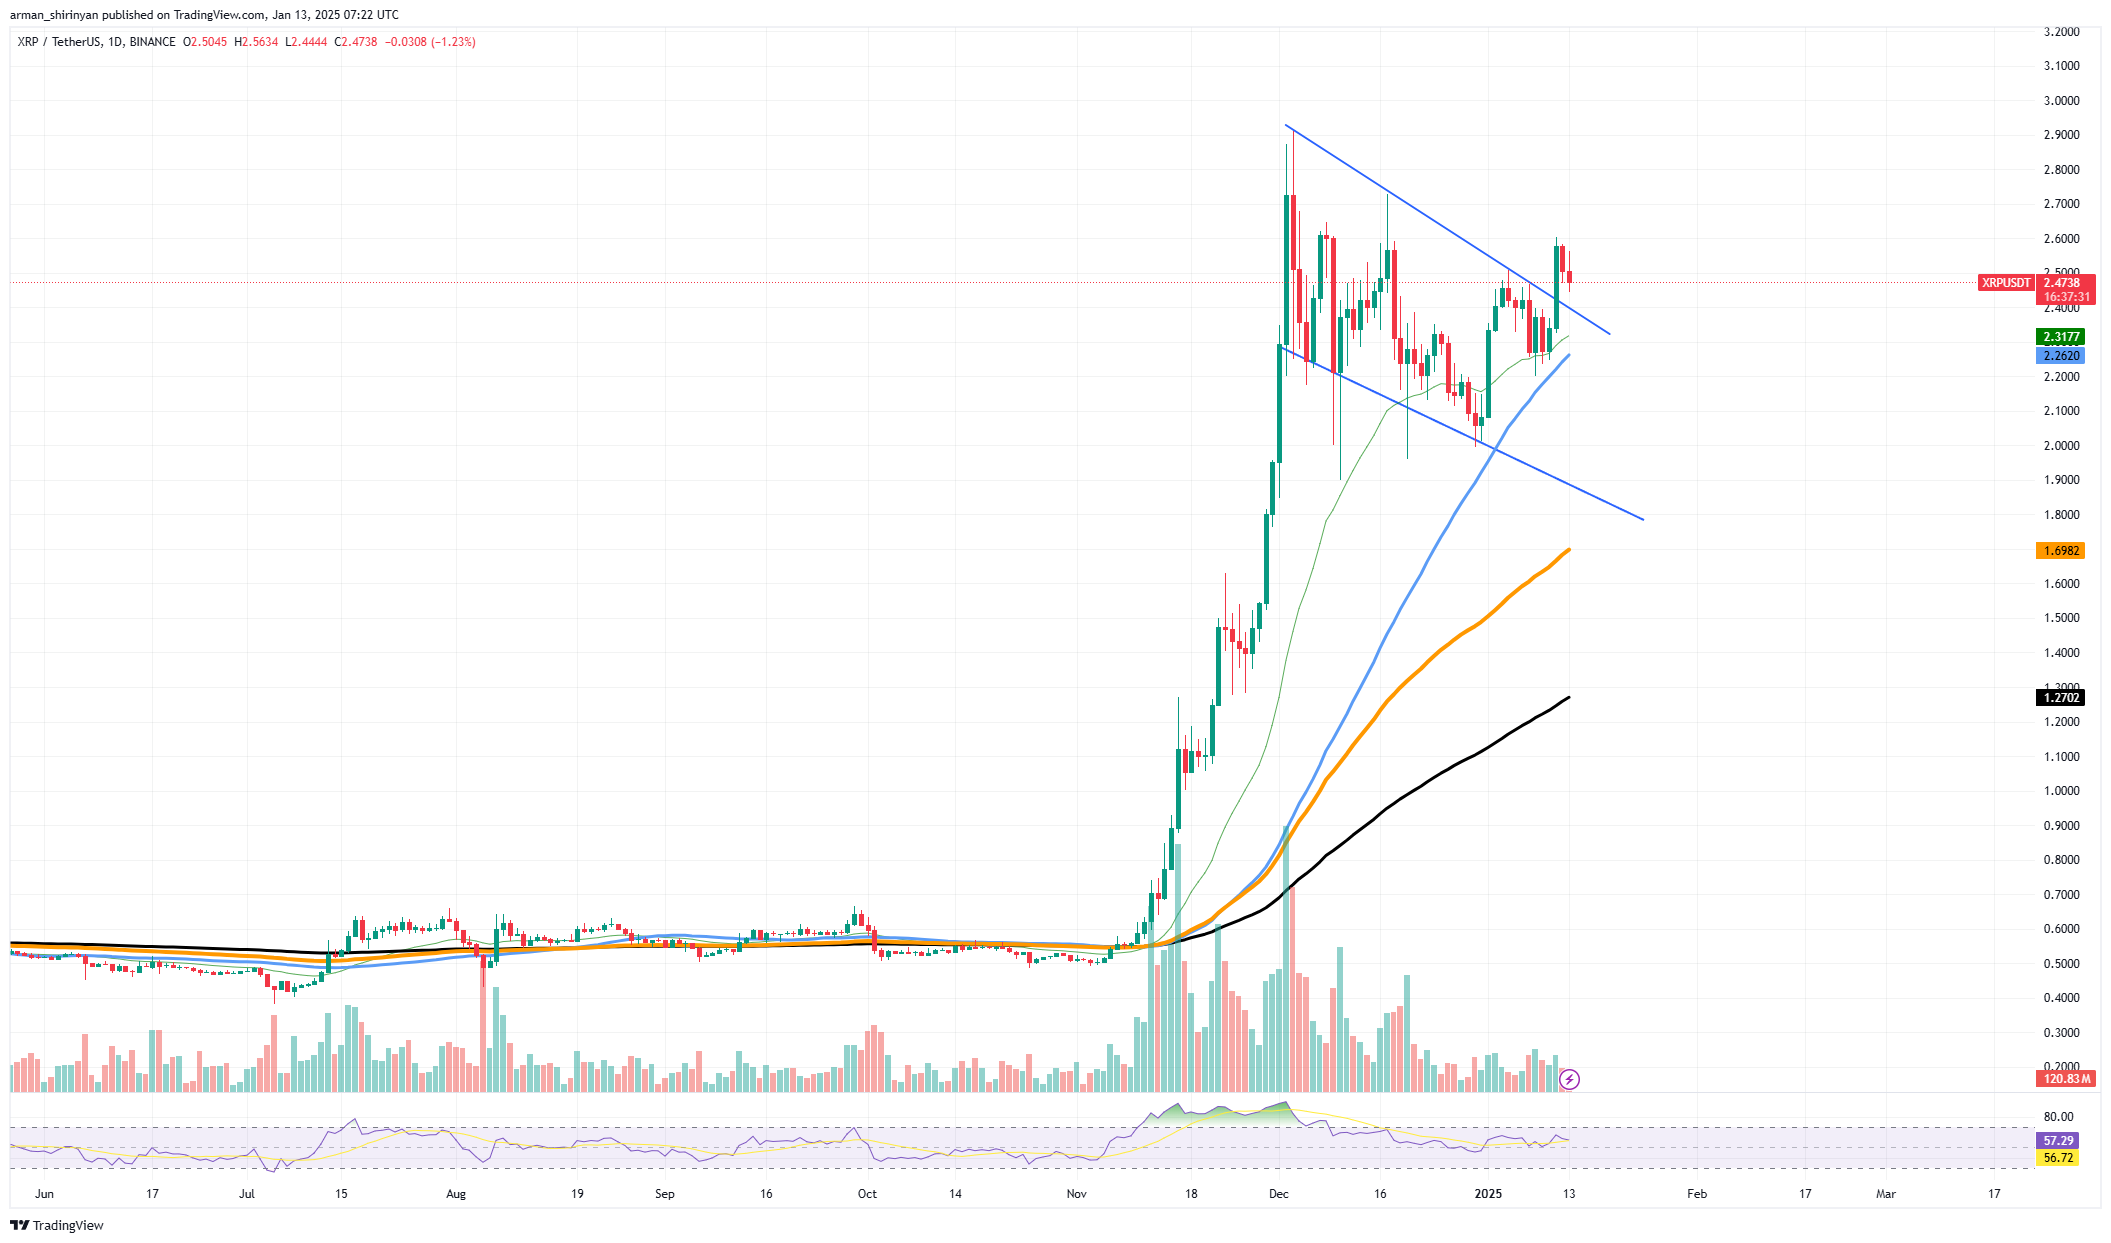
Following XRP‘s recent breakout above a crucial descending trendline, traders were expecting a big rally. However, the asset’s price is reversing back toward $2.40, suggesting that it is losing steam rather than gaining it. Let’s investigate the causes of this sudden slowdown and its potential implications for the market.

Even though XRP was able to break through the downward trendline, the rally was unable to maintain its upward momentum. This suggests that after the breakout, there was not much buying pressure, which is essential for sustaining a rally. XRP is now more susceptible to selling pressure because it has been unable to close firmly above $2.50, which has undermined bullish confidence. 

Article image
XRP/USDT Chart by TradingView

There is a derisking phase going on on the larger cryptocurrency market as traders lock in gains from recent rallies. This pattern is especially apparent on assets like XRP that have already produced sizable gains. By restricting capital inflow into XRP, the decreased appetite for risk is further impeding the price growth of the cryptocurrency.

Related

JPMorgan CEO Doesn’t Feel Great About Bitcoin

Near $2.60, XRP encounters a sizable overhead resistance that has impeded its upward trajectory. The combination of this resistance and the drop in volume indicates that traders are reluctant to raise the price in the absence of more potent catalysts. A crucial support area to keep an eye on on the downside is the $2.30 level, which corresponds to the 50 EMA. 

If XRP breaks through this barrier, it may retest lower supports at $1.20 or even $1.69. At the moment, the RSI is neutral at about 57, indicating that the market is unsure. XRP could lose more ground if selling pressure persists, especially if the market is still cautious overall. A robust recovery from the $2.30 support level, however, might rekindle optimism and present a chance for another breakout attempt. 

The performance of XRP for the time being will be mostly determined by the state of the market as a whole and the asset’s capacity to draw in new buyers. Traders can predict the next move by keeping a close eye on important support and resistance levels.

Source link

13 01, 2025

XAG/USD slumps to near $30 as traders reassess Fed’s interest rate outlook

By |2025-01-13T14:40:44+02:00January 13, 2025|Forex News, News|0 Comments


  • Silver price tumbles to near $30.00 as US bond yields rise after traders pare Fed dovish bets.
  • US bond yields surge after the release of the surprisingly upbeat US NFP data for December.
  • The overall outlook of the Silver price remains upbeat amid risk-off market sentiment.

Silver price (XAG/USD) falls sharply to near $30.00 after failing to extend its upside above the key hurdle of $30.60 in Monday’s European session. The white metal weakens as the US bond yields strengthens, with market participants reassessing their expectations for the Federal Reserve’s (Fed) monetary policy outlook after the release of the United States (US) Nonfarm Payrolls (NFP) data for December.

10-year US Treasury yields post fresh yearly high to near 4.80% as traders have pared Fed dovish bets after the release of the surprisingly upbeat labor market data. Higher yields on interest-bearing assets weigh on non-yielding assets, such as Silver, as they result in higher opportunity costs for them. The US Dollar Index (DXY), which tracks the Greenback’s value against six major currencies, posts a fresh two-year high above 110.00.

According to the CME FedWatch tool, the Fed is expected to keep interest rates unchanged in the current range of 4.25%-4.50% atleast in the next three policy meetings.

Meanwhile, the broader outlook of the Silver price remains firm as the market sentiment is bearish amid uncertainty over the incoming trade policies under the administration of US President-elect Donald Trump. The appeal of non-yielding assets strengthens in a highly uncertain environment.

This week, investors will focus on the US Consumer Price Index (CPI) data for December, which will be published on Wednesday.

Silver technical analysis

Silver price continues to face selling pressure near the 50-day Exponential Moving Average (EMA), which trades near $30.35. The white metal remains below the upward-sloping trendline around $30.50 on a daily timeframe, which is plotted from the February 29 low of $22.30

The 14-day Relative Strength Index (RSI) oscillates inside the 40.00-60.00 range, suggesting a sideways trend.

Looking down, the September low of $27.75 would act as key support for the Silver price. On the upside, the December 12 high of $32.33 would be the barrier.

Silver daily chart

Silver FAQs

Silver is a precious metal highly traded among investors. It has been historically used as a store of value and a medium of exchange. Although less popular than Gold, traders may turn to Silver to diversify their investment portfolio, for its intrinsic value or as a potential hedge during high-inflation periods. Investors can buy physical Silver, in coins or in bars, or trade it through vehicles such as Exchange Traded Funds, which track its price on international markets.

Silver prices can move due to a wide range of factors. Geopolitical instability or fears of a deep recession can make Silver price escalate due to its safe-haven status, although to a lesser extent than Gold’s. As a yieldless asset, Silver tends to rise with lower interest rates. Its moves also depend on how the US Dollar (USD) behaves as the asset is priced in dollars (XAG/USD). A strong Dollar tends to keep the price of Silver at bay, whereas a weaker Dollar is likely to propel prices up. Other factors such as investment demand, mining supply – Silver is much more abundant than Gold – and recycling rates can also affect prices.

Silver is widely used in industry, particularly in sectors such as electronics or solar energy, as it has one of the highest electric conductivity of all metals – more than Copper and Gold. A surge in demand can increase prices, while a decline tends to lower them. Dynamics in the US, Chinese and Indian economies can also contribute to price swings: for the US and particularly China, their big industrial sectors use Silver in various processes; in India, consumers’ demand for the precious metal for jewellery also plays a key role in setting prices.

Silver prices tend to follow Gold’s moves. When Gold prices rise, Silver typically follows suit, as their status as safe-haven assets is similar. The Gold/Silver ratio, which shows the number of ounces of Silver needed to equal the value of one ounce of Gold, may help to determine the relative valuation between both metals. Some investors may consider a high ratio as an indicator that Silver is undervalued, or Gold is overvalued. On the contrary, a low ratio might suggest that Gold is undervalued relative to Silver.


Source link

13 01, 2025

Catch up with our weekly round-up of key news from across the Nutraverse.

By |2025-01-13T13:33:13+02:00January 13, 2025|Dietary Supplements News, News|0 Comments


This week’s big news across the global nutrition and supplements industries includes the sale of BASF’s health ingredients business, new research showing the benefits of probiotics for sleep in elite athletes and Zooca eyeing opportunities in China.

Italy/ USA: Probiotics may boost sleep and recovery for elite athletes and general population

A multi-strain probiotic consortium may improve sleep quality and exercise recovery for elite Italian soccer players, with similar results observed in a cohort of people in the general U.S. population, says a new study conducted by scientists from Palermo Football Club and FitBiomics.

Results of an open-label study in 257 people in the general population revealed that 94% of the participants reported notable health improvements after two weeks of supplementation with the commercial Nella product, particularly in sleep quality, energy and post-exercise recovery.

These results were then validated in a placebo-controlled longitudinal study with elite Italian soccer players from a professional Serie B team. Data indicated that a combination of three athlete-derived probiotic strains, Lactiplantibacillus platarum FB00015, Lacticaseibacillus rhamnosus FB00047 and Lactobacillus acidophilus FB00012 was associated with significant improvements in self-reported sleep quality, energy levels and bowel movements.

Read the full story HERE.

Europe: Louis Dreyfus Company to acquire BASF’s health ingredients business

BASF announced it is selling its Food and Health Performance Ingredients business to Louis Dreyfus Company, including a production site and state-of-the-art R&D center in Germany.

The deal, which was announced on Dec. 23, 2024, includes a health ingredients portfolio that offers plant sterols esters, conjugated linoleic acid (CLA) and omega-3 oils for human nutrition, as well as food performance ingredients such as aeration and whipping agents, food emulsifiers and fat powder grades.

“This agreement is an opportunity to accelerate LDC’s participation in the rapidly growing plant-based ingredients market,” said Michael Gelchie, CEO of Louis Dreyfus Company.

“We are excited about the prospect of this transaction, as LDC’s first investment in dedicated facilities to produce food and health performance ingredients at scale.”

Read the full story HERE.

China: Zooca has big plans in Asia for tiny zooplankton species

Norway’s Zooca says that Calanus finmarchicus, a tiny zooplankton, could meet cardiovascular and healthy aging needs in China.

“It’s a unique three-in-one combination of fatty acids, fatty alcohols and high levels of naturally occurring astaxanthin,” explained Zooca’s chief sales officer Ole Sakkestad. “The oil contains about 40 different fatty acids, including omega-3s, which makes up about a quarter of the oil composition.

“The rest is made up of other fatty acids like omega-7 and omega-11. Calanus finmarchicus is also the only marine resource known to contain the fatty alcohol policosanol.”

The benefits of Calanus oil align with trending concerns in China, according to a recent report by NutraIngredients-Asia. These include healthy and anti-aging, as well as the three hypers associated with cardiovascular health—hypertension, hyperlipidaemia and hyperglycaemia.

Zooca has devised a dual B2B and B2C strategy to enter the Chinese market.

Read the full story HERE.


Source link

13 01, 2025

A Strong V-Shaped Recovery on the Horizon for SOL

By |2025-01-13T13:32:14+02:00January 13, 2025|Crypto News, News|0 Comments

Solana (SOL) has recently been making headlines with a remarkable V-shaped recovery, showing resilience in the face of market volatility. Traders have been closely monitoring the token’s price action, which is displaying promising signs of further upside potential. A combination of technical indicators and fundamental data suggests that Solana could be poised for a significant bullish rally in the near term. Here’s a detailed look at the factors influencing SOL’s price action and what traders can expect moving forward.

Strong Bounce from Key Support Level

Solana’s price has seen an impressive rebound from a critical support level around $179.66. This level is notably aligned with the 61.8% Fibonacci retracement zone, a key area that often marks the end of bearish trends and signals the beginning of a reversal. Historically, this zone acts as a magnet for buyers, especially when bearish pressure begins to fade, and it seems to have done just that for Solana.

The recent bounce from this level validates the $179.66 support as a strong floor for the token, suggesting that Solana’s price could continue to trend upward in the coming weeks. Traders are eyeing potential bullish targets of $254.35, $302.02, and $345.76, which align with the Fibonacci extensions. These levels represent key resistance points where Solana could encounter selling pressure if it continues its upward momentum.

Positive Market Structure and Higher Lows

Solana’s overall market structure is looking increasingly positive as the token forms higher lows following the recovery from $179.66. This indicates renewed buyer interest and suggests that momentum could build in the weeks ahead. As long as the price holds above this support level, the potential for a breakout to new highs remains strong.

A break below $179.66 would invalidate the bullish setup, leading to a potential downside move. However, if market sentiment continues to favor the altcoin, Solana could move towards its first target of $254.35 in the near term, reinforcing the case for a V-shaped recovery.

MVRV Ratio: Signaling Recovery Phase

Solana’s Market Value to Realized Value (MVRV) ratio is another key metric providing insight into the token’s recovery. At the time of writing, the MVRV ratio is steadily climbing, suggesting that most investors who entered during previous accumulation phases are either at break-even or slightly in profit. This indicates that the token is in the midst of a recovery phase, with new buyers entering the market.

The MVRV ratio has remained in a neutral zone, reflecting neither overvaluation nor undervaluation of the asset. This suggests that there is optimism in the market, with more investors beginning to buy into Solana as it recovers from the $179.66 support. If the MVRV ratio continues to rise, it could signal increased confidence in Solana’s price momentum, aligning with the bullish targets indicated by the Fibonacci analysis.

However, traders should remain cautious if the MVRV ratio spikes into overbought territory. This could signal a period of profit-taking, which may cause short-term pullbacks. A sustained MVRV ratio between 1.0 and 2.5 would suggest continued bullish momentum.

RSI: Neutral-to-Bullish Sentiment

The Relative Strength Index (RSI) is another crucial indicator for assessing Solana’s price action. The recent RSI readings have indicated that Solana is currently in a neutral-to-bullish zone, with values trending between 55 and 60. This range suggests that Solana is not yet overbought, leaving room for further upward movement without triggering a reversal.

In previous rallies, Solana’s RSI has often peaked around the 70-75 range before experiencing pullbacks. Given that the current RSI is still in the neutral zone, there is ample room for the token to rise further without becoming overheated. This supports the case for a continued bullish trend, as Solana has not yet reached the overbought levels that could signal a reversal.

A Robust Case for a Bullish Rally

Overall, Solana’s technical and fundamental indicators are aligning to create a strong case for a bullish rally. Key support at $179.66, combined with Fibonacci retracement levels, a rising MVRV ratio, and a neutral-to-bullish RSI, all point to a potential continuation of the recovery. The V-shaped price action observed over the past few weeks highlights the resilience of the token and the growing optimism among traders.

As long as Solana can maintain support at $179.66, the altcoin could target its first major resistance at $254.35, with further upside potential to $302.02 and $345.76. Traders should closely monitor the MVRV ratio and RSI to gauge market sentiment and adjust their positions accordingly.

Conclusion: Preparing for Potential Upside

Solana’s recovery has been impressive, and the technical indicators suggest that there is more room for growth. With a strong support level at $179.66, bullish Fibonacci targets, and positive momentum in the MVRV ratio and RSI, Solana is positioning itself for a potential V-shaped recovery in the near term.

However, as always, traders should stay vigilant and watch for any shifts in market sentiment that could impact the token’s price action. If Solana continues to build on its recent recovery, it could deliver significant returns for investors in the coming weeks.


Post Views: 2

Source link

13 01, 2025

Oil Traders Cautiously Bullish as Prices Hit October Highs

By |2025-01-13T12:39:14+02:00January 13, 2025|Forex News, News|0 Comments


Crude oil futures reached their highest levels since October earlier this week, and the momentum wasn’t slowing as of Friday morning. WTI and Brent were trading at $74.58 and $77.59 respectively at the time of writing, with traders assessing the interplay of seasonal demand, supply constraints, and mixed inventory data as the week draws to a close. Despite the recent rise in prices, traders remain cautious about balancing tightening supply and uncertain demand signals.

Supply Constraints Drive Upward Pressure

Supply-side factors were critical in shaping crude oil’s price movements this week. OPEC production dropped by 50,000 barrels per day (bpd) in December, largely due to maintenance in the UAE and declining Iranian output. These reductions align with OPEC+’s broader commitment to cut production, ensuring supply remains constrained. Saudi Arabia and Iraq maintained steady production levels, adhering to the cartel’s strategy to limit global availability.

Adding to the supply squeeze, Western sanctions on Russian crude shipments continued to bite. Efforts by the Biden administration to restrict Russian exports, coupled with expectations of a 300,000 bpd decline in Iranian production, amplified concerns over global supply. These geopolitical factors have reinforced support for prices, even as demand uncertainties loom.

Winter Weather Fuels Seasonal Demand

Colder-than-expected weather across the U.S. and Europe has sharply increased demand for heating…

Crude oil futures reached their highest levels since October earlier this week, and the momentum wasn’t slowing as of Friday morning. WTI and Brent were trading at $74.58 and $77.59 respectively at the time of writing, with traders assessing the interplay of seasonal demand, supply constraints, and mixed inventory data as the week draws to a close. Despite the recent rise in prices, traders remain cautious about balancing tightening supply and uncertain demand signals.

Supply Constraints Drive Upward Pressure

Supply-side factors were critical in shaping crude oil’s price movements this week. OPEC production dropped by 50,000 barrels per day (bpd) in December, largely due to maintenance in the UAE and declining Iranian output. These reductions align with OPEC+’s broader commitment to cut production, ensuring supply remains constrained. Saudi Arabia and Iraq maintained steady production levels, adhering to the cartel’s strategy to limit global availability.

Adding to the supply squeeze, Western sanctions on Russian crude shipments continued to bite. Efforts by the Biden administration to restrict Russian exports, coupled with expectations of a 300,000 bpd decline in Iranian production, amplified concerns over global supply. These geopolitical factors have reinforced support for prices, even as demand uncertainties loom.

Winter Weather Fuels Seasonal Demand

Colder-than-expected weather across the U.S. and Europe has sharply increased demand for heating oil. U.S. refineries, operating at their highest capacity since 2018, have worked to meet this surge in consumption. Analysts from JPMorgan forecast global oil demand in January to grow by 1.4 million bpd year-on-year, fueled by heating needs and early Lunar New Year travel in China.

Despite these seasonal gains, economic concerns have dampened optimism. Softer U.S. factory orders and persistent inflationary pressures in Europe, alongside China’s energy policy uncertainties, have raised questions about the sustainability of industrial and refining demand. For instance, China’s higher fuel oil import taxes could limit future consumption growth.

Conflicting Inventory Data Adds Market Complexity

U.S. inventory reports introduced mixed signals into the market. Early data suggested drawdowns in crude stockpiles, providing initial price support. However, the Energy Information Administration (EIA) released official data showing unexpected increases in gasoline and distillate inventories. These builds applied downward pressure on prices midweek, especially as a stronger U.S. dollar made oil more expensive for international buyers.

The dollar’s strength has been a persistent headwind for crude markets, limiting the ability of prices to sustain gains despite supply concerns. Traders are closely monitoring upcoming inventory reports for further clarity on U.S. demand trends.

Saudi Arabia Signals Confidence With Price Hike

In a notable development, Saudi Aramco raised its official selling prices (OSPs) for February shipments to Asia, marking the first price hike in three months. This move reflects Saudi Arabia’s confidence in the region’s demand resilience and aligns with tightening supply conditions in the Middle East driven by sanctions and production cuts.

The decision underscores the kingdom’s bullish view on market fundamentals and its ability to influence regional pricing power. Strong Asian demand and a constrained supply outlook bolster this position, offering potential support for global crude prices.

Weekly Light Crude Oil Futures

Trend Indicator Analysis

The main trend is down but momentum is trending higher. It will change to up on a trade through $77.36. The minor trend is up, this is controlling the momentum. A close below $73.96 on Friday could have a negative impact on momentum next week.

The long-term range is $87.11 to $60.88. The market is currently straddling its 50% level at $74.00. This is a major pivot. Overtaking this level with conviction could send the market soaring with $77.36 the next target.

The intermediate-term range is $60.88 to $81.33. Its retracement zone at $71.10 to $68.69 is support. The retracement zone is new support.

Weekly Technical Forecast

The direction of the Weekly Light Crude Oil Futures market the week ending January 17 is likely to be determined by trader reaction to $74.00.

Bullish Scenario

A sustained move over $74.00 will signal the presence of strong counter-trend buyers. If this creates enough near-term momentum, we could see potential acceleration into the three major tops at $77.36, $79.61, and $81.33 over the near-term.

Bearish Scenario

A failure to sustain a move over 74.00 will indicate that strong sellers are still controlling the price action. It will also confirm that the market is still in “sell the rally” mode. This could drive prices back into the main support zone at $71.10 to $68.69.

Market Outlook: Moderately Bullish with Caution

Heading into Friday and beyond, crude oil prices are poised for modest gains as tightening supply conditions, supported by OPEC+ cuts and geopolitical risks, continue to underpin the market. Seasonal demand and robust refinery activity in the U.S. provide additional tailwinds for prices.

However, traders remain cautious. Inventory builds, global economic uncertainties, and a stronger dollar could temper upside momentum. Any unexpected demand weakness or larger-than-anticipated inventory increases may further cap potential gains.

For now, the market leans cautiously bullish, with supply constraints and seasonal factors providing critical support. Traders will watch for signals from inventory reports and economic data for clearer direction.

Technically, the weekly direction will be determined by trader reaction to the major pivot at $74.00. Bullish over this level, cautiously bearish under it.


Source link

13 01, 2025

Reducing stroke risk and other health benefits of green tea

By |2025-01-13T11:29:49+02:00January 13, 2025|Dietary Supplements News, News|0 Comments


A doctor of integrative medicine says drinking green tea can help reduce a person’s risk of having a stroke.

Studies have shown green tea boosts immunity and cognitive function.

“I drink green tea because of its antioxidant benefits, especially from catechins like EGCG. Heart disease runs in my family so I’m always looking for ways to mitigate that risk.” says Dr. Katie Takayasu.

She says data suggests that for women, drinking several cups of green tea can help prevent plaque build-up in the carotid arteries, which are located on each side of a person’s neck. An ultrasound is needed to assess plaque formation.

“A lot of women don’t get that area scanned unfortunately and it’s often missed as a risk factor. The biggest concern would be that plaque can break off and then travel to the brain and would prevent blood flow to the brain, which would then result in a stroke,” says Takayasu.

Research has found that a key compound in the tea plant called polyphenols are the main force behind its benefits. Green tea also provides people with a less caffeinated pick-me-up. Three green teas are equivalent to less than the caffeine in one cup of coffee.


Source link

13 01, 2025

Here’s How High DOGE Could Go If Bitcoin Reaches $13M

By |2025-01-13T11:28:33+02:00January 13, 2025|Crypto News, News|0 Comments

The Dogecoin price could reach an audacious two-digit figure if it follows Bitcoin’s path as Bitcoin targets the $13 million goal.

Saylor: Bitcoin to $13 Million 

For context, the $13 million goal was conceived by MicroStrategy Chairman and Bitcoin bull Michael Saylor last year. Speaking with CNBC’s Squawk Box last September, Saylor boldly predicted that Bitcoin could reach $13 million in 2045, twenty years from now.

His prediction came at a time when Bitcoin was battling to conquer the $60,000 price territory after relinquishing it in August 2024. At the time of Saylor’s prediction, Bitcoin changed hands around $58,000. However, this battle at the $60,000 region did not discourage the Bitcoin advocate.

Notably, Saylor’s bullish stance on Bitcoin indirectly translates to a bullish stance on the broader crypto market despite him being a Bitcoin maxi. This is due to the close correlation between Bitcoin and the rest of the crypto market, particularly the top altcoins.

Dogecoin Price Correlation with Bitcoin

For instance, CoinMarketCap data indicates that Dogecoin price has followed Bitcoin’s direction over the past week amid the ongoing market uncertainty. However, the leading meme coin witnesses more substantial declines and gains due to its higher volatility.

Here’s How High DOGE Could Go If Bitcoin Reaches M
Dogecoin and Bitcoin Price Correlation

This close price relationship confirms that altcoins like Dogecoin are likely to benefit greatly should Bitcoin reach the ambitious $13 million price target set by Michael Saylor. 

To put things into perspective, Bitcoin currently trades for $94,250, down nearly 5% in the last seven days. For the crypto asset to reach the $13 million goal, it will have to rally by a massive 13,693%. Further, an increase from $94,250 to $13 million translates to a CAGR of 27.9% over a twenty-year period.

Dogecoin Price if BTC Hits $13M

If Dogecoin’s price follows Bitcoin’s trajectory and witnesses a similar growth rate, its price would spike by 13,693% in the next twenty years. With DOGE currently changing hands at $0.3325 at press time, a 13,693% gain would lead to $45.86.

Given Bitcoin’s and Dogecoin’s historical price performances, a CAGR of 27.9% remains highly feasible. For context, Bitcoin witnessed a 120.9% annual increase in 2024 alone, mostly due to its upsurge in Q1 and Q4. Meanwhile, DOGE saw a more substantial 252.8% rise in 2024.

Nonetheless, bear market years could dampen this projected growth. Despite this, price spikes during bull runs might make up for the increase that these crypto assets could record in a few years, considering the CAGR of 27.9%. 

DisClamier: This content is informational and should not be considered financial advice. The views expressed in this article may include the author’s personal opinions and do not reflect The Crypto Basic opinion. Readers are encouraged to do thorough research before making any investment decisions. The Crypto Basic is not responsible for any financial losses.

Source link

13 01, 2025

Dives to its lowest level since November 2023 amid relentless USD buying

By |2025-01-13T09:31:19+02:00January 13, 2025|Forex News, News|0 Comments

  • GBP/USD continues losing ground for the fifth straight day and drops to over a one-year low.

  • Stagflation fears and UK fiscal concerns continue to weigh on the GBP amid a bullish US Dollar.

  • A slightly oversold RSI on the daily chart warrants some caution for aggressive bearish traders. 

The GBP/USD pair remains under heavy selling pressure for the fifth straight day and dives to its lowest level since November 2023, around the 1.2125 region during the Asian session on Monday. Moreover, the fundamental backdrop seems tilted in favor of bearish traders, though slightly oversold conditions on the daily chart warrant some caution before positioning for further losses.

Investors remain concerned about the risk of stagflation in the UK. This, along with the anxiety about the UK’s fiscal health, turn out to be key factors contributing to the British Pound’s (GBP) relative underperformance. Apart from this, the underlying strong bullish sentiment surrounding the US Dollar (USD), bolstered by firming expectations that the Federal Reserve (Fed) will pause its rate-cutting cycle, validates the negative outlook for the GBP/USD pair. 

From a technical perspective, the Relative Strength Index (RSI) on the daily chart has dropped below the 30 mark, making it prudent to wait for some near-term consolidation or a modest rebound before the next leg down. Any attempted recovery, however, might confront resistance and remain capped near the 1.2200 mark. That said, some follow-through buying beyond the Asian session top, around the 1.2210 area, could trigger a short-covering move. 

The GBP/USD pair might then accelerate the positive move towards the 1.2245-1.2250 intermediate hurdle before aiming to reclaim the 1.2300 round figure. The latter should act as a key pivotal point, which if cleared decisively could negate the negative bias and shift the near-term bias in favor of bullish traders. 

Meanwhile, the downward trajectory seems strong enough to drag the GBP/USD pair further towards testing sub-1.2100 levels, or the November 2023 low. Acceptance below the said handle could make spot prices vulnerable to decline further towards October 2023 through, around the 1.2035 region, en route to the 1.2000 psychological mark.

GBP/USD daily chart

US Dollar PRICE Today

The table below shows the percentage change of US Dollar (USD) against listed major currencies today. US Dollar was the strongest against the British Pound.


  USD EUR GBP JPY CAD AUD NZD CHF
USD   0.29% 0.56% -0.24% 0.12% 0.20% 0.18% 0.06%
EUR -0.29%   0.25% -0.47% -0.11% 0.06% -0.05% -0.14%
GBP -0.56% -0.25%   -0.73% -0.35% -0.21% -0.30% -0.39%
JPY 0.24% 0.47% 0.73%   0.35% 0.36% 0.28% 0.31%
CAD -0.12% 0.11% 0.35% -0.35%   0.04% 0.06% 0.03%
AUD -0.20% -0.06% 0.21% -0.36% -0.04%   -0.13% -0.18%
NZD -0.18% 0.05% 0.30% -0.28% -0.06% 0.13%   -0.09%
CHF -0.06% 0.14% 0.39% -0.31% -0.03% 0.18% 0.09%  

The heat map shows percentage changes of major currencies against each other. The base currency is picked from the left column, while the quote currency is picked from the top row. For example, if you pick the US Dollar from the left column and move along the horizontal line to the Japanese Yen, the percentage change displayed in the box will represent USD (base)/JPY (quote).

 

Source link

Go to Top