This was originally a post from GamesTX substack, with all the data being from 1st January 2025.
Lots of things happened in blockchain gaming in 2024, but we can summarize the key trends in the following charts.
Top gaming tokens did not perform well
Looking at the largest gaming tokens in terms of their market cap, only five of the top 14 saw their price increase during 2024. Community memecoin SUPER was the only token to see significant price growth — up 114%.
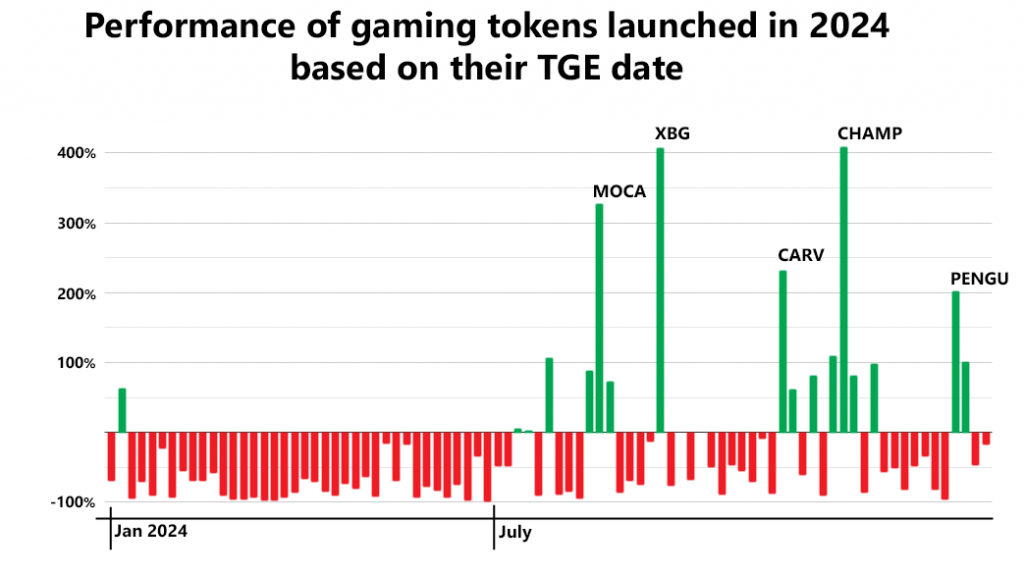
Lots of gaming tokens launched but most performed badly
2024 saw the launch of dozens of new (small cap) gaming tokens, especially in the first half of the year. However, the best performing new tokens came from projects which launched in the second half of the year, of which five saw their price increase by more than 200%. This growth was mainly driven by the change in crypto sentiment following Donald Trump’s election victory in November.
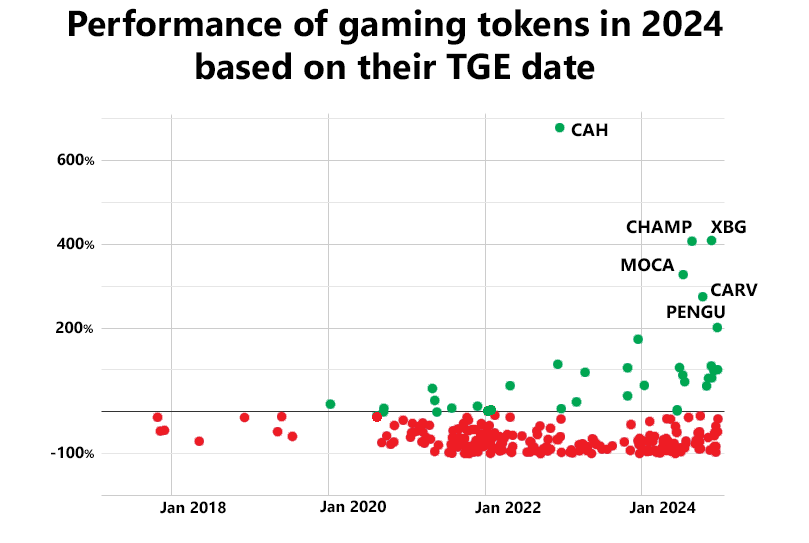
Newer tokens performed better over long timeframes
Looking more generally at all gaming tokens, the vast majority of the top performers during 2024 were launched in 2024. Basically, the newer the token, the better its performance was likely to be. Older projects are not capturing current imaginations.
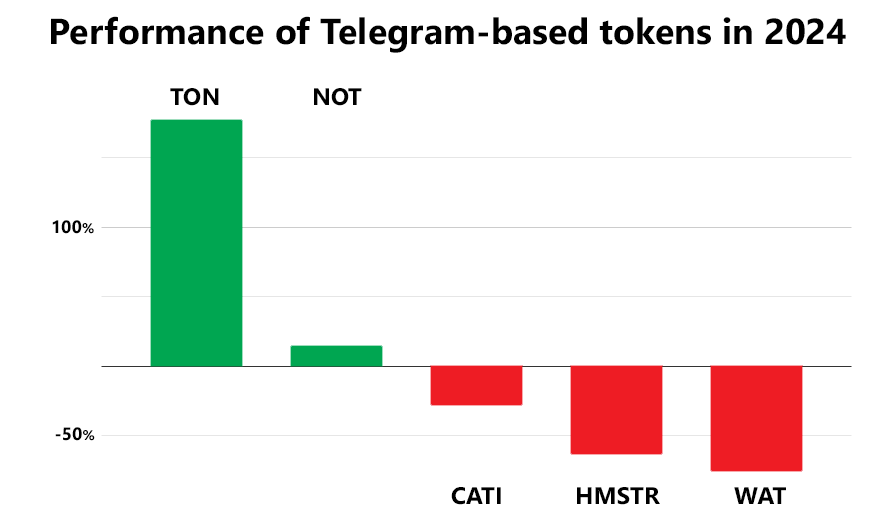
TON gaming tokens didn’t perform any better
One of 2024’s big trends was the rise of Telegram and its TON blockchain as a strong marketing channel for simple crypto games. However, with the exception of the original NOT memecoin, gaming tokens on TON did not demonstrate positive price dynamics.
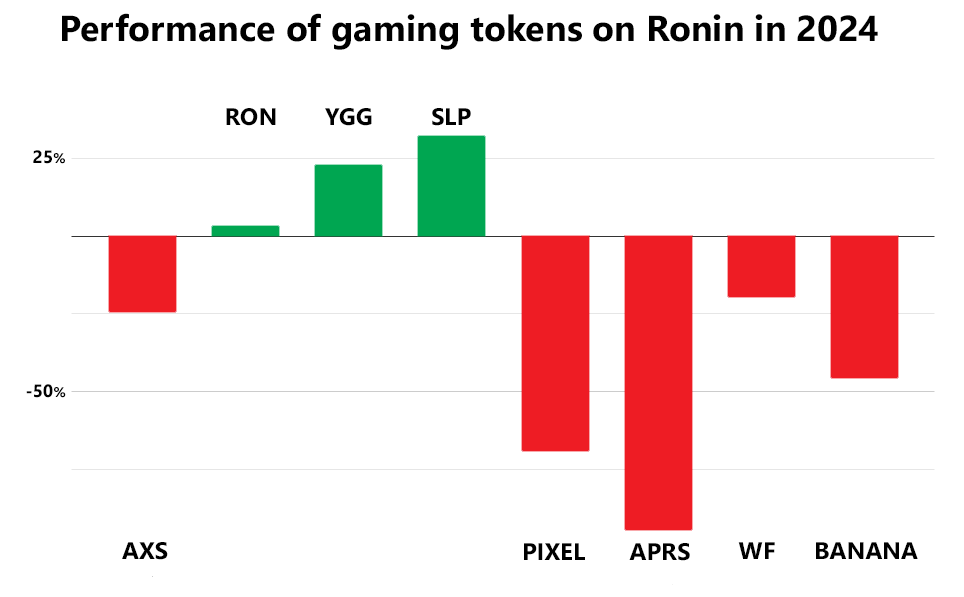
Ronin was the #1 chain for gaming. Its tokens performed badly
Within the gaming sector, the Ronin blockchain was generally considered to have the strongest ecosystem. However, most of its games’ tokens performed badly, even Pixels, which was the most popular game of 2024 in terms of its daily activity.
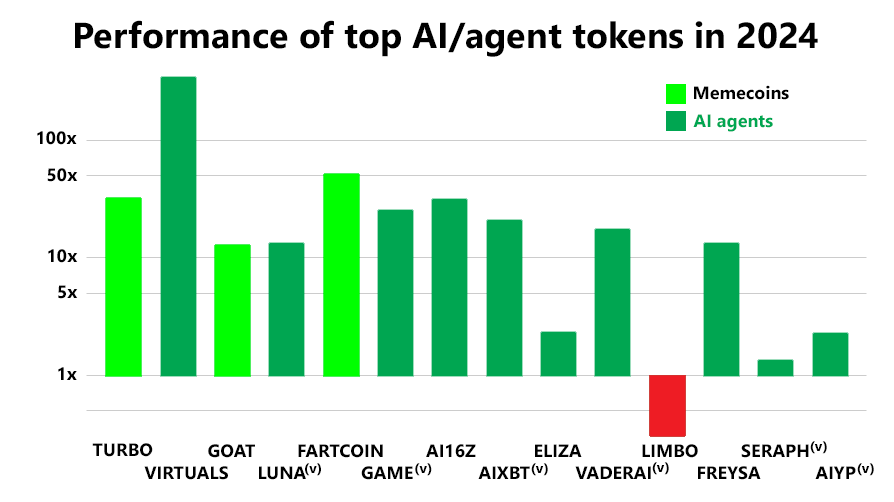
Tokens related to AI performed spectacularly well
In stark comparison, the performance of AI-related memecoins and tokens launched by AI agents through platforms such as Virtuals saw explosive price growth during December.
Many saw their prices rising more than 10-fold, with VIRTUALS being the top performer, with its price up 34,130% — 342-fold — during 2024.
Clearly, the attempt to integrate this meta into gaming will be the one that will dominate the opening months of 2025; something we’re already seeing from the likes of Today, Planet Mojo, Goat Gaming, Faraway Games and Parallel.
Sign up for GamesTX – free weekly, paid daily – here.
Gold price turns defensive near $2,650 early Wednesday, awaiting US ADP and Fed Minutes.
The US Dollar pauses upswing alongside Treasury bond yields despite a softer risk tone.
Gold price looks north amid a firm break above 50-day SMA and as RSI regains positive territory.
Gold price is consolidating the previous rebound near $2,650 early Wednesday, awaiting the US ADP jobs report and the Minutes of the US Federal Reserve (Fed) December meeting for the next leg higher.
Following the latest upbeat US economic data releases, Gold price fails to sustain at higher levels, courtesy of the hawkish expectations surrounding the Fed. The JOLTS survey showed Tuesday that US job openings in November climbed to 8.098 million, outpacing forecasts for a 7.7 million growth and higher than October’s 7.839 million print.
Markets have priced out an interest rate cut by the Fed this month while the odds for a 25 basis points (bps) reduction in March stand at only 37%, according to the CME Group’s FedWatch Tool. The US Treasury bond yields continue to ride higher on the Trump trade optimism and hawkish Fed bets, limiting the upside attempts in the non-yielding Gold price.
US President-elect Donald Trump takes office on January 20, and his proposed tariffs and protectionist policies are seen as inflationary, calling for higher interest rates and a stronger US Dollar.
However, the US Dollar has paused its previous upswing, lending some support to Gold buyers. Nevertheless, China’s economic concerns and sagging physical Gold demand from India will continue to act as headwinds for the bright metal. Domestic Gold prices have surged due to the rapid depreciation of the Indian Rupee (INR) to record lows, making Gold purchases expensive for locals.
If risk aversion gathers pace amid renewed geopolitical tensions in the Middle East or tariff threats from incoming US President Donald Trump, global stocks will likely come under fresh selling pressure, lifting the haven demand for the Greenback and Gold price.
However, the upcoming US ADP Employment Change data and the Fed Minutes appear as the main event risks for Gold price in the session ahead. The US private sector is seen adding 140K jobs in December after reporting a 146K job gain in November. Surprisingly strong jobs data and hawkish Fed Minutes could reverberate hawkish Fed bets, negatively impacting the non-interest-bearing Gold price.
Gold price technical analysis: Daily chart
The daily chart shows that the 14-day Relative Strength Index (RSI) holds modestly flat, just above the 50 level, suggesting that the Gold price upside remains intact.
At the moment, Gold price defends the 50-day Simple Moving Average (SMA) at $2,646 after closing above that barrier on Tuesday.
Gold buyers must take out the strong resistance at $2,665 to revive the recovery from the previous month’s low of $2,583.
Further up, the December 13 high at $2,693 and the $2,700 level will challenge bearish commitments.
Conversely, if the 50-day SMA resistance-turned-support caves in, the next downside cap aligns near $2,634, where the 21-day SMA and the 100-day SMA close in.
A breach of the latter could expose Monday’s low of $2,615. The last line of defence for Gold buyers is seen at the December 30 low of $2,596.
Economic Indicator
FOMC Minutes
FOMC stands for The Federal Open Market Committee that organizes 8 meetings in a year and reviews economic and financial conditions, determines the appropriate stance of monetary policy and assesses the risks to its long-run goals of price stability and sustainable economic growth. FOMC Minutes are released by the Board of Governors of the Federal Reserve and are a clear guide to the future US interest rate policy.
Strong ISM and JOLTS surveys in the morning were followed by a mediocre bond auction this afternoon.
The auction showed below-average demand for US Treasuries, potentially signaling fear about the ongoing deficit and potential for inflation to reaccelerate.
USD/JPY is essentially unchanged on the day, with tomorrow’s ADP and initial jobless claims reports looming as the next potential injection of volatility into the pair
It’s been a mixed day for US data, with better-than-expected readings on the ISM Services PMI and JOLTS Job Openings surveys raising optimism about the US economy before a mediocre 10-year treasury bond auction in the early afternoon.
The auction showed a 2bps “tail”, indicating less demand for the bonds than expected, and dealers were obligated to take on 15.6% of the issue, above the 13.1% average over the last six months. All in all, the auction showed below-average demand for the benchmark US Treasury bond, potentially signaling fear about the ongoing deficit and potential for inflation to reaccelerate.
Stock indices have seen the morning’s gains evaporate, with the 10yr yield rising to 4.69%, its highest level since last April. More to the point for FX traders, the US dollar is edging higher against most of its major rivals, though the moves are fairly limited as we go to press.
Japanese Yen Technical Analysis – USD/JPY Daily Chart
Source: TradingView, StoneX.
Looking at the chart of USD/JPY, the pair attempted a breakout to 6-month highs above 158.00 on the back of this morning’s data releases before reversing back into the holiday period trading range in short order.
Now, rates are essentially unchanged on the day, with tomorrow’s ADP and initial jobless claims reports looming as the next potential injection of volatility into the pair. A confirmed bullish breakout above the top of the range could target 160.00 in short order, whereas a bearish breakdown could open the door for a deeper retracement toward 154.00.
— Written by Matt Weller, Global Head of Research
Check out Matt’s Daily Market Update videos on YouTube and be sure to follow Matt on Twitter: @MWellerFX
Consumers from South East Asia (SEA) would be familiar with Australian heritage brands such as Swisse and Blackmores. It is also a region where international brands such as Haleon’s Caltrate, Centrum, and Bayer’s Redoxon are household names.
However, in recent years, more brands from Japan and more notably South Korea have hit the shores. These include Korean Ginseng Corporation (KGC) where its Jung Kwan Jang range of red ginseng supplements could be found in brick-and-mortar retail, as well as CKD Healthcare’s probiotics brand LactoFit.
Dong-A Pharmaceutical, which celebrated its 92nd anniversary last year, has doubled down its efforts at overseas expansion. South East Asia, alongside Japan, and China have been identified as priority markets for its first step in global expansion.
For a start, they are introducing their kids supplement brand MiniMax and beauty-from-within supplement brand ILO into SEA.
Japanese firm Suntory, known for its BRAND’s Essence of Chicken, also believes that the region, especially Thailand, will continue to grow next year.
“In Thailand, both the beverage and health supplement businesses continue to perform well, with the health supplement business in particular seeing a significant improvement in conditions due to increased marketing activities and will continue to contribute next year (year 2025),” Noriaki Otsuka, managing executive officer, Division COO said during the company’s Q3 financial results Q&A session on November 12, 2024.
Thailand’s Central Retail Corporation, on the other hand, said that it would be introducing its vitamins and health supplements retail counter Tops Vita into 600 more convenience stores and pharmacy stores that it also operates this year.
Singapore-headquartered Incontech, known for its flagship brand PN Kids gummy supplements, said it planned to expand into Thailand and Laos.
This will build on the company’s existing presence in other SEA markets like Malaysia, Myanmar, and Cambodia. However, the company did point out that product registration for gummy supplements may not be as straightforward in countries like Thailand.
Readers of NutraIngredients-Asia have also shown strong interest in our VitamINSIGHTS in-depth features on SEA markets last year. Readership was especially strong for the Indonesian market, with the feature emerging as one of our top 10 most-read stories for year 2024.
Entering year 2025, we look at consumer health needs, purchasing behaviours and trends that companies should be aware of when cracking the region.
SEA consumers’ top three reasons for taking health supplements – IADSA
For SEA consumers, the top three reasons for taking health supplements are to 1) maintain overall health, 2) for immune support, and 3) for energy enhancement.
This is according to a study commissioned by the International Alliance of Dietary / Food Supplement Association (IADSA) and conducted by Ipsos in 2024.
The study, involving consumers from Indonesia, the Philippines and Thailand took place between July 4 and 30 in 2024. A total of 3,014 interviews were completed across the three countries.
A collage of photographic images and drawn shapes. (Richard Drury/Getty Images)
Sharing the findings with NutraIngredients-Asia, the IADSA said that over half of the respondents said they took health supplements to maintain overall health (56 per cent) and for immune support (54 per cent).
Nearly two in five (38 per cent) said they used it for energy enhancement.
The findings also showed that vitamin C, multivitamins, and vitamin B complexes are the most used supplements.
When choosing a supplement, the health benefits of the product is the most common consideration, as chosen by 97 per cent of the respondents.
Ingredient and nutritional information of the product ranked second, with 95 per cent of the respondents picking this as their main consideration.
In fact, over 80 per cent review dosage, ingredients, and certifications such as organic or halal when purchasing new products.
SEA consumers’ attention to the ingredient list is echoed by Thailand’s major retail company Central Retail.
Dr Monrudee Lertuthai, president of Health and Wellness at Central Retail, said that ingredients and pricing may be more important than country-of-origin for Thai consumers.
“Consumers who are affluent and travel abroad quite often, they may find that Australian-based and US products are good supplements, but for others, they may just be looking for ingredients that can help them.
“Maybe they have seen a certain actress who has beautiful and healthy skin and want to be like them, and so, they may be looking for products that probably local brands can also be their choice, because pricing is important for them,” she told NutraIngredients-Asia.
Back to the IADSA survey results, recommendations from a trusted source is the third-most common consideration, as chosen by 94 per cent of the respondents.
Consumers also expect health supplement brands to provide reliable information on supplements.
Over nine in ten respondents (92 per cent) said that they trusted health supplement brands to do so, which the IADSA said was understood to be a “very high index” as compared to other sectors.
Other than the brands itself, medical doctors or other traditional healthcare professionals have been pointed out as reliable sources for health supplement information (35 per cent).
General internet searches and pharmacists ranked next, with 28 per cent and 27 per cent of respondents choosing these two options respectively.
“Tailor to each market’s unique sales channels to ensure affordability, accessibility” – Blackmores CEO
Already a dominant player in South East Asia, Blackmores says it will continue to reach more consumers in this region by making its products available in more channels.
Blackmores CEO Alastair Symington told NutraIngredients-Asia that there remained huge potential to grow in Asia, especially in South East Asia.
“We see significant growth potential in several emerging markets across Asia and beyond. Our goal is to reach even more consumers in Asia, especially in South East Asia.”
To make products more accessible, Blackmores is looking to offer smaller pack sizes that come at more affordable prices for different sales channels.
These channels could range from mini-marts, convenience stores, to pharmacies.
“Our expansion strategy is driven by a deep understanding of local consumer needs, regulatory environments, and retail landscapes, allowing us to tailor our approach to each unique market.
“For example, in Southeast Asia, we might focus on smaller, more portable packaging that fits the convenience store model, while in Australia, we might offer more complex formulations in sizes that can be offered through pharmacies but require consultation with a healthcare provider.”
A couple making contactless payment at a convenience store. (gahsoon/Getty Images)
Indonesia and Thailand are some examples where consumers would prefer smaller pack sizes.
In Indonesia, for example, over 30 per cent of vitamin and dietary supplements (VDS) sold are in smaller packs, Symington pointed out.
“By tailoring our approach to each market’s unique sales channels, we can ensure that our products are not only affordable and accessible but also meet the specific needs and preferences of local consumers.
“This strategy will continue to be key to our successful expansion and growth across diverse regions,” he added.
Indonesia-based beauty-from-within and kids supplement firm Youvit also raised the same point during its keynote presentation at Growth Asia Summit 2024 last year.
CEO and co-founder Wouter van der Kolk, said that consumers from emerging markets like Thailand, Malaysia, and the Philippines tended to prioritise smaller pack sizes, taste, and flavour.
Youvit, for example, sells seven-day packs at IDR 19,540 (US$1.20).
On the other hand, SEA consumers also tend to prefer e-commerce more than Australian consumers, which is a trend similarly seen in China.
In Australia, pharmacies and offline retailers remain the usual channels for accessing nutraceuticals.
“In Australia, our primary sales channels include pharmacies and allied health. In China, we navigate a unique retail ecosystem that heavily relies on a blend of e-commerce platforms like Tmall, JD.com, and social commerce.
“In Southeast Asia, the retail landscape is even more diverse. A significant proportion of sales come from mini-marts and convenience stores, which are essential for reaching consumers who are used to shopping in local community stores for all their household needs.
“E-commerce represents around 20 per cent of consumer purchases and mini-marts and convenience stores are an important channel that requires smaller pack formats at more affordable prices,” said Symington.
“Keep an eye on TikTok” – Central Retail’s President of Health and Wellness
Social commerce is fast sweeping across South East Asia and TikTok has been highlighted as one that health and wellness brands should keep an eye on.
While there are a range of social commerce platforms such as Instagram, Line Mart, and Grab Mart in Thailand, TikTok in particular, has stood out, said Dr Monrudee Lertuthai, president of Health and Wellness at Thailand’s major retail company Central Retail.
Central Retail is perhaps best-known for its supermarket chain Tops, as well as convenience store Tops Daily. It also runs the pharmacy Tops Care and vitamins and health supplements retail arm Tops Vita.
Thailand has a population of about 72 million and over half – 44 million – are TikTok users, signifying its vast potential as a social commerce channel, Dr Monrudee pointed out.
TikTok is one of the popular social-commerce mobile applications in Thailand. (Wachiwit/Getty Images)
Although Instagram has about 60 million users in Thailand, the figure remains stable, and there seems to be further room for growth in the number of TikTok users, she said.
A reason for its popularity could be because it is a multiple-purpose platform where users can enjoy entertainment and shop at the same time.
“TikTok is coming on because it is not only for selling the products but also about entertainment. Products are communicated as lifestyle products on the video in an entertaining way, that’s why is it growing,” she explained.
“TikTok is something which we need to keep an eye on, it is not the most-used social commerce app in Thailand yet, but it has been growing rapidly.”
A similar scenario could be said of Indonesia.
Youvit told us previously that its sales on TikTok had surpassed that of Indonesia’s major e-commerce platform Tokopedia before it was forced to close in October 2023.
Over a year later, TikTok Shop Indonesia having forged a new alliance with PT GoTo Gojek Tokopedia Tbk (GoTo), restarted as a pilot programme under government supervision on December 11, 2024.
South East Asia’s social commerce development trajectory may ultimately mirror that of China.
In recent years, e-commerce and social commerce have fast replaced pharmacies as the go-to for health supplement purchase in China.
“Channel dynamics are ever evolving in China as traditional ecommerce platforms are losing ground to social commerce platforms such as Douyin (Tiktok).
“Tiktok now makes up more than a quarter of all online VDS sales, with consumers drawn to its easy-to-digest short video format, and attractive deals brought by entertaining, live streaming KOLs,” said Symington.
He added that Blackmores was present in less than half of the China VDS market via cross-border e-commerce and would be exploring new opportunities across segments and channels to expand.
Amid the ongoing market crash, Cardano (ADA) has turned bearish and is poised to continue its price decline. Today, January 8, 2024, the sentiment across the cryptocurrency market has shifted, as the overall cryptocurrency market dropped by 5.5%.
Cardano (ADA) Technical Analysis and Upcoming Levels
This market crash has caused a breakdown of the four-day-long consolidation zone that ADA had been facing between the $1.047 and $1.11 levels. According to expert technical analysis, this breakout has turned ADA bearish, and there is a strong possibility it could initially decline by 8% to reach the support level of $0.95.
Source: TradingView
However, if this price decline continues and ADA fails to hold the support level of $0.75, there is also a possibility of another 20% price drop in the future, reaching the next support level at the $0.75 mark.
Currently, ADA is trading near $1.01 and has witnessed a price decline of over 10% in the past 24 hours, with an intraday high of $1.15. During the same period, trader and investor participation skyrocketed as the altcoin’s trading volume jumped by 57.7%.
Exchanges witness $36 Million of Outflow
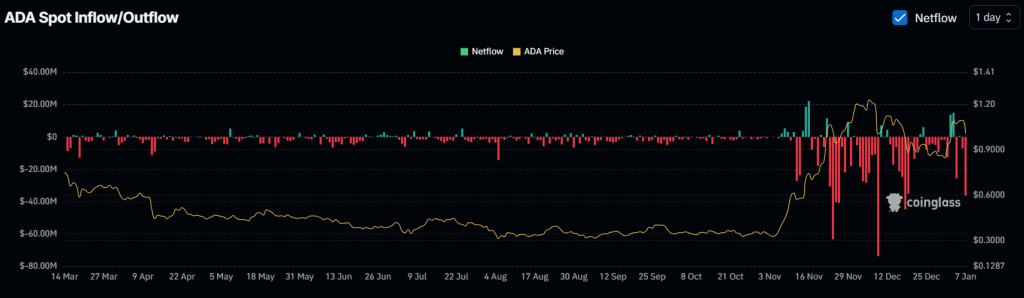
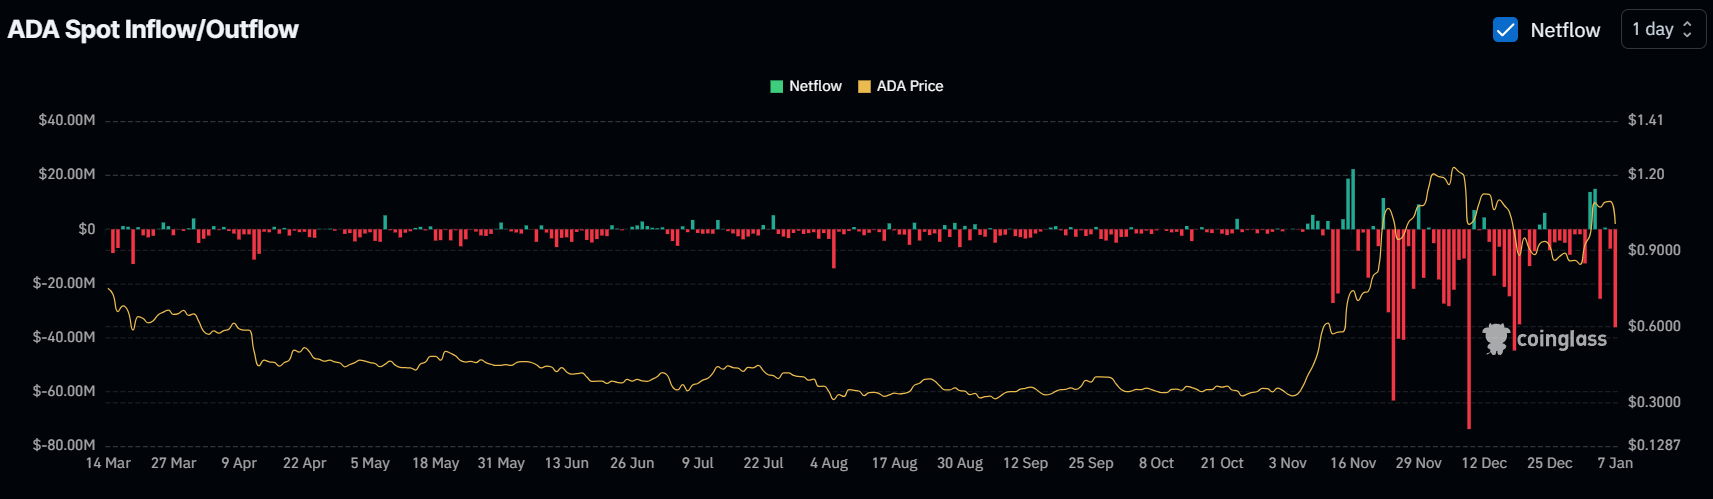
This bearish price action and the overall market sentiment have created fear, but some long-term holders have been accumulating the token, as reported by the on-chain analytics firm Coinglass. Data from spot inflow/outflow revealed that, amid the market crash, exchanges have witnessed an outflow of over $36.16 million worth of ADA, the highest since December 18, 2024.
Source: Coinglass
In the cryptocurrency landscape, “outflow” refers to the flow of assets from exchanges to wallets, which is considered a potential sign of accumulation. This metric further highlights potential buying pressure, an upside rally, and also hints at ideal buying opportunities.
It will be crucial for traders and investors to monitor key levels such as $0.75, as it could create a make-or-break situation.
Silver rebounds from the 200-day SMA at $29.89, breaking past the $30 mark.
A tweezers-top formation observed at the day’s high of $30.38, suggests potential pullback.
Resistance and support are set at $30.40 and $28.78, respectively, with eyes on movements toward $31.00.
Silver price posts solid gains as it bounces off the 200-day Simple Moving Average (SMA) of $29.89 and climbs past the $30.00 threshold, up by 0.43% at the time of writing. Although US economic data boosted the US dollar and has kept US yields higher, the grey metal has extended its uptrend.
XAG/USD Price Forecast: Technical outlook
From a technical perspective, Silver buyers are struggling to remain above the $30.00 figure for the second straight day. Although they reached a daily high of $30.38, a ‘tweezers-top’ candle chart pattern could pave the way for a pullback.
The Relative Strength Index (RSI) shifted bullishly but remained at around the 50 neutral levels. This suggests that neither buyers nor sellers are in charge.
For a bullish continuation, XAG/USD must clear the $30.40 an ounce barrier. Once surpassed, the next key resistance level would be the 50-day SMA at $30.64, followed by the 100-day SMA at $30.78. On further strength, the $31.00 would be exposed.
Conversely, If XAG/USD drops below the 200-day SMA, sellers could push the grey’s metal price lower. Key support levels would be the December 31 swing low of $28.78, followed by the September 6 daily low of $27.69.
XAG/USD Price Chart – Daily
Silver FAQs
Silver is a precious metal highly traded among investors. It has been historically used as a store of value and a medium of exchange. Although less popular than Gold, traders may turn to Silver to diversify their investment portfolio, for its intrinsic value or as a potential hedge during high-inflation periods. Investors can buy physical Silver, in coins or in bars, or trade it through vehicles such as Exchange Traded Funds, which track its price on international markets.
Silver prices can move due to a wide range of factors. Geopolitical instability or fears of a deep recession can make Silver price escalate due to its safe-haven status, although to a lesser extent than Gold’s. As a yieldless asset, Silver tends to rise with lower interest rates. Its moves also depend on how the US Dollar (USD) behaves as the asset is priced in dollars (XAG/USD). A strong Dollar tends to keep the price of Silver at bay, whereas a weaker Dollar is likely to propel prices up. Other factors such as investment demand, mining supply – Silver is much more abundant than Gold – and recycling rates can also affect prices.
Silver is widely used in industry, particularly in sectors such as electronics or solar energy, as it has one of the highest electric conductivity of all metals – more than Copper and Gold. A surge in demand can increase prices, while a decline tends to lower them. Dynamics in the US, Chinese and Indian economies can also contribute to price swings: for the US and particularly China, their big industrial sectors use Silver in various processes; in India, consumers’ demand for the precious metal for jewellery also plays a key role in setting prices.
Silver prices tend to follow Gold’s moves. When Gold prices rise, Silver typically follows suit, as their status as safe-haven assets is similar. The Gold/Silver ratio, which shows the number of ounces of Silver needed to equal the value of one ounce of Gold, may help to determine the relative valuation between both metals. Some investors may consider a high ratio as an indicator that Silver is undervalued, or Gold is overvalued. On the contrary, a low ratio might suggest that Gold is undervalued relative to Silver.
USD/JPY extends the advance from the start of the week to clear the December high (158.09), but the Relative Strength Index (RSI) may show the bullish momentum abating as the recent rise in the exchange rate fails to push the oscillator into overbought territory.
USD/JPY Clears December High Ahead of US NFP Report
USD/JPY climbs to a fresh weekly high (158.43) as the US Bureau of Labor Statistics (BLS) reports that ‘the number of job openings was little changed at 8.1 million on the last business day of November,’ with the Job Openings and Labor Turnover Summary (JOLTS) revealing that ‘the number of job openings increased in professional and business services (+273,000), finance and insurance (+105,000), and private educational services (+38,000).’
David provides a market overview and takes questions in real-time. Register Here
US Economic Calendar
In turn, the update to the US Non-Farm Payrolls (NFP) may also influence USD/JPY as the economy is anticipated to add 154K jobs in December, and evidence of a strong labor market may put pressure on the Federal Reserve to alter the path for monetary policy as the economy shows little signs of an imminent recession.
In turn, a positive development may generate a bullish reaction in the US Dollar as it raises the Fed’s scope to pause its rate-cutting cycle, but a weaker-than-expected NFP report may drag on the Greenback as it fuels speculation for lower US interest rates.
With that said, swings in the carry trade may continue to influence USD/JPY as the Federal Open Market Committee (FOMC) pursues a neutral stance, but the exchange rate may further retrace the decline from the 2024 high (161.95) as it clears the December high (158.09).
USD/JPY trades to a fresh weekly high (158.43) following the failed attempt to close below 156.50 (78.6% Fibonacci extension), with a move above 160.40 (1990 high) bringing the 2024 high (161.95) on the radar.
Next area of interest comes in around the December 1986 high (163.95), but USD/JPY may hold within last year’s range should if struggle to extend the recent series of higher highs and lows.
A close below 156.50 (78.6% Fibonacci extension) may push USD/JPY back towards 153.80 (23.6% Fibonacci retracement), with a break/close below 151.95 (2022 high) opening up the 148.70 (38.2% Fibonacci retracement) to 150.30 (61.8% Fibonacci extension) zone.
A fresh approach to weight management and overall health is now available with the launch of AquaSculpt Ice Water Hack for Weight Loss, a natural supplement designed to optimize metabolism, energy levels, and cognitive clarity. The formula, inspired by the body’s natural circadian rhythms, uses what the company calls the “Ice Water Hack” to support sustainable fat loss and enhance vitality.
AquaSculpt Ice Water Hack for Weight Loss combines eleven carefully selected ingredients—Zinc, Chromium, Alpha Lipoic Acid, Green Tea Leaf, Milk Thistle Seed Extract, Cayenne Fruit, Korean Ginseng, Resveratrol, HCL, Polyphenols, and EGCG—each chosen for its role in boosting metabolic function, fat oxidation, and energy production. By aligning with the body’s natural rhythms, AquaSculpt Ice Water Hack offers a comprehensive solution to weight management challenges.
Backed by extensive research, AquaSculpt Ice Water Hack’s formula is non-GMO, stimulant-free, and made in FDA-registered, GMP-certified facilities to ensure the highest safety and quality standards. The “Ice Water Hack” incorporates metabolic enhancers like Green Tea Catechins, which promote fat oxidation, and cognitive boosters like L-Theanine, which support mental clarity and focus.
“The science behind AquaSculpt Ice Water Hack’s formula demonstrates the powerful synergy of these natural ingredients,” said a research scientist working with AquaSculpt. “By targeting metabolic rhythms and cellular energy, AquaSculpt helps users experience a healthier and more balanced lifestyle.”
AquaSculpt Ice Water Hack for Weight Loss is simple to use and comes with a risk-free, 60-day money-back guarantee. Customers purchasing the product through getaquasculpt.org also receive free wellness bonuses, including The Live Diet, Quick Workouts, and Yoga Stretch, to support their weight loss journey.
Early AquaSculpt customer reviews report benefits such as enhanced energy, better focus, and more sustainable weight management. Many users have expressed noticeable improvements in their health and well-being within weeks of starting the program.
Founded to address modern health concerns through natural, science-backed solutions, AquaSculpt Ice Water Hack for Weight Loss plans to expand its offerings to include products for stress management and enhanced cognitive health.
To learn more or explore customer testimonials, visitgetaquasculpt.org.
Ripple (XRP) has seen significant momentum recently, leading analysts to predict a major price surge that could take the cryptocurrency to new heights. With a potential 470% surge, XRP could reach $8.7 per token and a market capitalization of $500 billion. However, while this bullish forecast is based on technical analysis and market indicators, the possibility of a sharp downturn also looms if the rally fails to materialize.
Bullish Signals Hint XRP Price Likely to Rally Soon
XRP has made a stunning comeback, surging nearly 370% in the last two months. As of January 2025, XRP is trading at $2.42, with a market capitalization of $138.82 billion, making it the third-largest cryptocurrency by market cap. This surge comes despite some consolidation and setbacks in recent weeks, leaving many investors wondering whether XRP can maintain its bullish momentum.
Analysts have pointed to several key indicators that suggest a continuation of the rally. One such signal is the formation of a half-mast bull flag on XRP’s chart, a pattern often associated with strong price rallies. Additionally, a crypto analyst known as Ali has observed a super trend indicator flashing a buy signal on the 12-hour chart, marking the first such signal since early November 2024. The last time this occurred, XRP’s price surged by an impressive 470%, fueling speculation that the token could experience similar gains again.
The Role of Open Interest in XRP’s Future Price Movement
Another important factor contributing to the bullish sentiment around XRP is the rising Open Interest (OI) in its futures market. Open Interest refers to the total number of outstanding contracts that have not been settled, and its increase typically signals growing investor interest and market confidence.
The current rise in XRP’s Open Interest suggests that more investors are positioning themselves for a potential breakout, which could drive the price higher. Analysts view this as a strong indicator that the XRP price may be on the verge of a significant rally, with the potential to push the price to $8.7 and a market cap of $500 billion.
The Risks: What Happens if the Rally Fails?
While the outlook for XRP remains largely positive, experts caution that there is a risk of a sharp correction if the rally fails to materialize. If XRP cannot break through key resistance levels, it could fall back to $0.48, leading to a market cap of just $28 billion. This potential downside is something investors need to be aware of, especially in light of XRP’s ongoing consolidation.
What’s Next for Ripple?
XRP’s recent performance has certainly caught the attention of the crypto community. The token has shown resilience despite market fluctuations and is now positioned to capitalize on the growing interest from investors. The rising Open Interest and bullish technical indicators are key factors that could propel XRP to new heights, potentially reaching $8.7 and a $500 billion market cap.
However, it is essential to remain cautious. The volatility of the cryptocurrency market means that sudden downturns are always a possibility. As Ripple continues to consolidate, the next few weeks will be crucial in determining whether the current rally is sustainable or if a significant correction is imminent.
Key Takeaways
XRP has surged nearly 370% in the last two months, currently trading at $2.42.
Technical indicators, including the super trend buy signal and the half-mast bull flag, suggest a potential price rally to $8.7.
The rising Open Interest in XRP futures indicates growing investor interest, which could trigger a breakout.
However, if the rally fails, XRP’s price could fall to $0.48, leading to a market cap of just $28 billion.
XRP’s future price movements will depend on whether it can break through resistance levels and maintain bullish momentum.
A continuation of the rally will be signaled on a move above yesterday’s high of 75.19. However, there is another potential resistance zone a little higher from around 75.78 to 76.47. It is important to recognize that the potential resistance zone is a confluence zone that includes the 200-Day MA at 75.85 and the 78.6% retracement level at 76.57.
Further, the 200-Day line has recently converged with the bottom boundary line of a large symmetrical triangle pattern. It is interesting that the rising trendline and 200-Day line have converged now that crude is approaching that price zone. This could represent more significant resistance than what has been seen so far during the rally since the lines have lined up.
Strong Momentum
Momentum, as shown in the relative strength index (RSI) oscillator can also be considered. Note that the indicator has reached its highest reading since April last year and it has not yet gone into overbought territory, above 70. This shows strength in demand and provides supporting evidence for further strengthening. A rise above a 70 reading will put the indicator into overbought territory as the price of crude oil is approaching the next higher resistance zone. Notice that that last overbought readings were in April 2024.
Support at Day’s Low of 73.29
Despite the above potential bullish short-term thesis, resistance may continue to stop the ascent near current prices and lead to a pullback. In that scenario a decline below today’s low of 73.29 is a sign of weakness. Key price levels to watch for support would then include the interim swing high at 71.79 and the 20-Day MA, now at 70.94.
For a look at all of today’s economic events, check out our economic calendar.