About Editorial team of BIPNs

Main team of content of bipns.com. Any type of content should be approved by us.
3 01, 2025

Galaxy Digital Predicts What Price Dogecoin Will Reach in 2025

By |2025-01-03T19:11:21+02:00January 3, 2025|Crypto News, News|0 Comments

Notable cryptocurrency firm Galaxy Digital shares its opinion on Dogecoin price and market cap expectations for the year 2025.

The cryptocurrency market recorded significant milestones last year. Some of them include a new high for Bitcoin, the maiden launch of the US Bitcoin spot exchange-traded funds (ETFs), and the election of the first openly pro-crypto US president in history.

Meanwhile, a new year is upon us, and with it comes fresh price outlooks. Galaxy Digital, one of the biggest crypto firms, has predicted what price the Shiba Inu-themed meme coin Dogecoin will attain before the end of 2025.

Galaxy Research Provides Dogecoin Outlook

Alex Thorn, the head of research at Galaxy Digital, has asserted that Dogecoin, the largest meme coin by market cap, will finally reach a $100 billion market cap. Notably, this valuation is unprecedented for the meme coin, whose market cap peaked at $98.47 billion in 2021.

For context, the $100 billion valuation will bring Dogecoin’s price to $0.678, 8% below its current all-time high of $0.739. Also, Dogecoin would surge an impressive 87% from the present market price to hit $0.678. 

Meanwhile, Galaxy Research does not expect Dogecoin to peak there. Per its analysis, the meme coin will surpass its current ATH this year and finally attain a one-dollar valuation.

A surge to $1 will ensure Dogecoin’s market cap trades at $147.47 billion, an impressive 176% from the current valuation. Its price would also see a similar uptick to reach $1.

Notably, Galaxy Research also provided price expectations for other cryptocurrencies. The firm asserted that Bitcoin will hit $185,000 and Ethereum $5,550 by the end of the year.

Conservative or Ambitious?

Galaxy Digital’s Dogecoin prediction followed speculations from other analysts. Notably, the firm’s call seems conservative compared to existing predictions of the meme coin leader’s upsurge potential this year.

For context, Ali Martinez has insisted that Dogecoin will target ranges between $4 and $23, citing multiple price catalysts. Some of them include an upsurge to the tip of its ascending channel and a possible repeat of its 2021 bull cycle feat.

Furthermore, an analysis from Tradigrade has shown that Dogecoin will hit $11. The market speculator based his assertion on a possible breakout from the Gaussian channel.

In the meantime, Dogecoin trades at $0.361, up over 6% in the past 24 hours.

DisClamier: This content is informational and should not be considered financial advice. The views expressed in this article may include the author’s personal opinions and do not reflect The Crypto Basic opinion. Readers are encouraged to do thorough research before making any investment decisions. The Crypto Basic is not responsible for any financial losses.

Source link

3 01, 2025

XAG/USD extends upside to near $29.80 on renewed safe-haven demand

By |2025-01-03T18:28:43+02:00January 3, 2025|Forex News, News|0 Comments


  • Silver price climbs to near $29.80 amid renewed geopolitical tensions.
  • US Joe Biden discusses possible ways to strike on Iran’s nuclear facility.
  • Investors expect the Fed to leave interest rates unchanged in the policy meeting this month.

Silver price (XAG/USD) rises further to near $29.80 in Friday’s European session. The white metal gains as demand for safe-haven assets has improved on renewed geopolitical tensions. According to reports from Axios, US President Joe Biden discussed possible strikes on Iran’s nuclear facilities with his national security team, with few weeks remaining for President-elect Donald Trump to take administration.

Axios reported that White House National Security Advisor Jake Sullivan presented President Biden with options for a potential US attack on Iran’s nuclear sites. Historically, demand for safe-haven assets, such as Silver, improves in heightened geopolitical uncertainty.

Additionally, prospects of high inflation under the administration of Trump, as he is expected to tighten immigration controls, elevate import tariffs, and lower taxes, have also strengthened safe-haven demand. Silver tends to face high demand as investors use it as a hedge against inflation.

Meanwhile, the US Dollar (USD) edges down on Friday after a sharp rally on Thursday, with investors focusing on the US ISM Manufacturing PMI data for December, which will be published at 15:00 GMT. The Manufacturing PMI is estimated to have remained unchanged at 48.4, suggesting that factory activities contracted steadily.

10-year US Treasury yields drop to near 4.55% even though the Federal Reserve (Fed) is certain to pause the current policy-easing spell in the policy announcement on January 29.

Silver technical analysis

Silver price rebounds to near the 20-day Exponential Moving Average (EMA), which trades around $29.85. However, the outlook of the white metal remains bearish till it stays below the upward-sloping trendline, which is plotted from the February 29 low of $22.30 on a daily timeframe.

The 14-day Relative Strength Index (RSI) rebounds above 40.00. A bearish momentum would come to an end if it sustains above that level.

Looking down, the September low of $27.75 would act as key support for the Silver price. On the upside, the 50-day EMA around $30.90 would be the barrier.

Silver daily chart

Silver FAQs

Silver is a precious metal highly traded among investors. It has been historically used as a store of value and a medium of exchange. Although less popular than Gold, traders may turn to Silver to diversify their investment portfolio, for its intrinsic value or as a potential hedge during high-inflation periods. Investors can buy physical Silver, in coins or in bars, or trade it through vehicles such as Exchange Traded Funds, which track its price on international markets.

Silver prices can move due to a wide range of factors. Geopolitical instability or fears of a deep recession can make Silver price escalate due to its safe-haven status, although to a lesser extent than Gold’s. As a yieldless asset, Silver tends to rise with lower interest rates. Its moves also depend on how the US Dollar (USD) behaves as the asset is priced in dollars (XAG/USD). A strong Dollar tends to keep the price of Silver at bay, whereas a weaker Dollar is likely to propel prices up. Other factors such as investment demand, mining supply – Silver is much more abundant than Gold – and recycling rates can also affect prices.

Silver is widely used in industry, particularly in sectors such as electronics or solar energy, as it has one of the highest electric conductivity of all metals – more than Copper and Gold. A surge in demand can increase prices, while a decline tends to lower them. Dynamics in the US, Chinese and Indian economies can also contribute to price swings: for the US and particularly China, their big industrial sectors use Silver in various processes; in India, consumers’ demand for the precious metal for jewellery also plays a key role in setting prices.

Silver prices tend to follow Gold’s moves. When Gold prices rise, Silver typically follows suit, as their status as safe-haven assets is similar. The Gold/Silver ratio, which shows the number of ounces of Silver needed to equal the value of one ounce of Gold, may help to determine the relative valuation between both metals. Some investors may consider a high ratio as an indicator that Silver is undervalued, or Gold is overvalued. On the contrary, a low ratio might suggest that Gold is undervalued relative to Silver.


Source link

3 01, 2025

Pound Sterling struggles to shake off bearish pressure

By |2025-01-03T17:15:17+02:00January 3, 2025|Forex News, News|0 Comments

  • GBP/USD dropped to its lowest level since April near 1.2350 on Thursday.
  • The pair struggles to stage a rebound in the European session on Friday.
  • The technical outlook points to a bearish bias as investors await US PMI data.

GBP/USD declined sharply and touched its weakest level in nearly nine months at 1.2352 on Thursday. The pair rises toward 1.2400 in the European morning on Friday but shows no signs of a buildup in recovery momentum.

British Pound PRICE This week

The table below shows the percentage change of British Pound (GBP) against listed major currencies this week. British Pound was the weakest against the Japanese Yen.

  USD EUR GBP JPY CAD AUD NZD CHF
USD   1.36% 1.41% -0.30% -0.15% 0.06% 0.47% 0.95%
EUR -1.36%   0.04% -1.68% -1.54% -1.35% -0.92% -0.46%
GBP -1.41% -0.04%   -1.70% -1.58% -1.39% -0.97% -0.52%
JPY 0.30% 1.68% 1.70%   0.14% 0.41% 0.92% 1.31%
CAD 0.15% 1.54% 1.58% -0.14%   0.20% 0.69% 1.08%
AUD -0.06% 1.35% 1.39% -0.41% -0.20%   0.43% 0.90%
NZD -0.47% 0.92% 0.97% -0.92% -0.69% -0.43%   0.45%
CHF -0.95% 0.46% 0.52% -1.31% -1.08% -0.90% -0.45%  

The heat map shows percentage changes of major currencies against each other. The base currency is picked from the left column, while the quote currency is picked from the top row. For example, if you pick the British Pound from the left column and move along the horizontal line to the US Dollar, the percentage change displayed in the box will represent GBP (base)/USD (quote).

As trading volumes returned to normal levels following the New Year break, the US Dollar (USD) benefited from the cautious market mood and gathered strength against its major rivals. Additionally, the US Department of Labor reported that the weekly Initial Jobless Claims fell to 211,000 in the week ending December 28 from 220,000 in the previous week. This reading came in below the market expectation of 222,000 and further boosted the USD.

Early Friday, US stock index futures trade modestly higher on the day, limiting the USD’s gains and helping GBP/USD find support for now.

In the second half of the day, the ISM will publish the Manufacturing Purchasing Managers Index (PMI) data for December. Investors expect the headline Manufacturing PMI to match November’s print of 48.4. The USD could continue to outperform its rivals with a reading above 50.

Market participants will also pay close attention to the inflation component of the PMI report, the Prices Paid Index. The market expectation is for this data to rise to 51.7 from 50.3. A bigger-than-forecast increase could feed into expectations of a policy hold by the Federal Reserve at the next meeting and make it difficult for GBP/USD to hold its ground.

GBP/USD Technical Analysis

The Relative Strength Index (RSI) indicator on the 4-hour chart holds slightly above 30 after falling toward 20 late Thursday, confirming that the latest recovery attempt was a technical correction rather than the beginning of a reversal.

On the downside, 1.2350 (static level) aligns as first support before 1.2300 (static level) and 1.2250 (static level). In case GBP/USD manages to stabilize above 1.2400 (static level), 1.2440 (static level) could be seen as next resistance before 1.2485 (20-period Simple Moving Average).

Pound Sterling FAQs

The Pound Sterling (GBP) is the oldest currency in the world (886 AD) and the official currency of the United Kingdom. It is the fourth most traded unit for foreign exchange (FX) in the world, accounting for 12% of all transactions, averaging $630 billion a day, according to 2022 data. Its key trading pairs are GBP/USD, also known as ‘Cable’, which accounts for 11% of FX, GBP/JPY, or the ‘Dragon’ as it is known by traders (3%), and EUR/GBP (2%). The Pound Sterling is issued by the Bank of England (BoE).

The single most important factor influencing the value of the Pound Sterling is monetary policy decided by the Bank of England. The BoE bases its decisions on whether it has achieved its primary goal of “price stability” – a steady inflation rate of around 2%. Its primary tool for achieving this is the adjustment of interest rates. When inflation is too high, the BoE will try to rein it in by raising interest rates, making it more expensive for people and businesses to access credit. This is generally positive for GBP, as higher interest rates make the UK a more attractive place for global investors to park their money. When inflation falls too low it is a sign economic growth is slowing. In this scenario, the BoE will consider lowering interest rates to cheapen credit so businesses will borrow more to invest in growth-generating projects.

Data releases gauge the health of the economy and can impact the value of the Pound Sterling. Indicators such as GDP, Manufacturing and Services PMIs, and employment can all influence the direction of the GBP. A strong economy is good for Sterling. Not only does it attract more foreign investment but it may encourage the BoE to put up interest rates, which will directly strengthen GBP. Otherwise, if economic data is weak, the Pound Sterling is likely to fall.

Another significant data release for the Pound Sterling is the Trade Balance. This indicator measures the difference between what a country earns from its exports and what it spends on imports over a given period. If a country produces highly sought-after exports, its currency will benefit purely from the extra demand created from foreign buyers seeking to purchase these goods. Therefore, a positive net Trade Balance strengthens a currency and vice versa for a negative balance.


Source link

3 01, 2025

Cardano Price on Track to Claim $6 as ADA Follows 2021 Fractal

By |2025-01-03T17:10:15+02:00January 3, 2025|Crypto News, News|0 Comments

Market veteran Ali Martinez believes Cardano price is on track to double its all-time high this cycle as ADA follows the 2021 trajectory.

The analyst disclosed this amid Cardano’s (ADA) impressive rebound above $1 in the new year. Cardano, which began the year at $0.8450, has so far witnessed two consecutive bullish days, with the latest 10.36% gain this morning allowing it to cross $1 for the first time in over two weeks.

Amid this recovery push, Ali Martinez disclosed in a recent analysis that Cardano is now following a path similar to its trajectory in the 2020/2021 market cycle. He shared a 4-day ADA chart to corroborate this claim.

ADA’s Historical Data

Data from the chart indicates that Cardano experienced a price crash from a top of $0.3885 in April 2018, entering a major downtrend and consolidation channel from November of that year. This bearish consolidation persisted for 670 days, further exacerbated by the COVID-19 crash to $0.0177 in March 2020.

However, ADA eventually broke out from the channel in May 2020 and then slipped into an uptrend from November 2020 that lasted until August 2021, culminating in the $3.1 all-time high. During the period of this uptrend, Cardano spiked 4,095%. 

Cardano 4D Chart Ali Martinez
Cardano 4D Chart | Ali Martinez

Nonetheless, following the Terra and FTX implosions in 2022, Cardano collapsed with the rest of the market. The asset entered into another extensive bearish consolidation channel for 457 days, until its breakout from the channel during the start of the ongoing bull run in Q4 2023.

Cardano Enters Similar Uptrend

Despite this, Cardano did not enter into this cycle’s uptrend until early November, after the Donald Trump victory in the U.S. presidential election. ADA is now up 217% since it started the uptrend, but Martinez believes the rally is just beginning.

Just in 2020/2021, the analyst expects Cardano to sustain this upsurge for an extended period, setting a target of $4 over the next few weeks. However, data from his chart shows that he sees further upside to the $6.4 level as the ultimate target, culminating in a 2,210% increase from recent lows.

At press time, Cardano now trades for $1.06, having increased by over 10% today alone. With an 11.13% spike in the last 24 hours, ADA is now the second-largest gainer among the top 100 assets in the past 24 hours. The asset aims to solidify its hold above $1, potentially leveraging it for further upsurge.

DisClamier: This content is informational and should not be considered financial advice. The views expressed in this article may include the author’s personal opinions and do not reflect The Crypto Basic opinion. Readers are encouraged to do thorough research before making any investment decisions. The Crypto Basic is not responsible for any financial losses.

Source link

3 01, 2025

Crude Oil Forecast Today 03/01: Rally Long Term? (Chart)

By |2025-01-03T16:27:59+02:00January 3, 2025|Forex News, News|0 Comments


  • One of the things that we will talk about in the early part of 2025 is going to be energy.
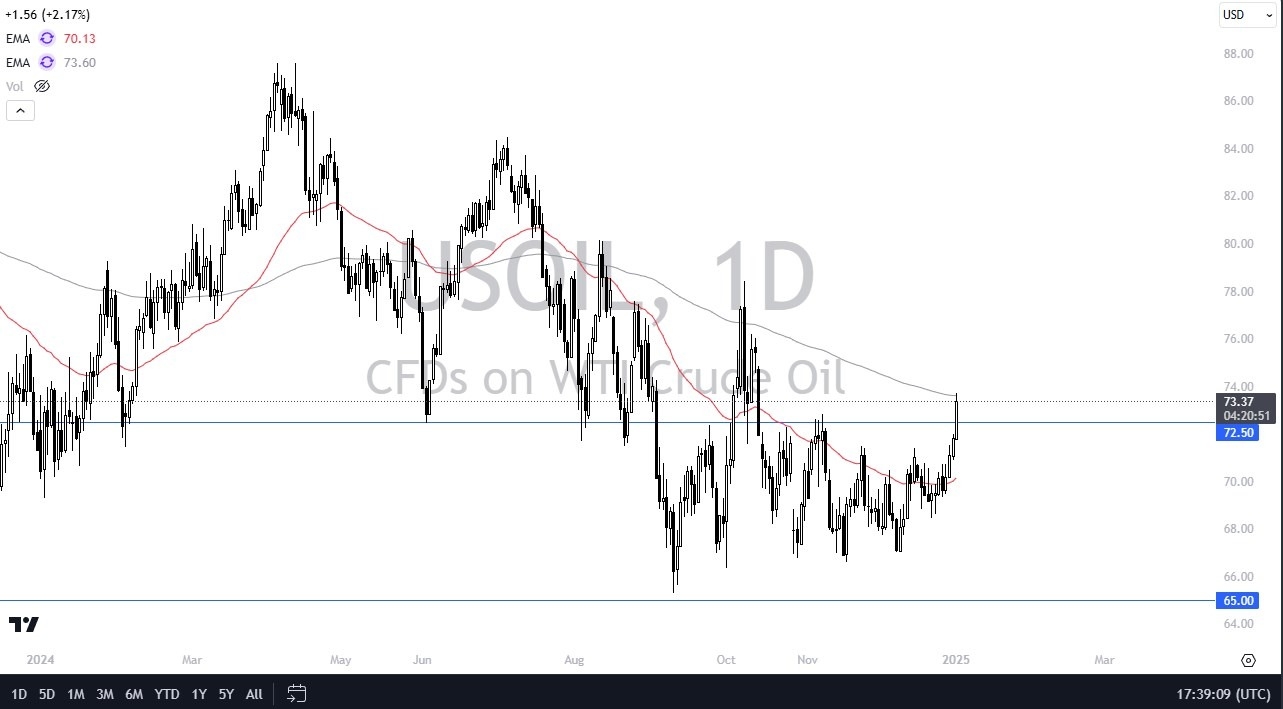
  • After all, energy had been beaten up pretty severely during most of 2024, and this can be plainly seen in the West Texas Intermediate Crude Oil market.
  • That being said, the last several sessions have been very bullish, and I think we are onto something here.

Taking further upward pressure to the market is the fact that the Crude Oil Inventories in the United States came in at -1.2 million, suggesting that we are starting to see continued energy demand.

New year, new America

Keep in mind this year is going to be interesting for America, as the incoming administration is very pro-business, and is likely to do everything it can to spur economic growth. This should drive up demand for energy, as of course the crude oil market is the “life’s blood” of economic activity. Because of this, it makes perfect sense that we are starting to see energy breakout, and it’s probably worth noting that the spot US Oil contract has broken above the crucial $72.50 level.

The only thing left at this point for the Bears to hang onto is the fact that the 200 Day EMA has offered a little bit of resistance, but quite frankly I don’t see any reason why it will hold. If we can break above the highs of the trading session on Thursday, then I suspect that crude oil continues to go much higher, probably aiming toward $80 before it is all said and done. However, it would make a certain amount of sense for the market to pull back toward the $72.50 level again, looking for some type of confirmation on the breakout via a pullback and bounce.

The size of the candlestick is somewhat impressive, and of course traders have come back to work, at least in a certain number, and therefore it does make sense that we would see more activity in this market. After all, I’ve been saying for weeks that it looks like we are building a basing pattern, and Thursday looks like it does in fact confirm that.

Ready to trade Crude Oil daily analysis and predictions? Here are the best Oil trading brokers to choose from. 


Source link

3 01, 2025

USD/JPY Forex Signal Today 03/01: Looks Strong (Chart)

By |2025-01-03T15:14:09+02:00January 3, 2025|Forex News, News|0 Comments

Potential signal:

  • I am a buyer of the USD/JPY pair only.
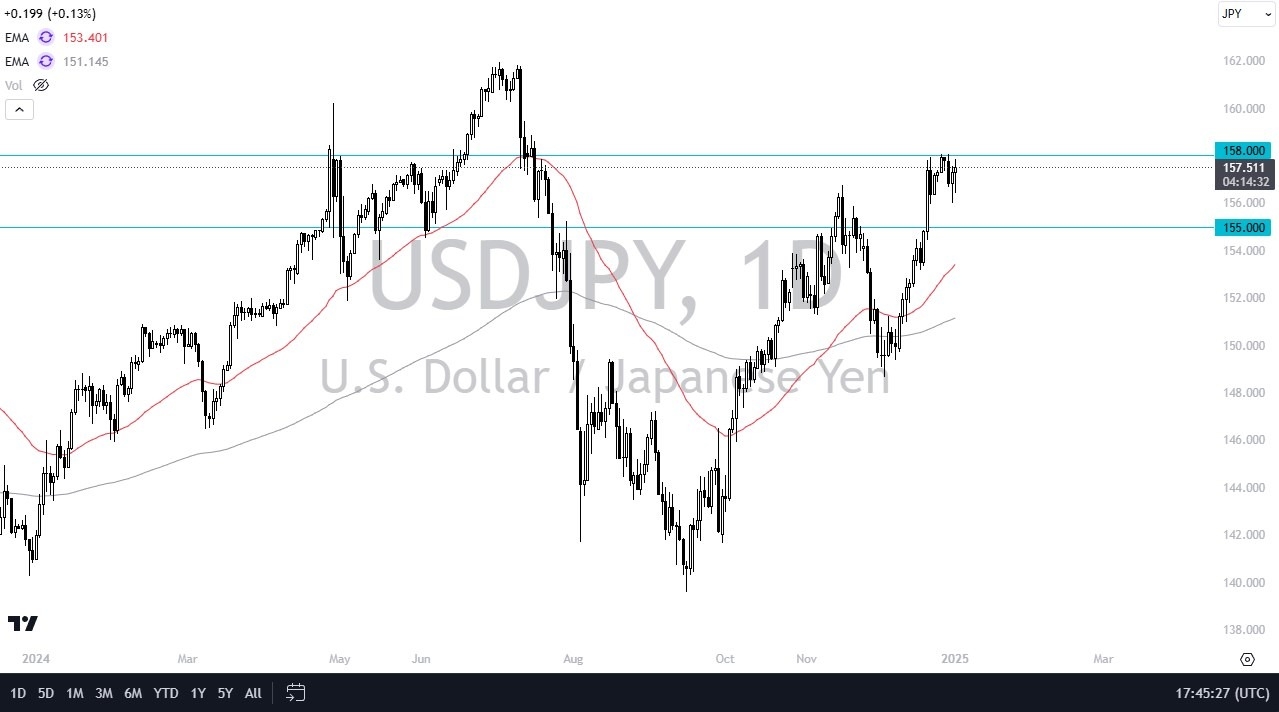
  • I have no interest in shorting this pair, and as such am waiting patiently for a move above the ¥158 level.
  • At that point, I would put a stop loss at the ¥157 level and aim for the ¥161.25 level.

In my daily analysis of the US dollar, the first pair I have been looking at recently has of course been the USD/JPY pair, as it has been so important for so long, and it’s worth noting that the trajectory continues to favor the upside, despite the fact that we had rallied so viciously in the month of December. The Japanese yen has been like a punching bag for most currencies, and at this point time it looks like we are consolidating, perhaps trying to absorb some of that massive inertia to the upside that we had previously enjoyed.

Technical Analysis

The technical analysis for this pair obviously is very bullish, and that of course has not changed. In fact, it is probably worth noting that despite the fact there has been some selling over the last couple of days, the buyers have stepped in and bought the US dollar each time. Because of this, I suspect that it is probably only a matter of time before we take off to the upside, and at this point in time the most support level that I see on the chart is the ¥158 level, because it has been such stringent resistance. Furthermore, this is not the first time that has happened, so I think all in all, you have to assume that any move above there means something rather important.

On the downside, the ¥156 level is a short-term support level, with the ¥155 level being even more important. We were to break down below there, it would change a lot of things, but we also have the 50 Day EMA approaching that level as well, adding more support. With this being the case, I think you have to look at this through the prism of a market that has plenty of demand for the US dollar, but now it’s only a matter of time before we break out.

Want to trade our USD/JPY forex analysis and predictions? Here’s a list of forex brokers in Japan to check out. 

Source link

3 01, 2025

Vitamin D could lower dementia risk, especially for woman

By |2025-01-03T15:12:26+02:00January 3, 2025|Dietary Supplements News, News|0 Comments


Dementia impacts millions of older adults, but researchers are still learning how, exactly, to prevent this devastating illness. Now, research suggests that increasing your intake of one specific vitamin may help.

Of course, dementia is a complicated condition, so just making one change might not completely shift your odds of developing it. But these findings are ‘significant’, scientists say. Here’s what the study found, plus what a geriatrician wants you to know.

Meet the experts: David Merrill, is a geriatric psychiatrist at Providence Saint John’s Health Center in Santa Monica, California, and the Singleton Endowed Chair in Integrative Brain Health. Brigitte Zeitlin, is a certified nutritionist and founder of BZ Nutrition.

What did the study find?

The study, which was published in the journal Alzheimer’s & Dementia Diagnosis, Assessment, & Disease Monitoring in 2023, analysed the impact of vitamin D on the development of dementia in nearly 12,500 older adults who participated in the National Alzheimer’s Coordinating Center. None of the participants had dementia at the start of the study.

The researchers broke the groups down into people who took a vitamin D supplement and those who didn’t during the study. The researchers discovered that people who took vitamin D had a 40 per cent lower risk of developing dementia than those who didn’t take a supplement. They also had a 15 per cent higher five-year survival rate.

Of the study participants, women were at a higher risk of developing dementia than men, but they also had a better response to the vitamin D intervention – women who took it had a 49 per cent lower risk of developing dementia than those who didn’t.

Finally, 75 per cent of those who developed dementia didn’t have exposure to vitamin D.

‘Across all formulations, vitamin D exposure was associated with significantly longer dementia-free survival and lower dementia incidence rate than no exposure,’ the researchers concluded.

Why could vitamin D help prevent dementia?

The study didn’t explain why there was a link between taking vitamin D and a lower risk of developing dementia. However, there are some theories.

Vitamin D influences a lot of cellular functions in the body – so it’s possible that mild deficiencies can impact the development of ageing-related brain changes, says David Merrill, a geriatric psychiatrist at Providence Saint John’s Health Center in Santa Monica, California.

Vitamin D also helps clear beta-amyloid, a protein that plays a role in Alzheimer’s disease, Merrill points out. This is ‘the same mechanism targeted by new prescription drugs in Alzheimer’s disease,’ he says.

Vitamin D might also slow the buildup of tau tangles (that slow a person’s ability to think and remember), which are another hallmark of Alzheimer’s, he adds.

How much vitamin D should I get per day?

According to the NHS, Children from the age of 1 year and adults need 10 micrograms (mcg) of vitamin D a day. This includes pregnant and breastfeeding women and people at risk of vitamin D deficiency.

10 micrograms of vitamin D is equal to 400 IU

How can I get more vitamin D?

Your body produces vitamin D when you’re exposed to sunlight, making that an easy way to get more in your life. However, there are supplements available. (Just check in with your doctor before taking the vitamin to make sure it doesn’t interact with anything else you might be taking.)

But Merrill stresses that taking vitamin D alone won’t keep you from developing dementia. ‘No single factor will be sufficient to keep the brain intact with ageing,’ he says.

Instead, do your best to be healthy overall, which will support good brain health as you age.

Best Vitamin D supplements

Vitamin D Zooki

Now 11% Off

Credit: Zooki
Nutrition Geeks Nutrition Geeks Vegan Vitamin D 1000iu
Credit: Nutrition Geeks
Thorne Vitamin D 10,000
Credit: Thorne
Wild Nutrition Wild Nutrition Vitamin D
Credit: Wild Nutrition
Solgar Vitamin D3 4000IU
Credit: Solgar
Pure Encapsulations Vitamin D3 5000 IU

Now 23% Off

Credit: Pure Encapsulations

Cut through the noise and get practical, expert advice, home workouts, easy nutrition and more direct to your inbox. Sign up to the WOMEN’S HEALTH NEWSLETTER


Source link

3 01, 2025

XRP Price Prediction: Is a Major Move on the Horizon?

By |2025-01-03T15:09:32+02:00January 3, 2025|Crypto News, News|0 Comments

Florian Biaggio

My name is Florian, and I have a deep passion for forex, cryptocurrencies, and trading as a whole. I feel lucky, that I am able combine my skills with what I love. I’m very interested in factors driving price movements and enjoy uncovering the reasons behind them. My primary interests include Bitcoin, Altcoins, macroeconomics, and all related to trading.

Source link

3 01, 2025

Natural Gas Forecast Today 03/01: Rally Continues? (Video)

By |2025-01-03T14:27:20+02:00January 3, 2025|Forex News, News|0 Comments


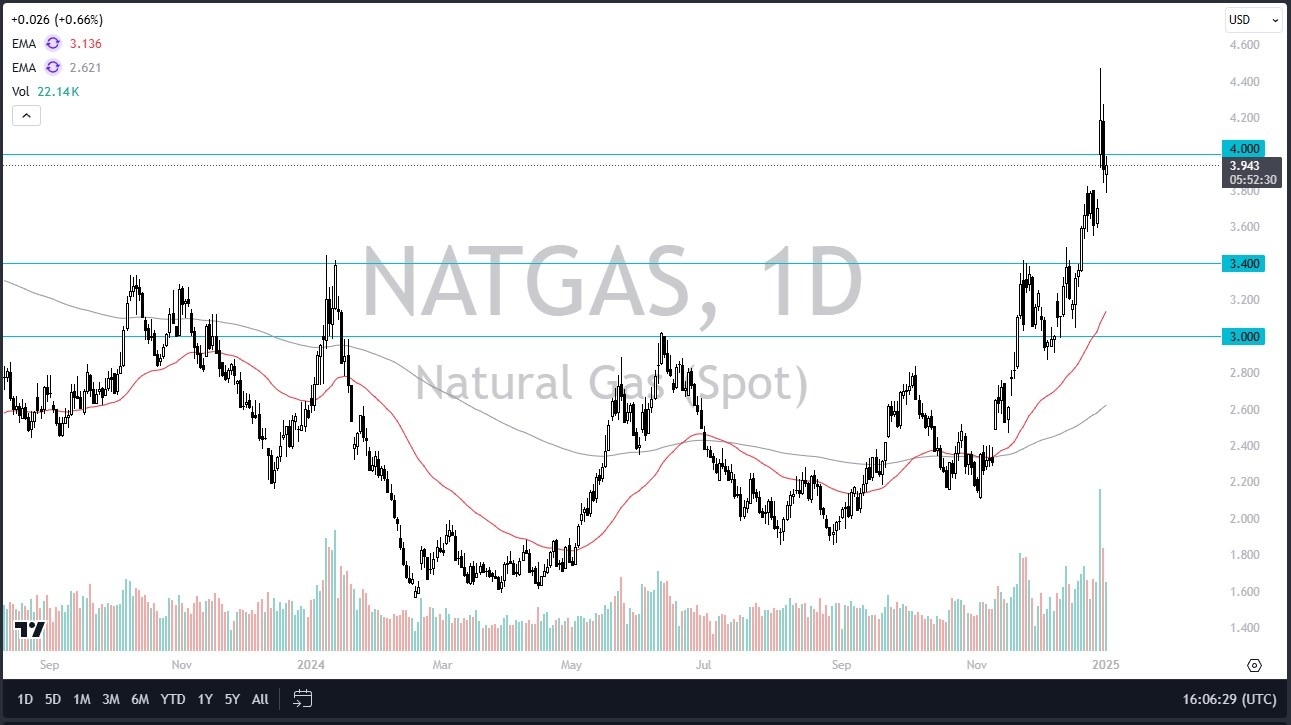
  • The natural gas markets were somewhat noisy during the early hours on Thursday, which is not surprising considering the massive move higher that we’ve seen over the last couple of weeks, and the lack of liquidity.
  • With all that being said, I think you’ve got a situation where traders will have to look at this through the prism of whether or not they can find value.

I suspect at this point we are trying to price in those colder than anticipated temperatures in the United States coming with that Arctic blast. But I think you also have to keep in mind that the futures traders out there will be looking towards spring before you know it. So, I think we only have maybe one or two more pullbacks and bounces for the rest of the season.

Pullbacks? Please.

I do like the idea of buying a pullback if we get it. We did not quite fill the gap from earlier this week, but we’ve gotten pretty close. So, I think that’s probably close enough for government work as it were. I do think that if we can overtake the $4 level in the spot market, that opens up a potential move all the way to the $4.50 level followed by $5. I don’t like the idea of chasing the market with a huge position though. I’d be much more comfortable buying a dip closer to $3.50 with a bigger position. But I recognize that at this time, it’s obvious natural gas is breaking out.

The question is, will it have any follow through? I suspect the answer is probably yes before it’s all said and done, but the next week is going to be very erratic as we try to price in more liquidity, and of course, the idea of temperatures plummeting in the United States because they can turn around just as quickly. And if that happens, natural gas falls. There is the outlier of Europe though, and Russian gas not flowing through Ukraine, of course has somewhat of an influence as Europeans will be buying LNG from the United States, but really at this point in time, I don’t know if that is as much of a factor as the weather in New England, for example.

Ready to trade daily Forex analysis? We’ve shortlisted the best commodity brokers in the industry for you. 


Source link

3 01, 2025

Euro not out of woods despite recent rebound

By |2025-01-03T13:12:14+02:00January 3, 2025|Forex News, News|0 Comments

  • EUR/USD recovers toward 1.0300 in the European session on Friday.
  • The pair remains technically bearish in the near term.
  • The US economic calendar will offer ISM Manufacturing PMI data for December.

EUR/USD came under heavy bearish pressure on the first trading day of 2025 and dropped to its weakest level in over two years at 1.0224. Although the pair stages a rebound toward 1.0300 in the European morning on Friday, the technical outlook suggests that the near-term bias remains bearish.

Euro PRICE This week

The table below shows the percentage change of Euro (EUR) against listed major currencies this week. Euro was the weakest against the Japanese Yen.

  USD EUR GBP JPY CAD AUD NZD CHF
USD   1.44% 1.46% -0.28% -0.13% 0.19% 0.59% 1.01%
EUR -1.44%   0.02% -1.73% -1.59% -1.30% -0.88% -0.48%
GBP -1.46% -0.02%   -1.75% -1.61% -1.31% -0.90% -0.49%
JPY 0.28% 1.73% 1.75%   0.15% 0.53% 1.03% 1.37%
CAD 0.13% 1.59% 1.61% -0.15%   0.31% 0.78% 1.13%
AUD -0.19% 1.30% 1.31% -0.53% -0.31%   0.42% 0.83%
NZD -0.59% 0.88% 0.90% -1.03% -0.78% -0.42%   0.41%
CHF -1.01% 0.48% 0.49% -1.37% -1.13% -0.83% -0.41%  

The heat map shows percentage changes of major currencies against each other. The base currency is picked from the left column, while the quote currency is picked from the top row. For example, if you pick the Euro from the left column and move along the horizontal line to the US Dollar, the percentage change displayed in the box will represent EUR (base)/USD (quote).

The broad-based US Dollar (USD) strength weighed heavily on EUR/USD on Thursday. The data published by the US Department of Labor showed that the weekly Initial Jobless Claims declined to 211,000 in the week ending December 28 from 220,000 in the previous week. This reading came in below the market expectation of 222,000 and helped the USD gather strength. Additionally, the cautious market stance put additional weight on EUR/USD’s shoulders.

In the American session on Friday, the ISM Manufacturing Purchasing Managers Index (PMI) data for December will be watched closely.

The headline Manufacturing PMI is expected to match November’s reading of 48.4. Investors will also pay close attention to the inflation component, the Prices Paid Index, which is forecast to rise to 51.7 from 50.3. A bigger increase than expected in the inflation component could support the USD and make it difficult for EUR/USD to hold its ground heading into the weekend. On the other hand, a disappointing headline PMI could have the opposite effect on the pair’s action.

EUR/USD Technical Analysis

The Relative Strength Index (RSI) indicator on the 4-hour chart recovered slightly above 30 from near-20 it touched on Thursday, suggesting that the bearish bias remains intact following a technical correction from oversold levels.

On the upside, 1.0300 (static level, round level) aligns as immediate resistance before 1.0350 (20-period Simple Moving Average (SMA), static level) and 1.0390-1.0400 (50-period SMA, static level). Looking south, first support could be seen at 1.0240 (static level) ahead of 1.0200 (static level, round level) and 1.0160 (static level from July 2022).

Euro FAQs

The Euro is the currency for the 19 European Union countries that belong to the Eurozone. It is the second most heavily traded currency in the world behind the US Dollar. In 2022, it accounted for 31% of all foreign exchange transactions, with an average daily turnover of over $2.2 trillion a day. EUR/USD is the most heavily traded currency pair in the world, accounting for an estimated 30% off all transactions, followed by EUR/JPY (4%), EUR/GBP (3%) and EUR/AUD (2%).

The European Central Bank (ECB) in Frankfurt, Germany, is the reserve bank for the Eurozone. The ECB sets interest rates and manages monetary policy. The ECB’s primary mandate is to maintain price stability, which means either controlling inflation or stimulating growth. Its primary tool is the raising or lowering of interest rates. Relatively high interest rates – or the expectation of higher rates – will usually benefit the Euro and vice versa. The ECB Governing Council makes monetary policy decisions at meetings held eight times a year. Decisions are made by heads of the Eurozone national banks and six permanent members, including the President of the ECB, Christine Lagarde.

Eurozone inflation data, measured by the Harmonized Index of Consumer Prices (HICP), is an important econometric for the Euro. If inflation rises more than expected, especially if above the ECB’s 2% target, it obliges the ECB to raise interest rates to bring it back under control. Relatively high interest rates compared to its counterparts will usually benefit the Euro, as it makes the region more attractive as a place for global investors to park their money.

Data releases gauge the health of the economy and can impact on the Euro. Indicators such as GDP, Manufacturing and Services PMIs, employment, and consumer sentiment surveys can all influence the direction of the single currency. A strong economy is good for the Euro. Not only does it attract more foreign investment but it may encourage the ECB to put up interest rates, which will directly strengthen the Euro. Otherwise, if economic data is weak, the Euro is likely to fall. Economic data for the four largest economies in the euro area (Germany, France, Italy and Spain) are especially significant, as they account for 75% of the Eurozone’s economy.

Another significant data release for the Euro is the Trade Balance. This indicator measures the difference between what a country earns from its exports and what it spends on imports over a given period. If a country produces highly sought after exports then its currency will gain in value purely from the extra demand created from foreign buyers seeking to purchase these goods. Therefore, a positive net Trade Balance strengthens a currency and vice versa for a negative balance.


Source link

Go to Top