About Editorial team of BIPNs

Main team of content of bipns.com. Any type of content should be approved by us.
30 12, 2024

Supplements: Helpful or harmful? | News

By |2024-12-30T18:20:25+02:00December 30, 2024|Dietary Supplements News, News|0 Comments


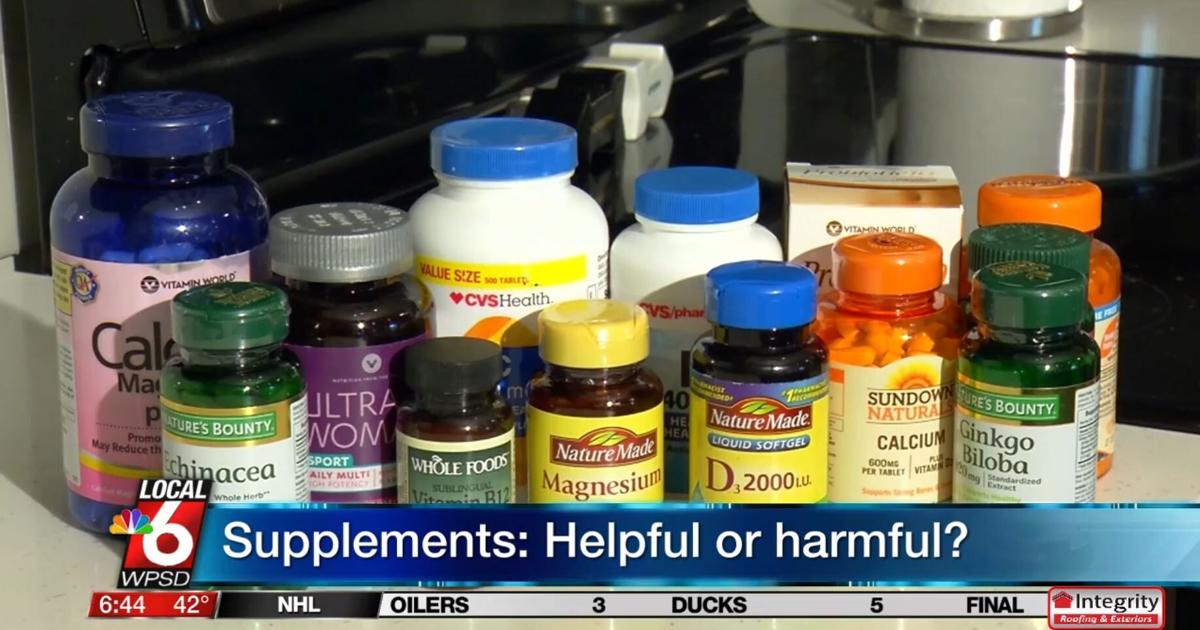
Most Americans use a dietary supplement, but are they helpful?

“They may be a waste of money and, in worst case scenario, they may be some harm,” Erin Michos, MD, an Associate Professor of Medicine at Johns Hopkins University School of Medicine, says.

About 59 million Americans use some type of vitamins or supplements regularly — but a new study shows some supplements may be putting your health at risk.

A new study published in JAMA Network Open found that at least 15.6 million US adults may have consumed an herbal product that could damage their liver in the last 30 days. The six worst offenders were: turmeric, green tea, ashwagandha, garcinia, cambogia, red yeast rice, and black cohosh.

A big problem with supplements is that the FDA doesn’t evaluate them for safety, effectiveness, or quality. “So many individuals are taking these when many well-done clinical trials have shown that these supplements are no better than placebo,” says Michos.

The new study found some of the herbal products had discrepancies between their ingredient lists and what was actually in them. The best way to ensure quality is to look for products that have been certified by a third-party company, such as NSF, USP, BSGC, or Consumer-Lab.

“I think individuals should talk to their doctors about do they need these supplements and why are they taking them,” Michos says.

The authors of the study noted that liver damage connected to herbal and dietary supplements use has been increasing, now accounting for more than 20% of liver injuries. Severe liver problems can lead to the need for a transplant  – or even death.


Source link

30 12, 2024

Solana Price Prediction for 2025: Can SOL Reach $500?

By |2024-12-30T18:14:30+02:00December 30, 2024|Crypto News, News|0 Comments

Solana was busy staging an incredible comeback, transforming from a troubled Layer-1 chain to become a powerhouse for DeFi and meme coins.

Forget Bitcoin’s 2024 headlines for a moment.

With SOL passing a $120 billion market cap last month, the question on everyone’s mind is: can the token continue rising to $500 in 2025?

Solana’s 2024 – A Year of Explosive Growth

Crypto has had a wild ride this year – and Solana has been in the thick of it.

Despite SOL briefly dipping below $10 in early 2023, the token roared back to life in 2024, hitting an all-time high of $263 in late November.

SOL has pulled back slightly from that high, now hovering around $192.

The token’s run-up wasn’t just due to hype; it’s all about how Solana’s ecosystem has exploded with activity.

Major partnerships with the likes of Visa and Google Cloud fueled institutional interest, while NFT traders and DeFi users flocked to the chain instead of other Layer-1s.

Super-fast transactions and low fees attracted developers, leading to viral meme coins like Bonk and DogWifHat.

There were even some groundbreaking AI experiments (like GOAT).

With rumors of potential SOL ETFs now heating up, the future looks bright for the Solana blockchain.

But will SOL be able to replicate (or beat) its success from this year?

Solana Price Prediction – How High Can SOL Go in 2025?

Looking ahead, the technicals seem bullish for SOL.

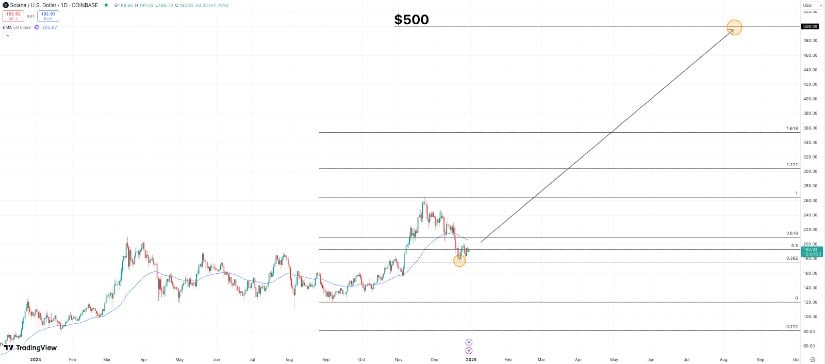
Even after its recent pullback, SOL is holding firm, bouncing off the 0.382 Fibonacci retracement level on the daily chart.

This suggests there could be upward momentum in early 2025 – and several key catalysts could lead to further gains.

Most notably, the upcoming Firedancer upgrade could boost Solana’s transaction speeds.

Plus, trends like SocialFi and the ever-growing meme coin niche might add to the demand for SOL.
Solana Price Prediction for 2025: Can SOL Reach 0?

Analysts are buzzing about the token’s prospects.

For example, the team at Altcoin Daily, which has over 1.7 million Twitter followers, even speculated that SOL would hit $2,000.

They didn’t provide a timeline, but such an ambitious target shows just how confident people are in Solana’s ecosystem.

However, while $2,000 might seem optimistic, there’s a case for SOL reaching more modest milestones – like $500.

That would represent a 159% increase from the token’s current price.

Given how explosive SOL’s rise was earlier in 2024, there’s every chance history could repeat itself in 2025.

Solana’s First Layer-2 Solaxy Raises Millions – Could SOLX Outshine SOL Next Year?

While SOL will likely get all the attention, some under-the-radar projects in the Solana ecosystem could post even bigger gains next year.

One name generating huge buzz isSolaxy (SOLX).

This new project has already raised $6.9 million in its presale – all in less than three weeks.

But why is everyone so excited?

https://x.com/SOLAXYTOKEN/status/1873021430268391773
The main reason is that Solaxy aims to be Solana’s first Layer-2 solution, tackling the pesky congestion issues that sometimes plague the network.

By processing transactions off-chain and building a bridge to Ethereum, Solaxy will boost scalability and interoperability.

These are two key ingredients for success in the blockchain space.

And investors are taking notice, scrambling to secure SOLX tokens for just $0.001584 before they go live on exchanges.

Those who decide to buy SOLX during the presale can evenstake their tokens for APYs of 555%.

In addition, since Coinsult has alreadyaudited the token, early investors can have confidence in Solaxy’s security.

Some big-name crypto influencers are beginning to talk about the project.

For example,NASS CRYPTO, who has over one million YouTube subscribers, said Solaxy is the “next evolution” in Layer-2 technology.

Of course, it’s still early days, and no one knows what the future holds.

But with Solana expected to continue growing, there will likely be even more demand for scaling solutions – setting the stage for Solaxy to thrive.

Visit Solaxy Presale


This is a sponsored article. Opinions expressed are solely those of the sponsor and readers should conduct their own due diligence before taking any action based on information presented in this article.

Source link

30 12, 2024

USD/JPY Analysis Today 30/12: Bullish Flag Formation (Chart)

By |2024-12-30T16:21:25+02:00December 30, 2024|Forex News, News|0 Comments

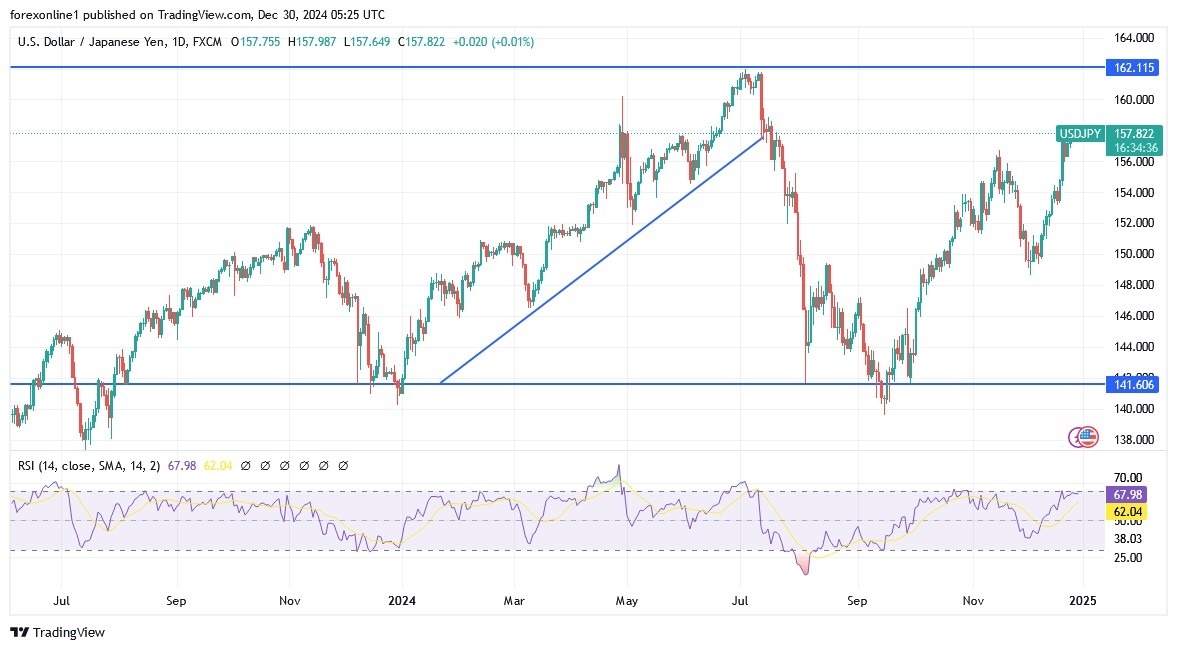
  • For eight consecutive trading sessions, the USD/JPY pair has been steadily rising, approaching the resistance level of 158.00, the highest level for the currency pair in five months.
  • This stability has formed a bullish flag on the daily chart, confirming the bulls’ control over the direction of the USD/JPY pair.
  • Also, bringing it closer to the next psychological resistance target of 160.00, which would increase talk of imminent Japanese intervention in the currency markets.

The Japanese Yen continues to be affected by the course of the Bank of Japan’s policy

The selling pressures on the Japanese yen against the rest of the other major currencies, led by the US dollar, continue as investors continue to assess the expectations of interest rates at the Bank of Japan. The summary of the Bank of Japan’s meeting in the last meeting of 2024 revealed that policymakers discussed the possibility of raising interest rates in the near term, as some bank officials suggested that the conditions were favourable for such a move. For its part, the Bank of Japan kept interest rates unchanged at 0.25%, with Governor Kazuo Ueda indicating the need to evaluate more data on wage growth next year and to gain more clarity on the economic policies of the incoming US administration. In general, investors are closely watching any potential intervention by the Japanese, especially after the Japanese Finance Minister reiterated concerns about the decline in the Japanese yen and repeated his warning against taking action against excessive movements in the currency.

At the same time, the performance of the Japanese yen faced additional pressure from rising US Treasury yields, despite recent US interest rate cuts.

Trading Tips:

The dollar/Japanese yen price will remain in an upward trend until the vision of Trump’s policies becomes clear and until there is Japanese intervention in the currency markets to stop the collapse of the yen against other currencies

Asian stock indices decline

According to today’s trading through stock trading company platforms, we have noticed a decline in Asian stock market indices today, Monday, as was the performance of US stock indices. Selling came amid uncertainty ahead of the end of 2024 and the inauguration of Trump as US President. According to trading, the MSCI Asia Pacific Index halted its five-day gain as shares in Australian and Japanese markets fell, while Chinese shares rose. At the same time, US 10-year Treasury yields remained near their highest levels since May after rising last week, which could affect the performance of stock prices. Due to the holidays, trading remains limited and within narrow ranges.

Also, it was noticeable that trading volumes for Japanese stocks were about 17% below their 30-day average, and Monday is the last trading session for Japanese financial markets this year, with public holidays from Tuesday to January 6. Overall, while Asian stocks are at their lowest levels today, they are still heading towards a strong annual performance. The MSCI Asia Pacific Index advanced 7.5% in 2024 as global central banks eased monetary policy and technology stocks rose amid optimism about artificial intelligence.

USD/JPY Technical Analysis and Expectations Today:

The USD/JPY currency pair continues to trade at levels slightly above the 100-hour moving average, and despite the decline. The USD/JPY pair remains centrally anchored in the 14-hour Relative Strength Index, leaving enough room for both bulls and bears to move. In the near term, bears will seek to extend the current decline towards 156.89 or lower to the support at 155.98. On the other hand, bulls will seek to take advantage of rebounds at around 158.51 or higher at the resistance 159.32.

In the long term, based on the performance on the daily chart, the USD/JPY pair is trading within an ascending channel formation. Also, the 14-day RSI supports a long-term bullish bias as it approaches overbought levels. Therefore, bulls will seek to continue the current winning streak to around 161.73 or above the resistance of 166.50. On the other hand, bears will seek to take advantage of the selling operations to book profits at around 153.31 or below the resistance of 148.86.

Want to trade our USD/JPY forex analysis and predictions? Here’s a list of forex brokers in Japan to check out. 

Source link

30 12, 2024

5 Supplements You Shouldn’t Take If You Have Inflammation

By |2024-12-30T16:19:31+02:00December 30, 2024|Dietary Supplements News, News|0 Comments


Managing inflammation can be tricky. While taking supplements may seem like a natural solution, not all of them are beneficial. In fact, some supplements can worsen inflammation or lead to other health issues. While acute inflammation is the body’s natural response to injury or infection, chronic inflammation can lead to serious health issues like heart disease, arthritis and autoimmune disorders. If you’re looking to keep inflammation at bay, these are five supplements you should avoid, according to experts.

1. Arnica (Oral Supplementation)

Arnica, a flowering herb in the sunflower family, is popular in homeopathic medicine for treating bruises, muscle pain and soreness when applied topically. However, it’s a different story when ingested. “Oral arnica can pose serious health risks, particularly for those with inflammation,” says Melissa Mitri, M.S., RD, a nutrition writer and owner of Melissa Mitri Nutrition. “While arnica is considered safe to apply topically to the skin, it shouldn’t be taken as an oral supplement for inflammation, as it can cause serious side effects, including heart damage, increased bleeding and vomiting.”

2. Chaparral

Chaparral is an herb derived from the desert shrub known as the creosote bush and has been historically used for its potential antioxidant and anti-inflammatory effects. However, chaparral’s toxic effects on the liver and kidneys outweigh its benefits. “Chaparral can lead to severe liver and kidney damage,” warns Mitri, adding that the herb is banned in several countries, including Canada, due to these risks.

3. Cat’s Claw

Cat’s claw is often touted for its immune-supporting and anti-inflammatory properties. Unfortunately, cat’s claw may not be as beneficial as portrayed. Mitri explains, “Cat’s claw may not be appropriate for those with autoimmune conditions, as it can overstimulate the immune system, potentially worsening autoimmune symptoms and increasing inflammation.”

Additionally, Mitri cautions that cat’s claw can interact with certain medications, including protease inhibitors used to treat HIV, and it may lower blood pressure or increase bleeding risk. “Cat’s claw’s risks for certain populations, particularly those with immune-related conditions, make it a poor choice for managing inflammation,” Mitri advises.

4. Spirulina

Spirulina is a nutrient-dense blue-green algae commonly used as a dietary supplement due to its high content of protein, vitamins and antioxidants. However, spirulina may not be suitable for everyone, particularly those with autoimmune or inflammatory conditions. “Spirulina can overstimulate the immune system, which can worsen symptoms in people with autoimmune diseases,” Mitri explains.

5. Kava

Kava is an herbal supplement traditionally used to promote relaxation and reduce stress, but it can pose issues for those with inflammatory conditions. “Kava has been shown to cause liver damage, which is especially concerning for people managing inflammation,” says Mitri. Since your liver is essential in detoxification and managing inflammation, compromised liver function can worsen overall health and inflammatory conditions.

Tips for Managing Inflammation Naturally

Instead of relying on potentially harmful supplements, Mitri suggests managing chronic inflammation through lifestyle and dietary changes.

  • Consume a Balanced Diet with Omega-3s: A nutrient-rich diet centered around whole, nutrient-dense foods is one of the best ways to reduce inflammation. “Increasing your intake of fruits, vegetables, lean proteins, whole grains, legumes and healthy fats can make a significant difference,” Mitri explains. “Also, omega-3s have well-documented anti-inflammatory properties that can help manage inflammation throughout your body.”
  • Avoid Inflammatory Foods: “Ultra-processed foods, added sugars and trans fats can all increase inflammation,” warns Mitri. “These include commercial baked goods, candy, sweetened yogurts, chips and high-added-sugar beverages.” Reducing or eliminating these foods can help prevent chronic inflammation and support long-term health.
  • Eat More Anti-Inflammatory Spices: Spices like turmeric and ginger have natural anti-inflammatory effects that research shows can help combat inflammation.
  • Adopt Healthy Lifestyle Habits: Lifestyle factors are essential in combating inflammation. “Regular physical activity, adequate sleep and effective stress management are critical for reducing inflammation,” Mitri emphasizes.

The Bottom Line

While supplements are often marketed as natural remedies for various health concerns, not all are safe for chronic inflammation. Supplements like arnica, chaparral, cat’s claw, kava and spirulina can worsen inflammatory conditions or cause severe side effects such as liver damage and immune overactivity. Always speak with a health care provider before adding any supplement to your routine.


Source link

30 12, 2024

ADA To Make New Highs In 2025 But This Crypto To Steal The Show

By |2024-12-30T16:13:41+02:00December 30, 2024|Crypto News, News|0 Comments

SPONSORED POST*

Layer-1’s like Cardano usually present the best risk-reward opportunities, and they can act as hedges for riskier plays within a portfolio.

RBLK is arguably one of the best low caps for netting sizable returns above 25x this bull run. Read on to learn more about this new iGaming gem as it traverses through its presale.

Set To Lead The iGaming 2025 Renaissance: Discover Why Rollblock Is All The Rage As 2024 Concludes

As the crypto market recovers, Rollblock stands out as a strong contender in the iGaming sector. Projections suggest a 70% rise in the near term, as audits from SolidProof and Anjouan Gaming solidify Rollblock’s legitimacy in time for the 2025 crypto-gaming rally.

Rollblock’s ecosystem is continuously expanding, boasting over 7,000 games in its library. Collaborations with top blockchain developers and insights from its growing community are set to drive innovation, including the recent launch of sports betting services and over 100 planned games to be released in 2025.

With a rapidly growing user base exceeding 35,000, Rollblock provides multiple ways for users to earn income aside from holding the RBLK token. From staking for passive income to play-to-earn gaming rewards, including a token-burning mechanism that enhances the value of RBLK tokens, the platform is built from the ground up to reward loyal users.

Bullish Developments Bode Well For Cardano As The Next Market Rally Looms Closer

Cardano is capturing significant attention as it mirrors historical patterns that suggest a major breakout is on the horizon. The current price trajectory for Cardano closely resembles its 2021 bull cycle, and increasing whale activity indicates growing confidence for Cardano amongst big buyers. However, short-term challenges persist, including a 4.3 billion ADA sell wall between $0.947 and $1.09, creating resistance that may delay a recovery to the $1 mark. 

However, the incoming pro-crypto Trump administration, set to take office in January 2025, offers a promising regulatory backdrop for the crypto market including for Cardano. Charles Hoskinson’s potential advisory role within the administration adds credibility to Cardano’s standing in the blockchain space, and regulatory clarity could provide a significant boost to Cardano, particularly as it shifts toward becoming a Bitcoin Layer-2 chain by mid-2025. 

Cardano is also strengthening its ecosystem with the introduction of Lace, a native wallet designed to streamline user interactions with the blockchain. With plans for a mobile app down the line, Lace aims to attract millions of users, positioning Cardano for broader adoption and reinforcing its appeal as a leading blockchain network similar to what PhantomWallet did for Solana.

Many analysts project a realistic price target of $5 to $6 for ADA during the 2025 bull run, with potential for even higher gains if adoption accelerates and broader market sentiment remains positive for Cardano.

Conclusion: Why ADA And RBLK Could Be The Best One-Two Punch For Any Crypto Portfolio

In the broader cryptocurrency market, Layer-1 blockchains like Cardano have historically proven to be the most reliable risk-reward options, thanks to their foundational role for ecosystem development. Limited to returns around 10x at most, however, many savvy investors suggest diversification with higher upside gems such as RBLK.

RBLK offers a unique opportunity for early investors to secure a promising position in the GameFi revolution, priced at just $0.044 in its ninth presale phase. This trailblazing project is one you won’t want to miss for potential returns above 25x; Don’t miss this chance!

Discover the Exciting Opportunities of the Rollblock (RBLK) Presale Today!

Website: https://presale.rollblock.io/

Socials: https://linktr.ee/rollblockcasino 

 *This article was paid for. Cryptonomist did not write the article or test the platform.

Source link

30 12, 2024

XAG/USD trades near weekly low around $29.50 in quiet trading mood

By |2024-12-30T15:30:22+02:00December 30, 2024|Forex News, News|0 Comments


  • Silver price hovers near $29.50 in an illiquid market with the US Dollar and bond yields closing the calendar year on a strong note.
  • The Fed sees the federal fund rate heading to 3.9% by the end of 2025.
  • Strong US economic growth prospects allowed the Fed to guide fewer interest rate cuts for the next year.

Silver price (XAG/USD) trades cautiously near Friday’s low around $29.50 in thin volume conditions before New Year on Monday. The white metal is broadly under pressure as the outlook of the US Dollar (USD) remains firm on expectations that a moderate policy-easing cycle by the Federal Reserve (Fed) in 2025 will keep US Treasury yields elevated.

10-year US Treasury yields are down 0.5% in Monday’s European session but are still almost 15% higher this calendar year near 4.60%.

The US Dollar Index (DXY), which tracks the Greenback’s value against six major currencies, ticks lower but remains broadly sideways around 108.00.

Market speculation for the Fed to follow a slower rate-cut path next year stemmed from the central bank’s latest dot plot, which showed that policymakers collectively see the Federal fund rate heading to 3.9% by the end of 2025.

Fed policymakers shifted their stance on interest rates from ‘dovish’ to ‘cautious’ as they were upbeat about the United States’ (US) economic growth. Additionally, a slowdown in the disinflation process in the last few months forced them to guide fewer rate cuts for the next year.

This week, investors will focus on the US ISM Manufacturing PMI data for December, which will be released on Friday. The Manufacturing PMI is estimated to have come in at 48.3, slightly lower than 48.4, which suggests that manufacturing output contracted at a slightly faster pace.

Silver technical analysis

Silver price stays below the upward-sloping trendline after a breakdown near $30.00, which is plotted from the February 29 low of $22.30 on a daily timeframe,. The white metal wobbles around the 200-day Exponential Moving Average (EMA), suggesting that the longer-term outlook is uncertain.

The 14-day Relative Strength Index (RSI) falls inside the 20.00-40.00. A fresh bearish momentum would trigger if it sustains in that range.

Looking down, the September low of $27.75 would act as key support for the Silver price. On the upside, the 50-day EMA around $30.90 would be the barrier.

Silver daily chart

Silver FAQs

Silver is a precious metal highly traded among investors. It has been historically used as a store of value and a medium of exchange. Although less popular than Gold, traders may turn to Silver to diversify their investment portfolio, for its intrinsic value or as a potential hedge during high-inflation periods. Investors can buy physical Silver, in coins or in bars, or trade it through vehicles such as Exchange Traded Funds, which track its price on international markets.

Silver prices can move due to a wide range of factors. Geopolitical instability or fears of a deep recession can make Silver price escalate due to its safe-haven status, although to a lesser extent than Gold’s. As a yieldless asset, Silver tends to rise with lower interest rates. Its moves also depend on how the US Dollar (USD) behaves as the asset is priced in dollars (XAG/USD). A strong Dollar tends to keep the price of Silver at bay, whereas a weaker Dollar is likely to propel prices up. Other factors such as investment demand, mining supply – Silver is much more abundant than Gold – and recycling rates can also affect prices.

Silver is widely used in industry, particularly in sectors such as electronics or solar energy, as it has one of the highest electric conductivity of all metals – more than Copper and Gold. A surge in demand can increase prices, while a decline tends to lower them. Dynamics in the US, Chinese and Indian economies can also contribute to price swings: for the US and particularly China, their big industrial sectors use Silver in various processes; in India, consumers’ demand for the precious metal for jewellery also plays a key role in setting prices.

Silver prices tend to follow Gold’s moves. When Gold prices rise, Silver typically follows suit, as their status as safe-haven assets is similar. The Gold/Silver ratio, which shows the number of ounces of Silver needed to equal the value of one ounce of Gold, may help to determine the relative valuation between both metals. Some investors may consider a high ratio as an indicator that Silver is undervalued, or Gold is overvalued. On the contrary, a low ratio might suggest that Gold is undervalued relative to Silver.


Source link

30 12, 2024

USD/JPY Forecast Today 30/12: Struggles at 158 (Video)

By |2024-12-30T14:19:44+02:00December 30, 2024|Forex News, News|0 Comments

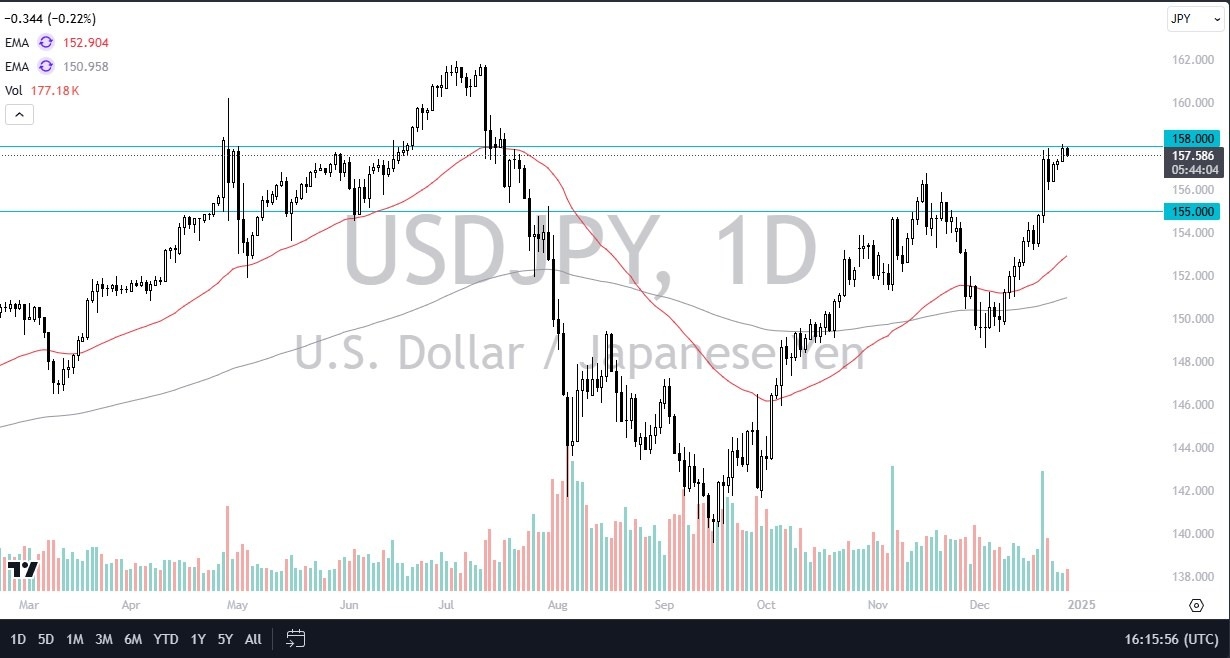
  • The US dollar pulled back just a bit during the early hours on Friday, as it looks like the 158 yen level continues to be a major barrier.
  • This is an area where we’ve seen a lot of action in the past, so it does make a certain amount of sense that we would continue to look at this through the prism of a market that’s trying to bust through a major barrier.

I think it’s going to take some work, and I also think it is difficult to assume that the market is just going to be able to slice through there. Longer term, I do believe that the interest rate differential in the United States, in comparison to Japan will be a major factor. And we will eventually break out to the upside, but we may have to pull back a couple of times in order to build up pressure in a market that is a little extended. And of course, we also have the specter of illiquidity at the moment due to the fact that we are between two major holidays.

In Conclusion

So, in short, the way I look at this USD/JPY chart is I am trying to find a buying opportunity on pullbacks that show signs of a bounce. I would be very patient at this point in time, there’s no need to rush this because once traders come back after New Year’s Day, it is likely to be very volatile and very noisy. Therefore, you have to keep in mind that you’ve got a situation where traders will probably have to deal with a lot of back and forth chops.

The 155 yen level at the moment for me at least is going to be the floor in the market. If we were to break down below there, then we may have to rethink some things. But as things stand right now, I just think you don’t have enough volume in the market to finally break out above the 158 yen level, at least not right now.

Want to trade our USD/JPY forex analysis and predictions? Here’s a list of forex brokers in Japan to check out. 

Source link

30 12, 2024

Your browser is not supported

By |2024-12-30T14:18:19+02:00December 30, 2024|Dietary Supplements News, News|0 Comments


Your browser is not supported | statesman.com

statesman.com wants to ensure the best experience for all of our readers, so we built our site to take advantage of the latest technology, making it faster and easier to use.

Unfortunately, your browser is not supported. Please download one of these browsers for the best experience on statesman.com


Source link

30 12, 2024

Why Is XRP Going Down Today? Price Drops to December Lows, Analyst Predicts $50 in 2025

By |2024-12-30T14:12:07+02:00December 30, 2024|Crypto News, News|0 Comments

XRP, one of
the biggest cryptocurrencies used by Ripple, tumbled to December lows of $2.04
on Monday, leading cryptocurrency market losses as a strengthening U.S. dollar
and year-end profit-taking pressured digital assets.

Let’s
examine why XRP is down and what technical analysis suggests about future
movements. We’ll also review XRP price predictions from analysts and experts.

The
fourth-largest cryptocurrency by market capitalization has dropped nearly 30%
from its December 3 peak of $2.9, with a 6% decline in the past 24 hours alone.
The token’s trading volume stands at $4.5 billion, indicating significant
selling pressure as investors reduce exposure ahead of year-end.

XRP price is currently in a downward correction. Source: CoinMarketCap.com

The decline
is also causing liquidations in the leveraged market. Over the past 24 hours,
these liquidations totaled $173 million, with the majority being long
positions. A significant portion of these liquidations, approximately $7
million in long positions, was attributed to XRP.

The
cryptocurrency market’s traditional year-end rally hopes have faded, with
Bitcoin retreating from its recent all-time high of $108,000 to trade around
$93,700, marking a 12.6% weekly decline. Other major cryptocurrencies have
followed suit, with Ethereum falling 15.5% to $3,337 and Solana showing a 15.9%
weekly slump.

The U.S.
Dollar Index’s surge to 108.5, its highest level in months, has emerged as a
key factor pressuring cryptocurrency valuations. This strengthening dollar has
made speculative assets less attractive to investors, particularly affecting
dollar-denominated assets like cryptocurrencies.

The USD
hasn’t been this strong in over 20 years, which certainly makes it harder for
cryptocurrencies denominated in it to sustain growth during an already extended
bull run.

XRP Technical Analysis

The current
market structure shows XRP trading above key support levels, with immediate
resistance at $2.5. Technical analysts have identified $2.0-1.96 as a crucial
support level that needs to hold to prevent further decline.

In my view,
XRP is still moving within a time-limited pennant chart pattern, with its lower
boundary currently aligning with the mentioned psychological support level and
December lows. A breakout above this level would not only allow XRP to overcome
current resistance dynamically but also provide a chance for a measured upward
movement towards the $4 or even $5 level.

XRP price technical analysis and pennant chart pattern. Source: Tradingview.com

This
scenario would be invalidated if the price falls below the lower boundary of
the pennant and the psychological support at $2. In that case, the bears could
regain control, and the chart would return to a downtrend.

XRP price key support and
resistance levels

  • XRP Price Support Levels:
  • $2.0 – Psychological support level
  • $1.9 – December 10 lows
  • Lower
    boundary of the pennant chart pattern

XRP Price Resistance Levels:

  • $2.3 – Upper boundary of the pennant
    formation
  • $2.4–$2.5 – Local highs from the past two
    weeks
  • $2.73 – December 17 highs
  • $2.9 – December 3 highs

XRP Price Predictions:
Future Outlook

Despite the
current downturn, some analysts maintain a bullish long-term outlook. The
January Effect could provide some relief to the market in the coming weeks.

For
December 2024, analysts project a minimum price of $1.91 for XRP, with a
maximum potential of $2.5. However, the immediate focus remains on defending
current support levels to prevent further deterioration in market sentiment.

In January
2025, XRP is projected to trade within a range of $1.35 to $2.12. By February,
the price is expected to fluctuate slightly, moving between $1.30 and $2.50. Looking
ahead to the end of 2025, if institutional adoption continues to gain momentum,
XRP could potentially climb to $5 or higher, reflecting increased market
confidence and demand.

For
instance, Egrag, a popular analyst with 70,000 followers on X (formerly
Twitter), believes that XRP could rise to $50 in 2025.

“The next
10 days are crucial for XRP. From a pure technical analysis perspective
(ignoring fundamentals for a moment), this could be the most pivotal price
action in XRP’s history,” Egrag commented.

Market
participants are also closely watching the incoming Trump administration’s
potential impact on the crypto sector
. The appointment of pro-crypto SEC
chairman Paul Atkins and potential regulatory clarity could serve as catalysts
for future price recovery.

XRP Price, FAQ

What is the expected price
of XRP in 2025?

XRP price
projections for 2025 show varying estimates. Conservative forecasts suggest a
trading range between $1.35 and $2.50. However, crypto expert Levi Rietveld
presents a more optimistic outlook, suggesting XRP could reach $20-23, with an
extremely bullish scenario of $70 per coin.

Why is the XRP coin
falling?

XRP’s
recent decline stems from multiple factors. The token has experienced
significant selling pressure due to massive liquidations totaling $14.5 million
in leveraged long positions. Additionally, Bitcoin’s dominance and market focus
shift have redirected capital flows away from altcoins. The strengthening U.S.
Dollar Index has also pressured cryptocurrency valuations.

Does XRP have a future?

XRP’s
future appears promising, particularly in the financial technology sector. The
platform continues to expand its partnerships across Asia, Africa, and Latin
America. The cryptocurrency’s role in cross-border payments and growing
institutional adoption suggest strong potential for long-term growth. By
2027-2028, XRP could become more integrated into traditional finance and
blockchain solutions.

Is XRP ever going to
recover?

Technical
analysis indicates positive recovery potential despite current bearish
pressure. XRP maintains support at key levels, including the 23.6% Fibonacci
retracement near $2.33. The token’s growing network activity and increasing
institutional adoption support the possibility of price recovery. Market
experts anticipate potential upward movement once the current correction phase
concludes.

Can XRP reach $500?

Reaching
$500 appears highly improbable in the near term. Such a valuation would require
XRP’s market capitalization to exceed $26 trillion, surpassing the combined
value of the world’s largest companies6. While some analysts project growth
potential, more realistic estimates suggest price targets between $15-25 by
2030. Grok AI suggests $500 might only be possible beyond 2030, contingent on
widespread global payment adoption.

XRP, one of
the biggest cryptocurrencies used by Ripple, tumbled to December lows of $2.04
on Monday, leading cryptocurrency market losses as a strengthening U.S. dollar
and year-end profit-taking pressured digital assets.

Let’s
examine why XRP is down and what technical analysis suggests about future
movements. We’ll also review XRP price predictions from analysts and experts.

The
fourth-largest cryptocurrency by market capitalization has dropped nearly 30%
from its December 3 peak of $2.9, with a 6% decline in the past 24 hours alone.
The token’s trading volume stands at $4.5 billion, indicating significant
selling pressure as investors reduce exposure ahead of year-end.

XRP price is currently in a downward correction. Source: CoinMarketCap.com

The decline
is also causing liquidations in the leveraged market. Over the past 24 hours,
these liquidations totaled $173 million, with the majority being long
positions. A significant portion of these liquidations, approximately $7
million in long positions, was attributed to XRP.

The
cryptocurrency market’s traditional year-end rally hopes have faded, with
Bitcoin retreating from its recent all-time high of $108,000 to trade around
$93,700, marking a 12.6% weekly decline. Other major cryptocurrencies have
followed suit, with Ethereum falling 15.5% to $3,337 and Solana showing a 15.9%
weekly slump.

The U.S.
Dollar Index’s surge to 108.5, its highest level in months, has emerged as a
key factor pressuring cryptocurrency valuations. This strengthening dollar has
made speculative assets less attractive to investors, particularly affecting
dollar-denominated assets like cryptocurrencies.

The USD
hasn’t been this strong in over 20 years, which certainly makes it harder for
cryptocurrencies denominated in it to sustain growth during an already extended
bull run.

XRP Technical Analysis

The current
market structure shows XRP trading above key support levels, with immediate
resistance at $2.5. Technical analysts have identified $2.0-1.96 as a crucial
support level that needs to hold to prevent further decline.

In my view,
XRP is still moving within a time-limited pennant chart pattern, with its lower
boundary currently aligning with the mentioned psychological support level and
December lows. A breakout above this level would not only allow XRP to overcome
current resistance dynamically but also provide a chance for a measured upward
movement towards the $4 or even $5 level.

XRP price technical analysis and pennant chart pattern. Source: Tradingview.com

This
scenario would be invalidated if the price falls below the lower boundary of
the pennant and the psychological support at $2. In that case, the bears could
regain control, and the chart would return to a downtrend.

XRP price key support and
resistance levels

  • XRP Price Support Levels:
  • $2.0 – Psychological support level
  • $1.9 – December 10 lows
  • Lower
    boundary of the pennant chart pattern

XRP Price Resistance Levels:

  • $2.3 – Upper boundary of the pennant
    formation
  • $2.4–$2.5 – Local highs from the past two
    weeks
  • $2.73 – December 17 highs
  • $2.9 – December 3 highs

XRP Price Predictions:
Future Outlook

Despite the
current downturn, some analysts maintain a bullish long-term outlook. The
January Effect could provide some relief to the market in the coming weeks.

For
December 2024, analysts project a minimum price of $1.91 for XRP, with a
maximum potential of $2.5. However, the immediate focus remains on defending
current support levels to prevent further deterioration in market sentiment.

In January
2025, XRP is projected to trade within a range of $1.35 to $2.12. By February,
the price is expected to fluctuate slightly, moving between $1.30 and $2.50. Looking
ahead to the end of 2025, if institutional adoption continues to gain momentum,
XRP could potentially climb to $5 or higher, reflecting increased market
confidence and demand.

For
instance, Egrag, a popular analyst with 70,000 followers on X (formerly
Twitter), believes that XRP could rise to $50 in 2025.

“The next
10 days are crucial for XRP. From a pure technical analysis perspective
(ignoring fundamentals for a moment), this could be the most pivotal price
action in XRP’s history,” Egrag commented.

Market
participants are also closely watching the incoming Trump administration’s
potential impact on the crypto sector
. The appointment of pro-crypto SEC
chairman Paul Atkins and potential regulatory clarity could serve as catalysts
for future price recovery.

XRP Price, FAQ

What is the expected price
of XRP in 2025?

XRP price
projections for 2025 show varying estimates. Conservative forecasts suggest a
trading range between $1.35 and $2.50. However, crypto expert Levi Rietveld
presents a more optimistic outlook, suggesting XRP could reach $20-23, with an
extremely bullish scenario of $70 per coin.

Why is the XRP coin
falling?

XRP’s
recent decline stems from multiple factors. The token has experienced
significant selling pressure due to massive liquidations totaling $14.5 million
in leveraged long positions. Additionally, Bitcoin’s dominance and market focus
shift have redirected capital flows away from altcoins. The strengthening U.S.
Dollar Index has also pressured cryptocurrency valuations.

Does XRP have a future?

XRP’s
future appears promising, particularly in the financial technology sector. The
platform continues to expand its partnerships across Asia, Africa, and Latin
America. The cryptocurrency’s role in cross-border payments and growing
institutional adoption suggest strong potential for long-term growth. By
2027-2028, XRP could become more integrated into traditional finance and
blockchain solutions.

Is XRP ever going to
recover?

Technical
analysis indicates positive recovery potential despite current bearish
pressure. XRP maintains support at key levels, including the 23.6% Fibonacci
retracement near $2.33. The token’s growing network activity and increasing
institutional adoption support the possibility of price recovery. Market
experts anticipate potential upward movement once the current correction phase
concludes.

Can XRP reach $500?

Reaching
$500 appears highly improbable in the near term. Such a valuation would require
XRP’s market capitalization to exceed $26 trillion, surpassing the combined
value of the world’s largest companies6. While some analysts project growth
potential, more realistic estimates suggest price targets between $15-25 by
2030. Grok AI suggests $500 might only be possible beyond 2030, contingent on
widespread global payment adoption.


Source link

30 12, 2024

Euro looks to extend sideways action

By |2024-12-30T12:18:45+02:00December 30, 2024|Forex News, News|0 Comments

  • EUR/USD continues to trade in a narrow channel above 1.0400.
  • The near-term technical outlook fails to offer a directional clue.
  • Cautious comments from ECB officials help the Euro stay resilient against its rivals.

After ending the holiday-shortened week virtually unchanged, EUR/USD extends its sideways grind slightly above 1.0400 in the European session on Monday. The pair is likely to remain stuck in a tight range, with trading conditions unlikely to normalize until after the New Year holiday.

Euro PRICE Last 7 days

The table below shows the percentage change of Euro (EUR) against listed major currencies last 7 days. Euro was the weakest against the New Zealand Dollar.

  USD EUR GBP JPY CAD AUD NZD CHF
USD   0.09% -0.06% 0.93% 0.23% 0.20% -0.13% 1.04%
EUR -0.09%   -0.17% 0.77% 0.12% 0.18% -0.23% 0.94%
GBP 0.06% 0.17%   0.91% 0.29% 0.35% -0.05% 1.12%
JPY -0.93% -0.77% -0.91%   -0.65% -0.65% -1.02% 0.05%
CAD -0.23% -0.12% -0.29% 0.65%   0.02% -0.36% 0.81%
AUD -0.20% -0.18% -0.35% 0.65% -0.02%   -0.41% 0.76%
NZD 0.13% 0.23% 0.05% 1.02% 0.36% 0.41%   1.13%
CHF -1.04% -0.94% -1.12% -0.05% -0.81% -0.76% -1.13%  

The heat map shows percentage changes of major currencies against each other. The base currency is picked from the left column, while the quote currency is picked from the top row. For example, if you pick the Euro from the left column and move along the horizontal line to the US Dollar, the percentage change displayed in the box will represent EUR (base)/USD (quote).

In an interview with Austrian newspaper Kurier over the weekend, European Central Bank (ECB) Governing Council member Robert Holzmann said that it might take more time until the ECB cuts rates again. “There are signs of an upward trend in some energy prices. But there are also other scenarios as to how inflation could return, like via a stronger devaluation of the euro,” Holzmann elaborated.

These comments seem to be helping the Euro hold its ground. In the second half of the day, Pending Home Sales for November and Chicago Purchasing Managers Index for December will be featured in the US economic calendar. These data, however, are unlikely to influence the US Dollar’s (USD) valuation in a noticeable way.

In the meantime, US stock index futures trade in negative territory, reflecting a cautious market mood. In case Wall Street’s main indexes turn south after the opening bell, EUR/USD could have a hard time keeping its footing.

EUR/USD Technical Analysis

The Relative Strength Index (RSI) indicator on the 4-hour chart holds slightly above 50 and EUR/USD stays above the 20 and the 50-period Simple Moving Averages (SMA), reflecting a lack of seller interest.

EUR/USD could face first resistance at 1.0440 (static level) before 1.0470 (100-period SMA) and 1.0500 (200-period SMA). On the downside, 1.0400 (round level, static level) could be seen as interim support ahead of 1.0350 (static level) and 1.0300 (static level, round level).

Euro FAQs

The Euro is the currency for the 19 European Union countries that belong to the Eurozone. It is the second most heavily traded currency in the world behind the US Dollar. In 2022, it accounted for 31% of all foreign exchange transactions, with an average daily turnover of over $2.2 trillion a day. EUR/USD is the most heavily traded currency pair in the world, accounting for an estimated 30% off all transactions, followed by EUR/JPY (4%), EUR/GBP (3%) and EUR/AUD (2%).

The European Central Bank (ECB) in Frankfurt, Germany, is the reserve bank for the Eurozone. The ECB sets interest rates and manages monetary policy. The ECB’s primary mandate is to maintain price stability, which means either controlling inflation or stimulating growth. Its primary tool is the raising or lowering of interest rates. Relatively high interest rates – or the expectation of higher rates – will usually benefit the Euro and vice versa. The ECB Governing Council makes monetary policy decisions at meetings held eight times a year. Decisions are made by heads of the Eurozone national banks and six permanent members, including the President of the ECB, Christine Lagarde.

Eurozone inflation data, measured by the Harmonized Index of Consumer Prices (HICP), is an important econometric for the Euro. If inflation rises more than expected, especially if above the ECB’s 2% target, it obliges the ECB to raise interest rates to bring it back under control. Relatively high interest rates compared to its counterparts will usually benefit the Euro, as it makes the region more attractive as a place for global investors to park their money.

Data releases gauge the health of the economy and can impact on the Euro. Indicators such as GDP, Manufacturing and Services PMIs, employment, and consumer sentiment surveys can all influence the direction of the single currency. A strong economy is good for the Euro. Not only does it attract more foreign investment but it may encourage the ECB to put up interest rates, which will directly strengthen the Euro. Otherwise, if economic data is weak, the Euro is likely to fall. Economic data for the four largest economies in the euro area (Germany, France, Italy and Spain) are especially significant, as they account for 75% of the Eurozone’s economy.

Another significant data release for the Euro is the Trade Balance. This indicator measures the difference between what a country earns from its exports and what it spends on imports over a given period. If a country produces highly sought after exports then its currency will gain in value purely from the extra demand created from foreign buyers seeking to purchase these goods. Therefore, a positive net Trade Balance strengthens a currency and vice versa for a negative balance.


Source link

Go to Top