New Delhi: The health and wellness industry has made significant strides by incorporating modern technologies in health monitoring systems. These innovations are revolutionizing our monitoring, managing, and improving individual health. With AI enabling more accurate predictions and real-time analysis, the future of personal healthcare is becoming increasingly accessible and practical.
As the industry continues to evolve, focus is no longer only on technological innovation but also ensuring that products and services meet the regulatory standards of approval to boost consumer confidence.
At the ETHealthworld Nutriwell Conclave, a panel discussion titled ‘Decoding Regulatory Pathways for Health Supplements & Nutraceuticals’ featured prominent experts, including Dr. Manisha Shridhar, Regional Advisor, IP Rights, Trade and Public Health, SEARO WHO, Dr. Kavitha Ramasamy, Joint Director, Food Safety and Standards Authority of India, and Varsha Misra, Deputy Director, National Accreditation Board for Certification Bodies, QCI, Govt. of India. The panel was moderated by Pawan Kumar Agarwal, CEO, Food Future Foundation & Former CEO FSSAI.
The growing global demand for nutraceuticals and health supplements underscores the critical need for robust regulatory frameworks and reliable accreditation systems. These measures ensure the safety, efficacy, and quality of products that reach consumers. Highlighting the complexity of this task, Pawan Kumar Agarwal, CEO of the Food Future Foundation, remarked, “To ensure standards are met, we rely on a large ecosystem of players, including accreditation bodies and audit agencies.”
The discussion also delved into the distinctions between nutraceuticals and food supplements. Dr. Manisha Shridhar, Regional Advisor for IP Rights, Trade and Public Health at SEARO WHO, explained, “In the area of nutraceuticals if you are doing clinical trials, it is a nutraceutical because it is closer to drug regulation. But if we don’t have to do clinical trials, then it is into the food supplements area.” She highlighted that good manufacturing practices are essential for maintaining safety standards, as public health depends on stringent regulations.
Expanding on the regulatory challenges, Dr. Shridhar pointed out the absence of reference materials in the nutraceutical sector. She noted, “Unlike drugs, where we have a reference material…there’s no reference material because every product is new, and which is why the engagement with business and industry becomes even more critical.” She also praised the stringent regulatory mechanisms of the United States, where the Federal Trade Commission (FTC) ensures that claims about health products are accurate. She added, “If there is an iota of doubt in terms of public health, they can take action and withhold a product. So this is something that we need to keep in mind.”
In India, significant progress has been made under the Food Safety and Standards Act (FSS Act) and the Food Safety and Standards Authority of India (FSSAI). Dr. Kavitha Ramasamy, Joint Director at FSSAI, elaborated, “The regulations created clear distinctions between health supplements and nutraceuticals, establishing specific lists of permitted ingredients (e.g., vitamins, minerals, botanicals, extracts) with defined limits. This categorization ensures that products are properly regulated, with health supplements primarily being combinations of basic nutrients, and nutraceuticals containing more specialized ingredients like botanical extracts.” She also emphasized that exceeding the recommended dietary allowance (RDA) limits set by the Indian Council of Medical Research (ICMR) categorizes a product as a drug, adding another layer of consumer protection.
Accreditation also plays a pivotal role in the global acceptance of products. Varsha Misra, Deputy Director at the National Accreditation Board for Certification Bodies (QCI), Government of India, stressed the importance of accredited certifications: “In accreditation, we have a terminology. We call it accepted everywhere if it is certified, inspected, and tested by an accredited certification body.” She emphasized that certification systems must be accredited to ensure global recognition, adding, “Certification is important…but you have to ensure this certification must be accredited, and this accreditation is going to give you a hand hold across the world.”
The role of AYUSH was also discussed, particularly its establishment of clear categories for health products such as health supplements, prebiotics, probiotics, and foods for special dietary uses. Dr. Ramasamy noted, “Given that clear categories have been defined by AYUSH, such as health supplements, foods for special dietary uses, prebiotics, and probiotics, we can ensure better regulation and understanding in these areas.” These classifications aid in transparent and effective regulation.
Finally, Dr. Shridhar emphasized the importance of avoiding false claims, particularly for traditional medical products and those classified as food supplements in different jurisdictions. She stated, “We cannot make a false claim on a product, and this is where a lot of work is focused, particularly when it comes to Ayush and traditional medical products.” Concluding the discussion, Varsha Misra reiterated the global importance of accredited certification: “It is not just about having a certification; it’s about whether the certificate is tested and accredited. Only then will it be accepted globally.”
Published On Dec 23, 2024 at 05:03 PM IST
Join the community of 2M+ industry professionals
Subscribe to our newsletter to get latest insights & analysis.
The crypto market experienced a significant sell-off today,
with Bitcoin (BTC) dropping notably below $94,000. Along with BTC, major
altcoin prices are also declining, and the total cryptocurrency market
capitalization has fallen to $3.3T, marking the lowest level in almost a month.
This sell-off stems from last week’s Federal Reserve’s (Fed’s)
monetary policy announcement, with
Bitcoin falling below $100,000. Market participants witnessed a sharp decline
across cryptocurrencies, triggering substantial liquidations and affecting the
total market capitalization.
The cryptocurrency market has had a challenging period over
the past day and week. Both Bitcoin and major altcoins, including Ethereum,
XRP, and Dogecoin, have experienced significant losses. During Monday’s
session, Bitcoin’s price briefly dipped below $94,000. While it has since
recovered somewhat to $95,800, it still shows an 8.5% decline over the past
week.
Ethereum has seen even steeper losses, dropping nearly 16%
during the same period, with its current price hovering around $3,300. XRP has
declined by 8% and now trades at $2.20. Meanwhile, the meme-inspired Dogecoin,
which ranks as the seventh-largest cryptocurrency by market capitalization, has
shed 21% of its value, currently trading at $0.31.
Major cryptocurrencies, including Bitcoin, are down today. Source: CoinMarketCap.com
These declines in major cryptocurrencies have negatively
impacted the total market capitalization, which now stands at just over $3.3
trillion – the lowest level in a month.
The Fear and Greed Index for cryptocurrencies, which had
consistently remained at extremely high greed levels, has now moved closer to
50, indicating a neutral market sentiment. This suggests investors are
currently in a wait-and-see mode, neither panicking about dramatic drops nor
eagerly buying the dip.
Total market cap test the lowest leveles since November. Source: CoinMarketCap.com
Liqudiations: Almost $300M in Crypto Leveraged Positions Gone
Despite the market downturn, there hasn’t been a significant
surge in leveraged position liquidations over the past 24 hours. According to
Coinglass data, $283 million in leveraged positions were liquidated, with $191
million in long positions and $92 million in short positions.
Current crypto liquidations. Source: Coinglass.com
Federal Reserve Factor, Why Is Crypto Down Today?
The Federal Reserve’s recent monetary policy stance has
significantly impacted the market. While the Fed cut rates by 0.25%, Fed Chair
Powell’s cautious statements about future rate cuts and emphasis on maintaining
restrictive policy to control inflation spooked investors. The Fed’s projection
of only two rate cuts in 2025 was less aggressive than markets had hoped.
The Fed’s decision had a significant impact on the
cryptocurrency market. When it was announced last Wednesday, Bitcoin slid from
near its historic highs, losing almost 6% in a single day. The current monthly
lows continue to be a direct consequence of Powell’s announcements.
Federal Reserve Chair Jerome Powell says the Fed is “not allowed to own Bitcoin”
They weren’t allowed to own Corporate Bonds before Covid either.
Global liquidity conditions are tightening, with central
banks reducing their balance sheets and rising bond market volatility making
conditions unfavorable for risk assets. This has particularly affected Bitcoin
and other cryptocurrencies, which are sensitive to liquidity changes.
Crypto Technical Analysis: Bitcoin, Ethereum, Dogecoin and XRP
From a technical analysis perspective, Bitcoin’s long-term
outlook remains relatively stable. BTC is retesting local support just below
$93,500, a level that has been regularly tested since late November.
This support coincides with the local peaks established on
November 13, when this level marked a new record high. Currently, Bitcoin faces
crucial technical support, reinforced by the round number of $92,000 and the
50-day exponential moving average. The psychological barrier of $90,000 lies
just below, which bulls are likely to defend strongly.
In my opinion, buyers should only become concerned about
Bitcoin’s future if the price drops below $74,000, where the 200-day
exponential moving average intersects with support levels from October 29. Key
resistance levels are at $100,000 (psychological), $104,000 (October 5 highs),
and $108,000 (current all-time high from December 16-17).
Ethereum is currently testing support at the 61.8% Fibonacci
retracement level, coinciding with month-old lows. Below this lies the more
significant support at $3,000, reinforced by the 200-day moving average and 50%
Fibonacci retracement.
Ethereum test Fibonacci retracement level. Source: Tradingview.com
Dogecoin has been forming support around $0.30 for nearly a
week, matching month-old lows. If this level fails to hold, we might see a
decline toward the 200-day EMA near $0.22.
Last month I was trying to find an answer to another important questions: “Will Dogecoin Reach $1?”
Why is Dogecoin down? Source: Tradingview.com
Finally, XRP has been maintaining local support at $2.20
since mid-November. Even if this level breaks, the psychological support at
$2.00 lies just below, and only a drop below this level might cause genuine
concern among Ripple token investors.
The crypto market is experiencing a significant decline
primarily due to the Federal Reserve’s recent monetary policy announcement.
Despite a 0.25% rate cut, Fed Chair Powell’s hawkish stance and indication of
fewer rate cuts in 2025 have dampened investor sentiment. Additionally,
tightening global liquidity conditions and rising bond market volatility have
created unfavorable conditions for risk assets.
Will crypto ever go up again?
Historical patterns and market fundamentals suggest recovery
potential, as evidenced by Bitcoin’s quick rebounds above $100,000 after recent
dips. The 2024 market has shown resilience through increased institutional
investment and favorable political developments, though current market
conditions remain volatile.
What has happened to crypto today?
Bitcoin has fallen below $94,000, while Ethereum dropped to
around $3,350. The total market capitalization has decreased to $3.3 trillion,
marking the lowest level in nearly a month. This decline triggered
approximately $1.5 billion in liquidations across the crypto market.
Why is Bitcoin dropping now?
Bitcoin’s decline is attributed to multiple factors: the
Federal Reserve’s hawkish stance on interest rates, fears of a
slower-than-expected rate cut cycle in 2025, and pre-holiday low liquidity
conditions. Market structure weaknesses and high leverage have also contributed
to the downward pressure.
Why is XRP crashing?
XRP’s decline aligns with the broader market downturn
following the Federal Reserve’s policy announcement. Like other
cryptocurrencies, XRP is responding to macroeconomic factors and the general
risk-off sentiment in the market.
Why is Dogecoin falling?
Dogecoin’s decline is attributed to multiple factors: the
Federal Reserve’s policy impact, decreasing transaction volume, and reduced
daily active addresses. Additionally, a recent network vulnerability that
resulted in 69% of Dogecoin nodes crashing has contributed to negative market
sentiment.
The crypto market experienced a significant sell-off today,
with Bitcoin (BTC) dropping notably below $94,000. Along with BTC, major
altcoin prices are also declining, and the total cryptocurrency market
capitalization has fallen to $3.3T, marking the lowest level in almost a month.
This sell-off stems from last week’s Federal Reserve’s (Fed’s)
monetary policy announcement, with
Bitcoin falling below $100,000. Market participants witnessed a sharp decline
across cryptocurrencies, triggering substantial liquidations and affecting the
total market capitalization.
The cryptocurrency market has had a challenging period over
the past day and week. Both Bitcoin and major altcoins, including Ethereum,
XRP, and Dogecoin, have experienced significant losses. During Monday’s
session, Bitcoin’s price briefly dipped below $94,000. While it has since
recovered somewhat to $95,800, it still shows an 8.5% decline over the past
week.
Ethereum has seen even steeper losses, dropping nearly 16%
during the same period, with its current price hovering around $3,300. XRP has
declined by 8% and now trades at $2.20. Meanwhile, the meme-inspired Dogecoin,
which ranks as the seventh-largest cryptocurrency by market capitalization, has
shed 21% of its value, currently trading at $0.31.
Major cryptocurrencies, including Bitcoin, are down today. Source: CoinMarketCap.com
These declines in major cryptocurrencies have negatively
impacted the total market capitalization, which now stands at just over $3.3
trillion – the lowest level in a month.
The Fear and Greed Index for cryptocurrencies, which had
consistently remained at extremely high greed levels, has now moved closer to
50, indicating a neutral market sentiment. This suggests investors are
currently in a wait-and-see mode, neither panicking about dramatic drops nor
eagerly buying the dip.
Total market cap test the lowest leveles since November. Source: CoinMarketCap.com
Liqudiations: Almost $300M in Crypto Leveraged Positions Gone
Despite the market downturn, there hasn’t been a significant
surge in leveraged position liquidations over the past 24 hours. According to
Coinglass data, $283 million in leveraged positions were liquidated, with $191
million in long positions and $92 million in short positions.
Current crypto liquidations. Source: Coinglass.com
Federal Reserve Factor, Why Is Crypto Down Today?
The Federal Reserve’s recent monetary policy stance has
significantly impacted the market. While the Fed cut rates by 0.25%, Fed Chair
Powell’s cautious statements about future rate cuts and emphasis on maintaining
restrictive policy to control inflation spooked investors. The Fed’s projection
of only two rate cuts in 2025 was less aggressive than markets had hoped.
The Fed’s decision had a significant impact on the
cryptocurrency market. When it was announced last Wednesday, Bitcoin slid from
near its historic highs, losing almost 6% in a single day. The current monthly
lows continue to be a direct consequence of Powell’s announcements.
Federal Reserve Chair Jerome Powell says the Fed is “not allowed to own Bitcoin”
They weren’t allowed to own Corporate Bonds before Covid either.
Global liquidity conditions are tightening, with central
banks reducing their balance sheets and rising bond market volatility making
conditions unfavorable for risk assets. This has particularly affected Bitcoin
and other cryptocurrencies, which are sensitive to liquidity changes.
Crypto Technical Analysis: Bitcoin, Ethereum, Dogecoin and XRP
From a technical analysis perspective, Bitcoin’s long-term
outlook remains relatively stable. BTC is retesting local support just below
$93,500, a level that has been regularly tested since late November.
This support coincides with the local peaks established on
November 13, when this level marked a new record high. Currently, Bitcoin faces
crucial technical support, reinforced by the round number of $92,000 and the
50-day exponential moving average. The psychological barrier of $90,000 lies
just below, which bulls are likely to defend strongly.
In my opinion, buyers should only become concerned about
Bitcoin’s future if the price drops below $74,000, where the 200-day
exponential moving average intersects with support levels from October 29. Key
resistance levels are at $100,000 (psychological), $104,000 (October 5 highs),
and $108,000 (current all-time high from December 16-17).
Ethereum is currently testing support at the 61.8% Fibonacci
retracement level, coinciding with month-old lows. Below this lies the more
significant support at $3,000, reinforced by the 200-day moving average and 50%
Fibonacci retracement.
Ethereum test Fibonacci retracement level. Source: Tradingview.com
Dogecoin has been forming support around $0.30 for nearly a
week, matching month-old lows. If this level fails to hold, we might see a
decline toward the 200-day EMA near $0.22.
Last month I was trying to find an answer to another important questions: “Will Dogecoin Reach $1?”
Why is Dogecoin down? Source: Tradingview.com
Finally, XRP has been maintaining local support at $2.20
since mid-November. Even if this level breaks, the psychological support at
$2.00 lies just below, and only a drop below this level might cause genuine
concern among Ripple token investors.
The crypto market is experiencing a significant decline
primarily due to the Federal Reserve’s recent monetary policy announcement.
Despite a 0.25% rate cut, Fed Chair Powell’s hawkish stance and indication of
fewer rate cuts in 2025 have dampened investor sentiment. Additionally,
tightening global liquidity conditions and rising bond market volatility have
created unfavorable conditions for risk assets.
Will crypto ever go up again?
Historical patterns and market fundamentals suggest recovery
potential, as evidenced by Bitcoin’s quick rebounds above $100,000 after recent
dips. The 2024 market has shown resilience through increased institutional
investment and favorable political developments, though current market
conditions remain volatile.
What has happened to crypto today?
Bitcoin has fallen below $94,000, while Ethereum dropped to
around $3,350. The total market capitalization has decreased to $3.3 trillion,
marking the lowest level in nearly a month. This decline triggered
approximately $1.5 billion in liquidations across the crypto market.
Why is Bitcoin dropping now?
Bitcoin’s decline is attributed to multiple factors: the
Federal Reserve’s hawkish stance on interest rates, fears of a
slower-than-expected rate cut cycle in 2025, and pre-holiday low liquidity
conditions. Market structure weaknesses and high leverage have also contributed
to the downward pressure.
Why is XRP crashing?
XRP’s decline aligns with the broader market downturn
following the Federal Reserve’s policy announcement. Like other
cryptocurrencies, XRP is responding to macroeconomic factors and the general
risk-off sentiment in the market.
Why is Dogecoin falling?
Dogecoin’s decline is attributed to multiple factors: the
Federal Reserve’s policy impact, decreasing transaction volume, and reduced
daily active addresses. Additionally, a recent network vulnerability that
resulted in 69% of Dogecoin nodes crashing has contributed to negative market
sentiment.
Silver price recovers some lost ground to around $29.60 in Monday’s Asian session.
The negative picture of Silver price prevails as the price holds below the 100-day EMA with the bearish RSI indicator.
The key support level emerges at the $29.10-$29.00 regions.
The Silver price (XAG/USD) extends the recovery to near $29.60 during the early Asian session on Monday, bolstered by the softer-than-expected US November Personal Consumption Expenditures (PCE) Price Index inflation data. However, the upside of the white metal might be limited amid the cautious approach to monetary easing next year from the Federal Reserve (Fed).
According to the daily chart, the bearish outlook of the Silver price remains in play as the price holds below the key 100-day Exponential Moving Average (EMA). Additionally, the downward momentum is reinforced by the 14-day Relative Strength Index (RSI), which stands below the midline around 39.20, suggesting that further downside cannot be ruled out.
The potential support level for XAG/USD emerges in the $29.10-$29.00 zone, representing the lower limit of the Bollinger Band and psychological level. A breach of this level could expose $27.70, the low of September 9. The additional downside filter to watch is $26.45, the low of August 8.
On the upside, the crucial upside barrier for the precious metal is seen at the $30.00 level. Sustained trading above the mentioned level could pave the way to $30.60, the 100-day EMA. Further north, the next hurdle is located at $32.17, the upper boundary of the Bollinger Band.
Silver price (XAG/USD) daily chart
Silver FAQs
Silver is a precious metal highly traded among investors. It has been historically used as a store of value and a medium of exchange. Although less popular than Gold, traders may turn to Silver to diversify their investment portfolio, for its intrinsic value or as a potential hedge during high-inflation periods. Investors can buy physical Silver, in coins or in bars, or trade it through vehicles such as Exchange Traded Funds, which track its price on international markets.
Silver prices can move due to a wide range of factors. Geopolitical instability or fears of a deep recession can make Silver price escalate due to its safe-haven status, although to a lesser extent than Gold’s. As a yieldless asset, Silver tends to rise with lower interest rates. Its moves also depend on how the US Dollar (USD) behaves as the asset is priced in dollars (XAG/USD). A strong Dollar tends to keep the price of Silver at bay, whereas a weaker Dollar is likely to propel prices up. Other factors such as investment demand, mining supply – Silver is much more abundant than Gold – and recycling rates can also affect prices.
Silver is widely used in industry, particularly in sectors such as electronics or solar energy, as it has one of the highest electric conductivity of all metals – more than Copper and Gold. A surge in demand can increase prices, while a decline tends to lower them. Dynamics in the US, Chinese and Indian economies can also contribute to price swings: for the US and particularly China, their big industrial sectors use Silver in various processes; in India, consumers’ demand for the precious metal for jewellery also plays a key role in setting prices.
Silver prices tend to follow Gold’s moves. When Gold prices rise, Silver typically follows suit, as their status as safe-haven assets is similar. The Gold/Silver ratio, which shows the number of ounces of Silver needed to equal the value of one ounce of Gold, may help to determine the relative valuation between both metals. Some investors may consider a high ratio as an indicator that Silver is undervalued, or Gold is overvalued. On the contrary, a low ratio might suggest that Gold is undervalued relative to Silver.
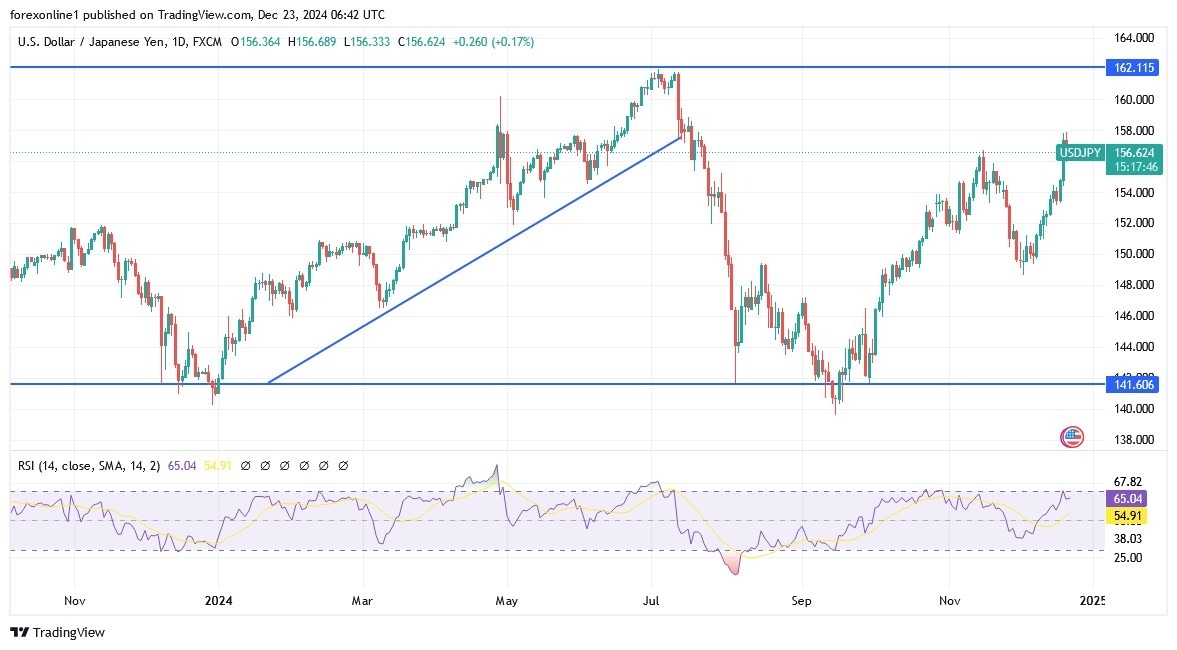
The USD/JPY pair experienced another week of upward momentum, with gains extending to the resistance level of 157.92, the highest for the currency pair in five months.
The week’s trading closed around 156.42 amidst strong bull control over the trend.
The increasing strength of the US dollar may push the trend towards the psychological resistance of 160.00 before the end of 2024.
Furthermore, diverging policies of central banks worldwide and the extent of investor risk appetite are the main factors affecting the performance of the currency pair.
US Dollar Near Two-Year High
Despite a decline in the US dollar price after the announcement of the US Federal Reserve’s preferred US inflation reading, it is still near its two-year high amid declining expectations of US interest rate cuts by the Federal Reserve in 2025. According to forex market trading, the US dollar has risen to new highs following news that Republican lawmakers have dropped a previously agreed-upon spending bill, raising the spectre of a government shutdown over the weekend.
The US dollar’s gains also came in the wake of the Federal Reserve’s decision in the middle of last week, when interest rates were cut, but policymakers said they expect only two interest rate cuts in 2025.
Trading Tips:
The dollar price against the US dollar will remain on its upward path until Japan intervenes in the exchange markets to stop the yen’s collapse
US Stocks Continue to Gain
According to stock trading platforms, US stock indices rose on the last day of 2024. According to trading, the S&P 500 index rose by 1%, the Nasdaq index rose by 0.8%. Meanwhile, the Dow Jones index gained 497 points. The gains of the US stock indices came on the heels of the preferred US inflation reading for the US Federal Reserve. Obviously, after that the Personal Consumption Expenditures index in November showed an increase of 2.4% on an annual basis, which is slightly below expectations. This helped ease market concerns raised by the Federal Reserve’s expectations of cutting US interest rates in 2025.
Investor sentiment was also affected by the threat of a US government shutdown and the pressures facing global financial markets due to threats of tariffs. According to last week’s trading, all three major US stock indices fell by 2.3%, with the Dow Jones recording its worst week since 2023.
Stock investors’ sentiment was also affected by the threat of a US government shutdown and the pressure on global financial markets due to tariff threats. According to last week’s trading, all three major US stock indices fell by 2.3%, with the Dow Jones recording its worst week since 2023.
USD/JPY Technical Analysis and Expectations Today:
According to the performance on the daily chart, the general trend of the US dollar against the Japanese yen USD/JPY is still bullish, exceeding the resistance of 158.00, moving the relative strength index towards strong overbought levels. Moreover, the MACD indicator has the opportunity to achieve stronger gains before reaching the overbought peak. Furthermore, the strength factors of the currency pair are present and will remain until a technical downward correction occurs. We do not rule out a move towards the psychological peak of 160.00. In contrast, and in the same period of time, the bearish shift of the USD/JPY pair will begin by returning to the support level of 151.50 again. Ultimately, we still prefer to buy USD/JPY from every downward level without risk and activate profit limit and stop loss orders to ensure the safety of the trading account from any sudden price reversals.
Vitamin and supplement provider Nature’s Bounty has introduced its Plant-Based Omega-3 dietary supplement, a vegetarian alternative to traditional fish oil. The dietary supplement goes straight to the source of healthy fats EPA and DHA omega-3s – plant-based algae – to support heart, joint and skin health. Featuring 1,000 milligrams of vegetarian algae oil per daily softgel, the product is available now at major retailers. A 30-count bottle retails for a suggested $29.99.
You’ll only find simple, classic flavors at Hiroki, a small, Japanese-inspired bakery in Seattle’s Tangletown neighborhood.
“Keep it simple,” is owner Kayoko Phillips’ motto for running the bakery.
She notes that the menu has barely changed over the past two decades of operation. They don’t try to keep up with the latest trends or make changes in their kitchen. After all, if it tastes good and customers like the flavors, why change a good thing?
Each bakery delicacy is made from scratch with high-quality ingredients. “Everything is handcrafted with love,” Phillips explains. There are no food additives, food coloring, or preservatives in any of their products. They “try to be as simple and as good as possible,” Phillips says.
Their signature item is matcha (green tea) tiramisu – this cake is actually the original reason the bakery opened. The founder wanted a place to sell his delicious dessert, so he started the bakery. And today, all these years later, it’s still the most popular item on the menu.
Their second most popular item is the honey cheese mango cheesecake, a chilled (unbaked) dessert. Other items on the menu include coconut dacquoise roll, crème caramel, gateau chocolat, and souffle cheesecake.
In addition to your classic coffee and tea service, Hiroki also offers match and hojicha (roasted green tea) lattes.
Aside from Japanese flavors featured in some of their goods (matcha and hojicha green tea), Phillips notes that the bakery is Japanese-style because of the way they produce and sell items. Each piece of cake is handmade and individually-wrapped to extend the shelf-life.
Hiroki is truly a local bakery, operating to serve their neighborhood and community. “This place got known by word of mouth and people being loyal regulars for a long time,” Phillips notes. They don’t do much advertising, and value their existing customers.
Phillips finds joy when people come into the bakery – she notes that folks are usually smiling and happy when they come in. (I would be, too, if I knew that I was going to enjoy some delicious cake!).
So if you’re in north Seattle and find yourself craving some homemade pastries, be sure to check out Hiroki. Like so many other customers, I recommend the matcha tiramisu!
Ellie White is a freelance writer for Seattle Refined. Follow her adventures here.
Ripple’s XRP is currently trading in red and is trading below the $2.25 mark. Majority of the top 10 coins are trading in red, including Bitcoin. XRP continues to trade sideways as it remains in a consolidation phase. This range-bound movement is expected to exist as the market works through a correction. Here’s an update on the important price levels to monitor for XRP in the coming days.
Key Support Levels
XRP is currently facing support between $2.24 and $2.21. This range is based on Fibonacci retracement levels, but it is important to note that this support is relatively weak and could potentially be broken. The critical level to watch is the $1.94 swing low. As long as XRP stays above this level, the consolidation phase remains intact. However, if the price falls below $1.94, it could signal a shift toward lower support levels.
Potential Lower Support Zone
If XRP fails to hold above the $1.94 level, the next key support zone lies between $1.85 and $1.12. This could be the area where XRP finds strong buying interest if the current consolidation breaks down.
Key Resistance Levels
On the upside, XRP is approaching resistance near the $2.72 level. This price point is crucial because if XRP breaks above it, it could signal a potential rally toward previous highs. If XRP continues to hold its ground and eventually breaks out to the upside, this resistance level could be a significant target.
Currently, XRP may be in the D-wave of the triangle formation. This follows the previous A, B, and C waves, with the D-wave potentially developing now, followed by an E-wave, which should form a higher low. If the triangle is valid, XRP could breakout upward once the E-wave concludes, signaling a potential price rise.
Never Miss a Beat in the Crypto World!
Stay ahead with breaking news, expert analysis, and real-time updates on the latest trends in Bitcoin, altcoins, DeFi, NFTs, and more.
FAQs
What price will XRP reach in 2025?
XRP’s price in 2025 could vary depending on market trends, but it may range from $5 to $10 if adoption grows and regulatory clarity improves.
Could XRP reach $20?
Reaching $20 is possible, but it would require significant market growth, regulatory advancements, and widespread adoption, making it unlikely in the short term.
How much will 1 XRP be worth in 2030?
In 2030, XRP could potentially reach $25 or more, depending on widespread blockchain adoption and favorable crypto regulations.
Dogecoin price could surge above this price if DOGE closely follows Bitcoin’s performance, especially if BTC equals gold’s market cap of $17.73 trillion.
Dogecoin has shown strong signs of recovery since the recent market correction that wiped out over $1 billion worth of investment. The dog-themed token had its fair share of the price decline, plunging from around $0.4, where it has traded for several weeks, to $0.26 yesterday.
Interestingly, DOGE quickly recovered, soaring above the $0.3 mark. At the time of writing, the token is trading at $0.3407, reflecting an increase of 9.74% over the past 24 hours.
Bitcoin’s Impact on Dogecoin
It is worth mentioning that Bitcoin’s price actions have largely influenced Dogecoin’s recent performance. For context, the price of Dogecoin usually plunges anytime Bitcoin declines and rises when the premier cryptocurrency rallies.
According to data from IntoTheBlock, Dogecoin has had a 97% correlation with Bitcoin over the past 30 days, suggesting that the firstborn memecoin closely follows the price movement of the world’s largest cryptocurrency.
Dogecoin correlation with Bitcoin
Although Bitcoin recently had a negative impact on Dogecoin’s performance, this dynamic could shift if BTC reaches some of the lofty targets set by top market observers.
Bitcoin Price if it Equals Gold Market Cap
For instance, Bitcoin has been projected to equal the valuation of gold in the future. Data from CompaniesMarketCap show that gold has an estimated valuation of $17.73 trillion, positioning it among the world’s largest assets. However, Bitcoin is valued at $1.95 trillion at the time of writing.
With Bitcoin projected to equal gold’s market cap, it must soar by 809.23% from its current valuation to achieve this feat. If this forecast comes true, Bitcoin’s price could soar to a whopping $897,200 from the current level of $98,677.
Dogecoin Price if Bitcoin Equals Gold Market Cap
Notably, Bitcoin’s potential equalization of gold’s market cap will also have a major impact on the performance of other crypto assets, including Dogecoin. Since Dogecoin has a strong correlation with Bitcoin, it could benefit more from this potential surge.
Consequently, we estimated how much DOGE would be worth if Bitcoin’s potential valuation reached $17.73 trillion, equal to gold’s market cap.
With Bitcoin expected to soar by 809.23% to equal gold’s market cap, Dogecoin will set a new all-time high (ATH) if it experiences a similar growth rate.
Should Dogecoin rally by 809.23% from its current price of $0.3407, it will trade at $3.09 per token, surpassing the previous ATH record of $0.73 by 323.28%. At the $3.09 price target, Dogecoin’s market cap will soar to $456.35 billion from its current valuation of $50.18 billion.
Dogecoin to $3 Forecast
The $3.09 target aligns with previous predictions set by top analyst Javon Marks. The expert, who referenced Dogecoin’s historical performance, projected that the asset would rally to a conservative target of $3 this bull cycle.
Additionally, renowned crypto chartist Ali Martinez forecasted that Dogecoin might soar to the $3 mark under favorable market conditions. However, the expert did not specify a timeline for this surge.
Meanwhile, analysts at Changelly forecasted that Dogecoin will soar to $3.03 by January 2033, almost nine years from now. While this analysis looks enticing, it should not be taken as investment advice.
DisClamier: This content is informational and should not be considered financial advice. The views expressed in this article may include the author’s personal opinions and do not reflect The Crypto Basic opinion. Readers are encouraged to do thorough research before making any investment decisions. The Crypto Basic is not responsible for any financial losses.
Gold price holds recovery from monthly lows due to year-end unwinding.
The US Dollar bounces after Friday’s profit-taking slide, despite sluggish US Treasury bond yields.
Gold price remains a ‘sell-on-bounce’ trade while below 21-day SMA and amid bearish daily RSI
Gold price is looking to extend its recovery from monthly lows into a third day on Monday as buyers hold their grip above the $2,600 mark. However, the further upside appears elusive amid a broad US Dollar (USD) bounce and a pause in the decline of US Treasury bond yields.
Will Gold price extend its recovery momentum?
Markets cashed in on their USD long positions on Friday, taking the excuse of a slight cooldown in the monthly US headline Personal Consumption Expenditures (PCE) Price Index data for November. The Fed’s preferred inflation gauge showed an increase of just 0.1% from October, missing the forecast for a 0.2% growth while the headline PCE Price Index rose 0.1% over the month in November versus the 0.2% increase expected.
This is because the odds for a January interest rate pause by the US Federal Reserve (Fed) remained at around 90% following Wednesday’s hawkish Fed rate cut decision, the CME Group’s FedWatch Tool show.
The US central bank lowered policy rate by 25 basis points (bps) to 4.25%-4.50% range last week, as widely expected. However, the Fed’s Statement of Economic Projections (SEP), the so-called Dot Plot, predicted two quarter-percentage-point rate reductions by the end of 2025. That is half a percentage point less in policy easing next year than officials anticipated as of September.
The US Dollar corrected in sync with the US Treasury bond yields, allowing the non-yielding Gold price extend its upswing from monthly lows of $2,583.
In Monday’s trading so far, Gold price clings to recent gains as USD buyers jump back on the bids, with traders preferring to hold the buck heading into the Christmas holiday break.
The ongoing geopolitical conflict between Israel and Gaza and anticipation of potential protectionism by US President-elect Donald Trump underpin the haven demand for the US Dollar, making the USD-denominated Gold price more expensive for foreign buyers.
Gold traders will likely take cues from the broader market sentiment before placing fresh bets on the bright metal.
Gold price technical analysis: Daily chart
The short-term technical outlook for Gold price remains more or less the same as the downside bias remains intact, with the 14-day Relative Strength Index (RSI) holding below the 50 level.
Recapturing the 21-day Simple Moving Average (SMA) of $2,645 on a daily closing basis is critical to reversing the downtrend. Acceptance above that level will call for a test of the 50-day SMA at $2,669.
Further up, the $2,700 mark will challenge the bearish commitments.
If the recovery fades, Gold sellers retest the 100-day SMA resistance-turned-support at $2,610, below which the monthly low of $2,583 will be threatened.
On a sustained downside, the November 15 and 14 lows at $2,555 and $2,537, respectively, could come into play.
Gold FAQs
Gold has played a key role in human’s history as it has been widely used as a store of value and medium of exchange. Currently, apart from its shine and usage for jewelry, the precious metal is widely seen as a safe-haven asset, meaning that it is considered a good investment during turbulent times. Gold is also widely seen as a hedge against inflation and against depreciating currencies as it doesn’t rely on any specific issuer or government.
Central banks are the biggest Gold holders. In their aim to support their currencies in turbulent times, central banks tend to diversify their reserves and buy Gold to improve the perceived strength of the economy and the currency. High Gold reserves can be a source of trust for a country’s solvency. Central banks added 1,136 tonnes of Gold worth around $70 billion to their reserves in 2022, according to data from the World Gold Council. This is the highest yearly purchase since records began. Central banks from emerging economies such as China, India and Turkey are quickly increasing their Gold reserves.
Gold has an inverse correlation with the US Dollar and US Treasuries, which are both major reserve and safe-haven assets. When the Dollar depreciates, Gold tends to rise, enabling investors and central banks to diversify their assets in turbulent times. Gold is also inversely correlated with risk assets. A rally in the stock market tends to weaken Gold price, while sell-offs in riskier markets tend to favor the precious metal.
The price can move due to a wide range of factors. Geopolitical instability or fears of a deep recession can quickly make Gold price escalate due to its safe-haven status. As a yield-less asset, Gold tends to rise with lower interest rates, while higher cost of money usually weighs down on the yellow metal. Still, most moves depend on how the US Dollar (USD) behaves as the asset is priced in dollars (XAU/USD). A strong Dollar tends to keep the price of Gold controlled, whereas a weaker Dollar is likely to push Gold prices up.
AN EX-CONVICT was arrested once again after he was caught stealing herbal dietary supplement capsules for men from a convenience store on Gabuya Street, Barangay Basak San Nicolas, Cebu City, around 8 a.m. Sunday, December 22, 2024.
The suspect was identified as Lyndon Suico Villanueva, 26, a native of Sitio Kinalumsan, Barangay Gun-ob, Lapu-Lapu City, but temporarily resided in Sitio Huyong-Huyong, Barangay Mambaling, Cebu City.
He was caught by the store’s security clerk, Jonathan Sanchez Valeroso, after allegedly stealing 28 packs of Passion Max herbal supplements totaling P8,870. (DVG)