About Editorial team of BIPNs

Main team of content of bipns.com. Any type of content should be approved by us.
10 12, 2024

XAU/USD eyes acceptance above $2,670 resistance ahead of US inflation test

By |2024-12-10T08:58:33+02:00December 10, 2024|Forex News, News|0 Comments


  • Gold price consolidates the previous rebound above $2,660 early Tuesday.       
  • The US Dollar catches fresh haven demand while US Treasury bond yields stall recovery.
  • Daily RSI recaptures 50 as Gold price eyes acceptance above 50-day SMA ahead of US CPI.

Gold’s price builds on the previous rebound near $2,670 in Tuesday’s Asian trades even as the US Dollar (USD) sticks to its recovery mode, awaiting US Consumer Price Index (CPI) data on Wednesday for fresh directional impetus.

Gold price capitalizes on geopolitics and China optimism

Gold price takes advantage of a pause in the US Treasury yields upswing and expectations of more stimulus coming from China following weak inflation data on Monday. China’s CPI missed expectations in November, rising by 0.2% year on year (YoY), down from a 0.3% increase in October.

Additionally, rising Middle East geopolitical tensions, in the face of the sudden collapse of the Syrian government over the weekend, keep the haven demand for Gold price alive and kicking. Syrian rebels seized the capital, Damascus, ousting President Bashar al-Assad, who fled to Russia with his family seeking asylum.

According to Bloomberg, the leader of the Syrian rebel group, Mohammed Al Bashir, is set to form a transitional administration to “avoid slipping into chaos”.

On Monday, Gold price staged a decent comeback from eight-day lows of $2,613 as Middle East geopolitical tensions offset the renewed upside in the US Dollar and the US Treasury bond yields across the curve. US Treasury bond yields rebound was led by the anticipation of stubbornly high US inflation data, which could ramp up expectations for a hawkish interest rate cut by the US Federal Reserve (Fed) next week.

Markets see an 86% probability of the Fed lowering rates by 25 basis points (bps) next week. Meanwhile, for the January Fed meeting, the odds for another 25 bps rate cut stand at about 22%, the CME Group’s FedWatch Tool shows.

Looking ahead, all eyes remain on Wednesday’s key US inflation test as Gold price could see additional profit-taking following last week’s decline. Traders will likely resort to repositioning in the lead-up to the US CPI showdown.

Meanwhile, geopolitical developments will also be closely eyed in the absence of any top-tier US economic data due later this Tuesday.

Gold price technical analysis: Daily chart

The daily chart shows that the tide has turned in favor of the Gold price as the 14-day Relative Strength Index (RSI) pierced through the midline for the upside.

Gold price is now attempting to break the recent range to the north, battling with the key 50-day Simple Moving Average (SMA) at $2,668.

Acceptance above the latter on a daily closing basis is critical for providing extra legs to the ongoing Gold price recovery.

The next relevant resistance levels are seen at the $2,700 round level and the November 25  high of $2,721.

Conversely, the 21-day SMA at $2,633 will offer strong support to buyers in case the upside loses momentum.

The previous week’s low of $2,613 will be next on sellers’ radars, below which the 100-day SMA at $2,588 will be threatened.

Gold FAQs

Gold has played a key role in human’s history as it has been widely used as a store of value and medium of exchange. Currently, apart from its shine and usage for jewelry, the precious metal is widely seen as a safe-haven asset, meaning that it is considered a good investment during turbulent times. Gold is also widely seen as a hedge against inflation and against depreciating currencies as it doesn’t rely on any specific issuer or government.

Central banks are the biggest Gold holders. In their aim to support their currencies in turbulent times, central banks tend to diversify their reserves and buy Gold to improve the perceived strength of the economy and the currency. High Gold reserves can be a source of trust for a country’s solvency. Central banks added 1,136 tonnes of Gold worth around $70 billion to their reserves in 2022, according to data from the World Gold Council. This is the highest yearly purchase since records began. Central banks from emerging economies such as China, India and Turkey are quickly increasing their Gold reserves.

Gold has an inverse correlation with the US Dollar and US Treasuries, which are both major reserve and safe-haven assets. When the Dollar depreciates, Gold tends to rise, enabling investors and central banks to diversify their assets in turbulent times. Gold is also inversely correlated with risk assets. A rally in the stock market tends to weaken Gold price, while sell-offs in riskier markets tend to favor the precious metal.

The price can move due to a wide range of factors. Geopolitical instability or fears of a deep recession can quickly make Gold price escalate due to its safe-haven status. As a yield-less asset, Gold tends to rise with lower interest rates, while higher cost of money usually weighs down on the yellow metal. Still, most moves depend on how the US Dollar (USD) behaves as the asset is priced in dollars (XAU/USD). A strong Dollar tends to keep the price of Gold controlled, whereas a weaker Dollar is likely to push Gold prices up.


Source link

10 12, 2024

Ethereum, Solana & Altcoins — Asian Wrap 10 December

By |2024-12-10T07:33:16+02:00December 10, 2024|Crypto News, News|0 Comments

Ethereum (ETH) declined 10% on Monday after investors increased their profit-taking with over $2.5 billion in realized profits. This sparked a two-year high in futures liquidations for the top altcoin. However, ETH exchange-traded funds (ETFs) provide a bullish picture amid the recent selling pressure hitting the market.

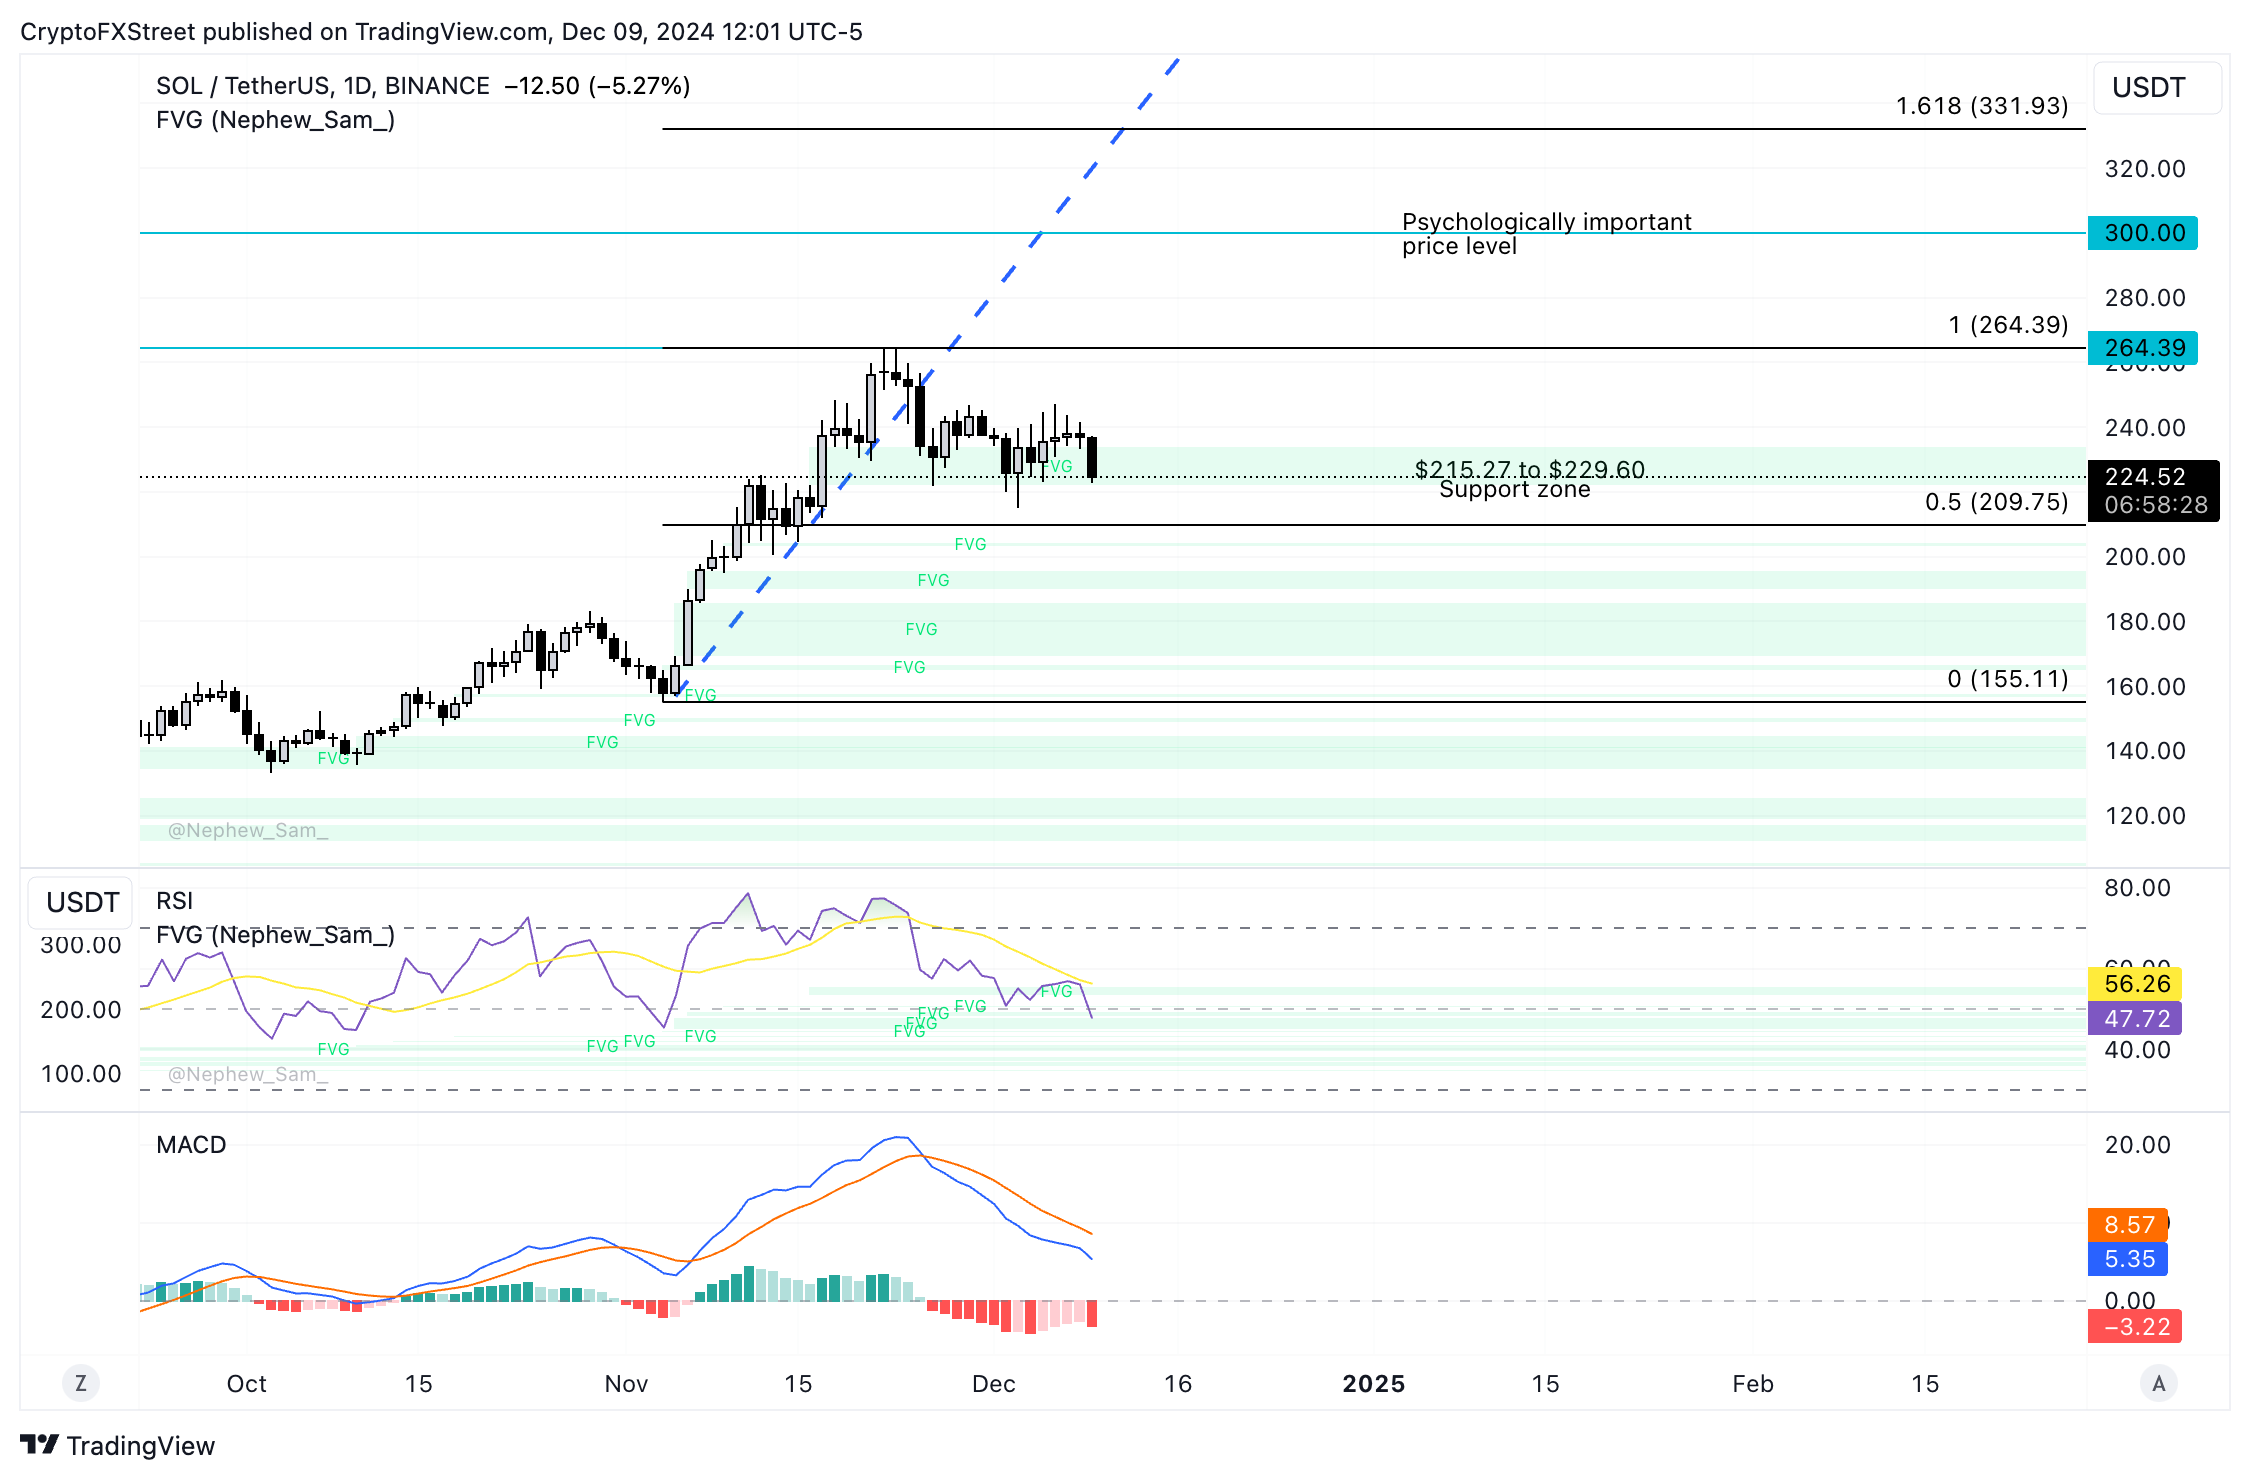
Solana (SOL) is currently consolidating after hitting its all-time high at $264.39 on November 22. While SOL is consolidating, trade volume declined, however, total open interest remains above average levels. 

Ethereum (ETH), Solana (SOL), XRP and the general altcoin market experienced a pullback on Monday, recording over $1.5 billion in futures liquidations. The correction shows that Bitcoin dominance is still outweighing altcoins despite speculations of an alt season.


Source link

10 12, 2024

XAG/USD rises to near $32.00 within an ascending channel

By |2024-12-10T06:56:14+02:00December 10, 2024|Forex News, News|0 Comments


  • Silver price continues to gain ground due to the prevailing bullish bias.
  • The primary barrier appears around the upper boundary of the ascending channel at the $32.60 level.
  • The nine- and the 14-day EMA at $31.27 and $31.17, respectively, would act as primary supports.

Silver price (XAG/USD) extends its gains for the second day, trading around $32.00 per troy ounce during the Asian hours on Tuesday. The daily chart analysis indicates a bullish bias, with the pair moving upwards within an ascending channel pattern. Additionally, the 14-day Relative Strength Index (RSI) remains above the 50 mark, further supporting the bullish sentiment.

The XAG/USD pair continues to trade above the nine- and 14-day Exponential Moving Averages (EMA), reinforcing a bullish outlook and signaling to strengthen short-term price momentum. This points to increasing buying interest and raises the likelihood of further price appreciation.

In terms of the upside, the Silver price finds a primary barrier around the upper boundary of the ascending channel at the $32.60 level. A break above this level could reinforce the bullish bias and support the XAG/USD pair to approach its November high at $33.13.

On the downside, the primary support appears at the nine-day EMA at $31.28, followed by the 14-day EMA at $31.17. The lower boundary of the ascending channel at $31.00 level could act as a major support.

A break below the descending channel could weaken the bullish bias and put downward pressure on the price of precious metal to test a “throwback support” at the psychological level of $30.00.

XAG/USD: Daily Chart

Silver FAQs

Silver is a precious metal highly traded among investors. It has been historically used as a store of value and a medium of exchange. Although less popular than Gold, traders may turn to Silver to diversify their investment portfolio, for its intrinsic value or as a potential hedge during high-inflation periods. Investors can buy physical Silver, in coins or in bars, or trade it through vehicles such as Exchange Traded Funds, which track its price on international markets.

Silver prices can move due to a wide range of factors. Geopolitical instability or fears of a deep recession can make Silver price escalate due to its safe-haven status, although to a lesser extent than Gold’s. As a yieldless asset, Silver tends to rise with lower interest rates. Its moves also depend on how the US Dollar (USD) behaves as the asset is priced in dollars (XAG/USD). A strong Dollar tends to keep the price of Silver at bay, whereas a weaker Dollar is likely to propel prices up. Other factors such as investment demand, mining supply – Silver is much more abundant than Gold – and recycling rates can also affect prices.

Silver is widely used in industry, particularly in sectors such as electronics or solar energy, as it has one of the highest electric conductivity of all metals – more than Copper and Gold. A surge in demand can increase prices, while a decline tends to lower them. Dynamics in the US, Chinese and Indian economies can also contribute to price swings: for the US and particularly China, their big industrial sectors use Silver in various processes; in India, consumers’ demand for the precious metal for jewellery also plays a key role in setting prices.

Silver prices tend to follow Gold’s moves. When Gold prices rise, Silver typically follows suit, as their status as safe-haven assets is similar. The Gold/Silver ratio, which shows the number of ounces of Silver needed to equal the value of one ounce of Gold, may help to determine the relative valuation between both metals. Some investors may consider a high ratio as an indicator that Silver is undervalued, or Gold is overvalued. On the contrary, a low ratio might suggest that Gold is undervalued relative to Silver.


Source link

10 12, 2024

Dogecoin Price Prediction: Can DOGE Reach $15 With The Donald Trump Win While WallitIQ (WLTQ) Becomes Elon Musk’s New Favorite?

By |2024-12-10T05:32:12+02:00December 10, 2024|Crypto News, News|0 Comments

The Dogecoin price generates buzz, as many speculate it could reach $15 following Donald Trump’s victory and return to the U.S. presidency. Meanwhile, WallitIQ (WLTQ) is rapidly gaining traction in the crypto market, with its presale nearly sold out after raising over $2.3 million. Tokens sell quickly, and investors should act fast before the WallitIQ (WLTQ) price skyrockets. With its rapid growth and the potential to become Elon Musk’s new favorite, WallitIQ (WLTQ) is emerging as one of crypto’s most exciting presale tokens.

WallitIQ (WLTQ) Presale Gaining Momentum As The Next Favorite For Elon Musk And Investors

With WallitIQ (WLTQ) rapidly gaining momentum, it’s on the brink of becoming Elon Musk’s new favorite in crypto. The presale has already raised over $2.3 million, and with thousands of eager investors snapping up tokens, WallitIQ (WLTQ) could surpass $3 million in just a few days. The price will jump as the presale nears its sell-out stage, making now the best time to invest at its current discounted rate of $0.0243.

With Donald Trump’s win stirring bullish sentiment across markets, the crypto community is paying close attention, especially as Elon Musk’s new best crypto could turn out to be WallitIQ (WLTQ). Meanwhile, the Dogecoin price remains a focal point in the market, with bulls eyeing a possible $15 following Trump’s win. While the Dogecoin price is gaining attention due to these political shifts, it struggles to break free from the bear grip, leaving investors wondering whether it can reach those lofty highs. 

Unlike Dogecoin, WallitIQ (WLTQ) is a SolidProof audited digital wallet that uses Artificial Intelligence and Machine Learning to secure and efficiently manage and trade over 1,000 cryptocurrencies. Smart investors are already snapping tokens, and Elon Musk’s influence will help drive its massive surge higher. With Donald Trump’s win adding to the bullish momentum, there has never been a better time to act. Don’t miss out; secure the WallitIQ (WLTQ) tokens, now listed on CoinMarketCap, at $0.0243 before it’s too late.

Donald Trump’s 2024 Win Could Push The Dogecoin Price To $12

Donald Trump’s win in the 2024 U.S. presidential elections has sparked excitement in the crypto market, with the Dogecoin price aiming for a possible surge to $12. According to CoinMarketCap data, the Dogecoin price experienced a 1% gain over the past week and a striking 160% monthly surge. However, despite these positive trends, Dogecoin’s 24-hour trading volume has fallen by 37%, now at $6.3 billion, and its price has dropped to around $0.4079.

While some analysts believe the recent dip in the Dogecoin price could be short-lived, many remain hopeful that it will rebound and climb to new heights. As some investors wait to see if the Donald Trump presidential win could trigger a rally, pushing the Dogecoin price to $12, others are growing cautious due to ongoing declines. This uncertainty has led savvy investors to turn away from Dogecoin and buy the WallitIQ (WLTQ) presale tokens, which are rapidly gaining traction as Elon Musk’s next favorite.

Conclusion 

In a market stirred by Donald Trump’s election win, the Dogecoin price aims for $15, while the WallitIQ (WLTQ) presale stands out as a beacon of opportunity and is poised to become Elon Musk’s new favorite. With Elon Musk’s focus on advancing blockchain technology, WallitIQ’s (WLTQ) innovative approach to asset management could soon capture his attention. 

As the WallitIQ (WLTQ) presale continues to surge, selling out more than anticipated, its current price of $0.0243 is set to rise quickly to $0.0420 in the next stage. Investors seeking long-term growth and substantial returns should act swiftly, as this chance won’t last much longer. With Donald Trump’s win sparking optimism in the market, WallitIQ (WLTQ) is positioned to lead the way as a popular crypto presale and a go-to wallet for millions of users. 

WallitIQ (WLTQ), with its unmatched DeFi simplified wallet features and growing popularity, is poised for a significant breakout by 2025, and Elon Musk could take it there faster. Many savvy investors who support Elon Musk’s ventures are already joining the WallitIQ (WLTQ) presale and waiting for significant returns. 

Join the WallitIQ (WLTQ) presale and community: 
Join WallitIQ (WLTQ) Presale
Join the WallitIQ (WLTQ) Community

Source link

10 12, 2024

XAU/USD holds on to gains above $2,660

By |2024-12-10T04:55:28+02:00December 10, 2024|Forex News, News|0 Comments


XAU/USD Current price: $2,667.29

  • The People’s Bank of China resumed Gold buying after a six-month pause.
  • United States inflation and central banks’ monetary policy announcements fuel caution.
  • XAU/USD recovered its bullish poise, near-term gains limited.

Spot Gold advanced on Monday, trading as high as $2,667.31 a troy ounce during American hours. The bright metal found fresh demand for China after the People’s Bank of China (PBoC) resumed purchasing following a six-month pause. The US Dollar (USD), on the other hand, trades with a soft tone across the FX board as investors gear up for central banks’ announcements and first-tier United States (US) critical data.

The US will publish an update on inflation on Wednesday in the form of the Consumer Price Index (CPI). The Federal Reserve (Fed) prefers to base its decision on the more smoothed Personal Consumption Expenditures (PCE) Price Index, yet with the central bank’s announcement around the corner, market participants will be closely paying attention to the figures.  

Ahead of the Fed, the Bank of Canada (BoC), the Reserve Bank of Australia (RBA) and the European Central Bank (ECB) will also have monetary policy meetings, while in the Fed’s aftermath, it will be the turn of the Bank of Japan (BoJ) and the Bank of England (BoE).

Meanwhile, Wall Street opened with a sour tone, with the three major indexes trading in the red. Government bond yields, on the other hand, ticked marginally higher.

XAU/USD short-term technical outlook

The XAU/USD pair trades near its intraday high, and technical readings in the daily chart support an upward extension. The pair spent the day above a flat 20 Simple Moving Average (SMA), bouncing sharply from the media, usually a sign of mounting buying interest. At the same time, the 100 and 200 SMAs advance well below the shorter one, recovering their bullish poise. Finally, technical indicators bounced from around their midlines, offering modest upward slopes in line with recent resurgent buying.

In the near term, and according to the 4-hour chart, XAU/USD is also poised to extend gains. Buyers are challenging sellers aligned around a directionless 200 SMA while converging 20 and 100 SMAs provided intraday support. Technical indicators, in the meantime, head north above their midlines, albeit with uneven strength.

Support levels: 2,662.50 2,650.40 2,634.70

Resistance levels: 2,676.30 2,690.65 2,704.35


Source link

10 12, 2024

Why are altcoins down today?

By |2024-12-10T03:31:16+02:00December 10, 2024|Crypto News, News|0 Comments

  • Altcoins began the week with $1.5 billion in futures liquidations as major tokens like ETH, SOL, XRP and DOGE experienced a correction.
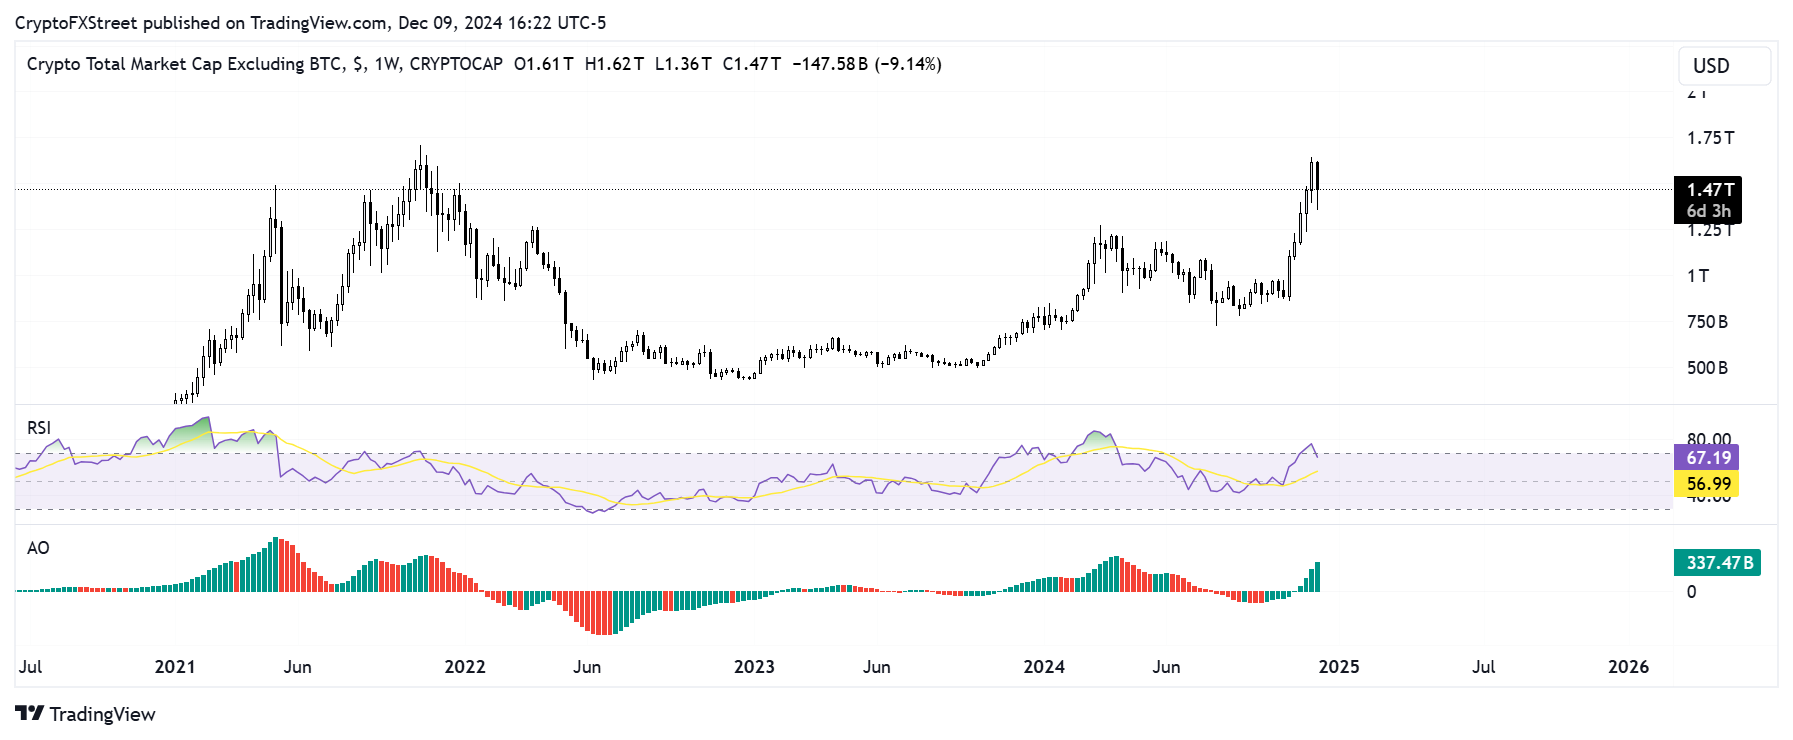
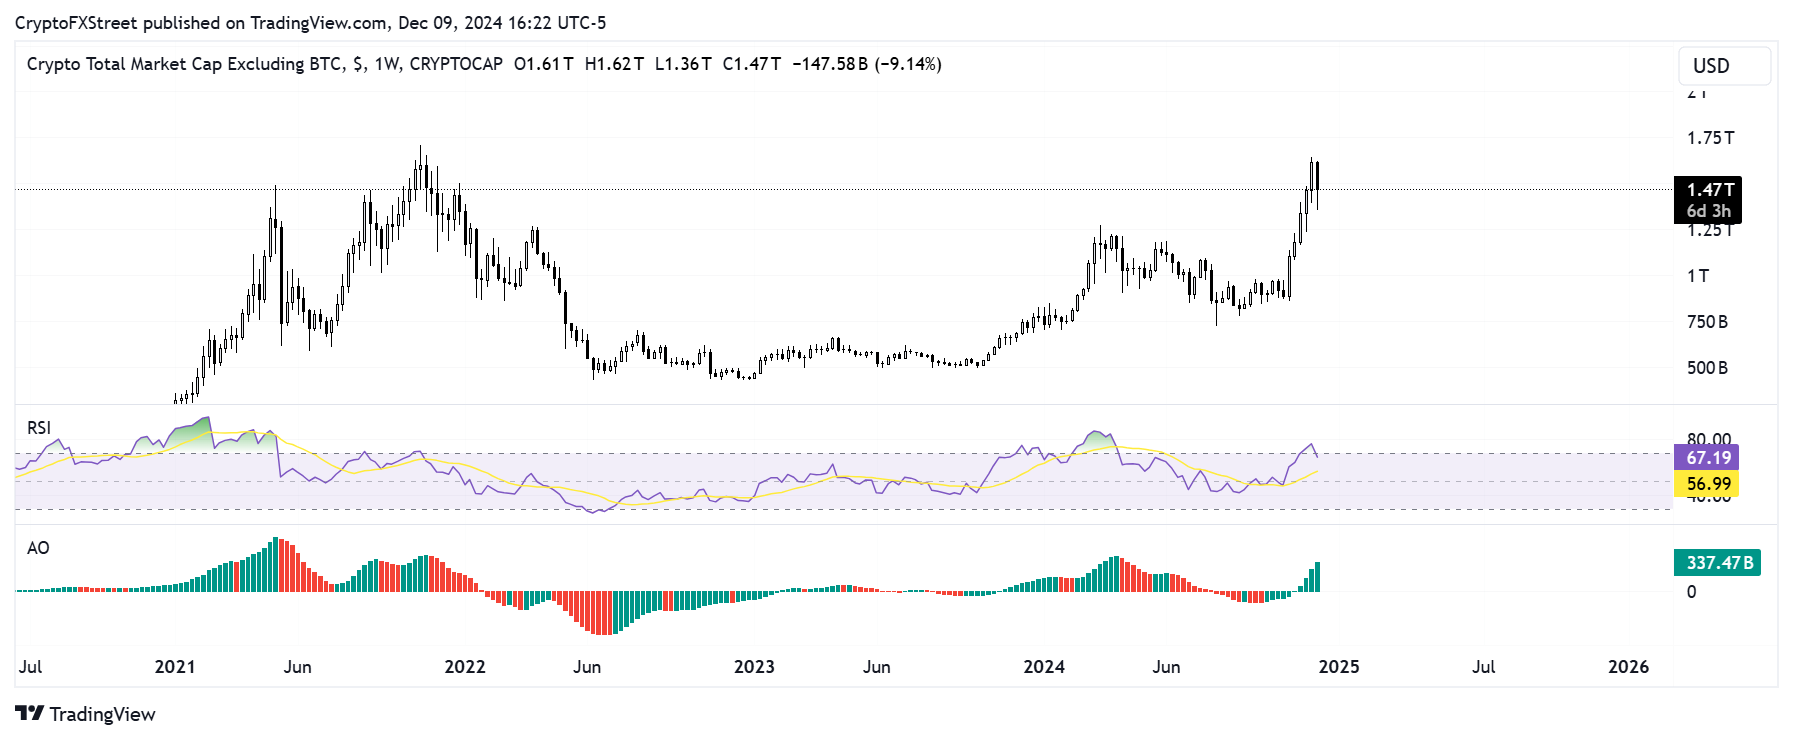
  • The altcoin market cap performed a weekly close above $1.6 trillion last week following increased enthusiasm toward an alt season.
  • Investor expectations for an alt season may have calmed after Bitcoin broke the $100K level.

Ethereum (ETH), Solana (SOL), XRP and the general altcoin market experienced a pullback on Monday, recording over $1.5 billion in futures liquidations. The correction shows that Bitcoin dominance is still outweighing altcoins despite speculations of an alt season.

Altcoins decline amid growing expectations for alt season

Major altcoins, including ETH, SOL, XRP, BNB and DOGE, posted losses above 4% on Monday following signs of exhaustion among bulls. The pullback comes after the altcoin market performed a weekly close above $1.6 trillion for the first time since 2021. 

Several crypto community members suggested that the decline may be due to reduced expectations for an alt season after Bitcoin broke past the $100K level.

While BTC only saw a 3.2% decline and about $185 million in liquidations on Monday, altcoins took a hit, experiencing over $1.5 billlion in futures liquidations, per Coinglass data. Notably, most bulls that expected alts to continue their surge were wiped out of the market, with liquidated altcoin long positions reaching a two-year high of $1.4 billion.

Crypto Market Liquidations | Coinglass

Such amount of high liquidations could spark a major FUD among investors and cause them to park their assets in stablecoins or BTC.

However, data from CryptoQuant CEO Ki Young Ju suggested that the earlier altcoins rally was not at the expense of BTC, considering the growth of stablecoin liquidity in the market. This suggests that new money flowed into the market to fuel the rally instead of capital rotation from BTC.

This has fueled high expectations among crypto enthusiasts, who suggested that the correction is a temporary pullback to spring the altcoin market cap to new highs.

A look at previous alt seasons also indicates that this pullback may be healthy for altcoins. In the 2021 market cycle, altcoins saw a major decline a few weeks after hitting new highs in May 2021 before recovering and setting new highs in November.

Total Crypto Market Capitalization excluding Bitcoin

Total Crypto Market Capitalization excluding Bitcoin

As a result, traders may be positioning themselves to treat the decline as a buying opportunity. This is evident in tokens such as SOL and TON, trading slightly below their previous all-time highs.

CryptoQuant data suggests that these two assets are favorites to break past previous ATH prices following BNB and Bitcoin performances over the past week.

“Both projects are supported by strong fundamentals, including active development teams and active networks. Given these figures, it seems likely that these coins could follow Bitcoin’s lead in the near future,” said CryptoQuant analyst Maartun.

Additionally, the recent market decline comes from altcoins’ steady correlation with Bitcoin after it declined below $100K over the weekend. If this correlation remains at elevated levels, the likelihood of a full-blown alt season remains low.


Source link

10 12, 2024

XAU/USD rises to key level ahead of big macro events

By |2024-12-10T02:54:43+02:00December 10, 2024|Forex News, News|0 Comments


Precious metals gained ground throughout the European session on Monday and were still holding into the positive heading deeper into the US session. Gold and silver were buoyed by renewed optimism from China. A shift in Beijing’s monetary strategy provided a boost to Chinese stocks and rippled through global markets, lifting commodity prices, including gold. Add geopolitical tensions from the Middle East to Europe, and it’s clear why safe-haven assets like gold saw a recovery. The week ahead, however, brings high-stakes events like interest rate decisions from major central banks and key US inflation data, all set to influence the gold forecast.


China’s stimulus and central bank meetings


China is signalling a more relaxed monetary policy for the coming year, sparking hopes of further stimulus. Such measures could be a game changer for China’s stock market. It remains to be seen if it will help lift consumer confidence to the point that it leads to a rise in gold demand in China. For now, traders are buying gold in anticipation but don’t expect this to provide a lasting support. Support for gold will have to come from other factors, particularly if we hear significantly more dovish tones from other central banks meeting in the next couple of weeks – the ECB and Fed, in particular. As well as the ECB this week, the Bank of Canada and Swiss National Bank are all on deck with policy announcements. Should these institutions lean toward easing more than investors expect for 2025, it might further support gold’s appeal, especially amidst lingering geopolitical uncertainties. However, if we hear less-than-dovish remarks then this may not provide much support, if at all, to gold prices.


Gold traders looking ahead to CPI


Gold prices are stuck in a two-week range despite today’s 1.3% rise so far in the trading session. November marked a turning point with gold retreating from its October highs, ending a nine-month winning streak. This has left many investors adopting a “wait-and-see” approach. With the US Consumer Price Index (CPI) report and the Federal Reserve’s final meeting of the year looming, the gold forecast hinges on these pivotal events. Will gold break out of its consolidation phase, or is a deeper correction on the horizon?


A stronger dollar could weigh on gold


While optimism around China’s stimulus boosted procyclical currencies, the Dollar Index remains near recent highs. A stronger dollar has been a significant headwind for gold, making it pricier for key consumers in China and India. Together, these nations account for over half the global jewellery market. Coupled with a shift toward riskier assets like tech stocks, gold’s allure has taken a hit. Even so, Monday’s recovery hints that gold’s consolidation might be nearing its end—though a confirmed breakout is still needed to reignite momentum.


Technical gold forecast: Key levels to watch


gold forecast

Source: TradingView.com


Gold’s technical outlook looks unclear at this stage and more price action is needed to tip the balance either in the bulls’ or bears’ favour. So, let’s observe price action around some key levels on the gold chart to get a better idea of directional bias:


  • Initial resistance at $2668-$2670: marking the bearish trend of the wedge pattern, a close above this area could signal a bullish reversal
  • Key Range at $2708-$2725: This area was previously support and resistance, making it a logical target for those looking for a breakout from the falling wedge pattern.
  • Initial support at $2645: this was Friday’s high and where the 21-day exponential average comes into play
  • Next support at $2580: This was the area where the last recovery started from in mid-November. If we drop below this level, then this could pave the way to $2500-$2530, with long-term support near $2440-$2400 aligning with the 200-day moving average.


In Summary


The short-term gold forecast remains murky, with competing factors like a strong dollar, geopolitical uncertainties, and major economic data releases shaping market sentiment. While long-term trends favour gold, immediate resistance levels and waning momentum call for caution. Traders are likely eyeing the upcoming CPI report and ECB meeting for a clearer direction. However, the Federal Reserve’s rate decision next week could ultimately be the decisive factor in gold’s next big move.


— Written by Fawad Razaqzada, Market Analyst

Follow Fawad on Twitter @Trader_F_R


Source link

10 12, 2024

Experts Reveal If It Works for Anti-Aging & More

By |2024-12-10T01:34:21+02:00December 10, 2024|Dietary Supplements News, News|0 Comments


NAD supplements are the latest health trend to explode on TikTok, where people claim the supplements can help boost metabolism, improve cognition, and slow or even reverse aging.

Hailed by some as a “fountain of youth,” NAD supplements are popular among wellness influencers, “biohackers,” and celebrities for a host of supposed benefits.

Despite the promising anti-aging claims on social media and the labels on bottles, the science behind NAD supplementation is a lot more complicated.

To start, there are several types of NAD-boosting supplements, all with similar acronyms: NAD+, NADH, NR, NMN.

So, what’s the difference between these, and do they really work? Can NAD supplements “turn back time,” or is it just hype? TODAY.com spoke with experts explain what NAD is, how NAD supplements work, and what the science says about potential benefits and risks.

What is NAD?

Nicotinamide-adenine dinucleotide (NAD) is a coenzyme found naturally in the cells of the body, and it plays a role in energy production, Dr. Amanda Kahn, an internist and longevity medicine specialist based in New York City, tells TODAY.com.

A coenzyme is a “helper” molecule that binds to an enzymes to help carry out a chemical reaction. In this case, NAD helps the mitochondria in the cell “keep the gears running” in the reaction that makes cellular energy, says Kahn.

“NAD is a really critical molecule involved in metabolism … (and) making energy, which is needed for every function of the body,” Christopher Martens, Ph.D., associate professor of kinesiology and applied physiology at the University of Delaware, tells TODAY.com.

What does NAD do in the body?

NAD helps hundreds of enzymes in the cell do their jobs. “Some of those enzymes are involved in cellular repair, so helping cells that have damage due to UV radiation, for example,” says Martens. NAD also plays a role in DNA repair, inflammation, cellular signaling, circadian rhythm and more.

“It’s in all our cells, helping make energy but also helping repair ourselves,” says Martens. NAD is important for healthy aging of tissues throughout the body.

Our NAD stores start to decline around young adulthood, Kahn notes. Studies suggest that the total amount of NAD in the cells declines steadily with age, metabolic disorders and heart disease.

“Part of that is thought to be due to the fact that we accumulate more damage over our lifespan. So all these enzymes are more active, trying to repair the damage and consuming more of the available NAD,” says Martens.

NAD+ vs. NADH

NAD is commonly called by other names, including NAD+ or NADH. These are both forms of NAD — NAD+ is the positively charged form, which has lost an electron, and NADH is the neutral form which has gained an electron, the experts note.

NAD+ and NADH work together to transfer electrons back and forth to facilitate energy production and other reactions, says Martens.

NAD supplementation may involve taking NAD+ and NADH, or other compounds that the body converts to NAD on its own. These are intended to raise NAD stores in the body, Kahn notes. Supplements are not intended to prevent, treat or cure disease.

NR vs. NMN

NAD is also broken down in the body into molecules that can be converted back into NAD through a recycling pathway in the body, Martens says.

These include nicotinamide riboside (NR) and nicotinamide mononucleotide (NMN), which are both forms of vitamin B3 (niacin) and act as precursors to NAD+, the experts explain. The main difference is NMN is one step closer than NR to becoming NAD.

“You can take these, the building blocks to make your own NAD, (instead of) taking NAD itself,” says Kahn.

The body also converts niacin and the amino acid tryptophan into NAD, says Martens — these are both found in some foods and available as supplements, but may not be as effective.

NAD supplements may contain one or more forms of NAD and its precursors, along with other ingredients. Always read labels closely.

Which type of NAD supplements are best to take?

“When you take NAD itself, we’ve found those supplements are not very bioavailable, meaning you don’t absorb as much as we would need to boost your levels,” says Kahn.

The two most popular NAD precursors, NR or NMN, are more stable and available, especially as oral supplements, says Martens. “NAD itself is not as stable, so it’s not quite as efficient to take a pill that contains NAD itself,” says Martens.

“It’s easier to get into the bloodstream if we take in one of those precursor forms, and the hope is that our cells will know what to do with it and convert it back to NAD,” says Martens.

In 2022, the U.S. Food and Drug Administration banned the sale of NMN, as the ingredients did not meet the requirements to be considered a dietary supplement, and NMN was authorized for investigation as a new drug.

NAD supplement forms

NAD supplements are sold in capsule, powder and liquid form. These may be taken or administered in the following ways:

  • Orally
  • Nasal spray
  • Injection
  • Intravenously (IV)

Oral NAD supplements (NAD+, NADH, NR or NMN) are the most popular, according to the experts, as they are more accessible.

NAD+ shots are injected subcutaneously, or under the skin, and get absorbed into the bloodstream more quickly because it bypasses the digestive system, says Kahn. These can be self-injected at home.

NAD-boosting supplements may also be diluted in a saline solution and administered through an intravenous (IV) drip, directly into the bloodstream. “I am not a proponent of IV therapy, because I think you can get too much at once,” says Kahn, adding that she prefers dividing supplements into smaller doses given over a longer period.

NAD supplement dosage

There is no established recommended dosage for NAD supplements, the experts note. Dosing varies depending on the type of supplement and form. Oral NAD supplements usually start around 100–250 milligrams, which may be taken multiple times per day.

Consult with your doctor to determine which dosage and frequency is best for you, says Kahn.

Supplements are regulated by the FDA as foods, not drugs, and the labels (including ingredients and amounts) are not approved before the products go to consumers.

NAD supplement benefits

Aging and many diseases are associated with reduced NAD+ levels. There is ongoing research into the effects of NAD supplementation and potential uses.

Preclinical studies in rodents have suggested that NAD-boosting supplements may help:

  • Delay signs of aging
  • Boost metabolism
  • Improve insulin resistance
  • Promote cognition
  • Protect heart health
  • Improve fertility
  • Fight gut inflammation

While the results of some animal studies are encouraging, there is limited clinical data demonstrating that NAD supplementation is effective in humans.

In a 2018 study published in Nature, healthy adults were given NR supplements for six weeks as part of a randomized controlled trial. “It was really the first time NR had been given chronically over several weeks to humans,” says Martens, who co-led the study.

The results showed that NR supplements effectively increased concentrations of NAD+ in the blood. “We know in both animals and humans, if we ingest these precursors, the amount of NAD in blood goes up dramatically,” says Martens. Recent research shows these precursors can also increase NAD+ levels in multiple tissues.

“What we don’t know is whether that increase in NAD is having a real, meaningful effect on the function of our cells, and from there, the function of our organ systems and health outcomes,” he adds.

Preliminary research suggests NAD-boosting compounds may hold promise for humans, but more large-scale research is needed. Many studies on NAD supplements in humans have been very small or performed in healthy individuals, as opposed to populations with risk factors associated with lower NAD.

“Some trials are starting to look at groups of people that may be more vulnerable to chronic disease, and who knows, maybe that’s where we’ll see a bigger impact,” says Martens.

Can NAD supplements reverse aging?

“The NAD stores drop with age, so that’s a very obvious target in terms of slowing down or even reversing the aging process by giving it back to you,” says Kahn of NAD supplementation.

While preclinical studies suggest NAD may help delay signs of aging, research on the effects and health benefits of NAD supplementation is ongoing, and more robust clinical trials are needed to draw conclusions about anti-aging benefits.

“We’re really still in the early phases of trying to figure out if this stuff is going to have a benefit or not,” says Martens.

NAD side effects

NAD supplements are generally considered safe for most people when taken at the dosage recommended by a doctor, experts note.

In a 2023 review of research on supplementation with NAD-boosting compounds, researchers found that the supplements were safe and tolerable in healthy, middle-aged and older adults.

However, safety data is limited, and there isn’t enough evidence that NAD supplements are safe for pregnant people. If you have any underlying conditions or health concerns, talk to your doctor before trying NAD, says Kahn.

As with many supplements, there is a possible risk of mild side effects, especially in high doses. These include stomach upset, headache, or skin flushing. NAD injections may cause temporary redness or pain at the injection site, says Kahn.

“For most people, the risks are very low because we’re already making these molecules in our body,” she says.

However, Kahn warns that NAD IV therapy presents more risks. IVs are considered safe when administered by a qualified health care professional, but there is always a risk of infection, she says. “It really depends on who’s doing the IV. … A lot of people have a person come over to do it or go to med spas, which are less regulated,” Kahn adds.

If you experience negative side effects after taking NAD supplements, stop use and contact your doctor.

How long does it take for NAD to start working?

“You can boost NAD relatively quickly with one dose or two, but again, that’s blood NAD. Whether that’s actually getting into the body (and tissues) is a big question,” says Martens.

NAD IV therapy and injections tend to work faster compared to pills. However, it’s unclear whether one is more effective than another.

The dosing regimen of NAD supplements in studies varies greatly, and more research is needed to determine the optimal duration.

Can you boost NAD naturally?

It may be possible to boost or maintain NAD levels naturally. “If you’re living a healthy lifestyle, then you’re at least preserving the NAD that you have and allowing those cellular pathways to do their job of recreating the NAD,” says Martens.

It’s also important to avoid harmful habits that can put the cells in metabolic stress and use up more NAD for repair, says Martens.

You may be able to increase or preserve NAD levels by:

  • Eating a nutritious diet
  • Exercising regularly
  • Getting enough sleep
  • Avoiding UV radiation exposure
  • Avoiding excessive alcohol use
  • Avoiding smoking

In addition to a living a healthy lifestyle, it’s important to take care of your mental wellbeing and get regular checkups and screenings, the experts say.


Source link

10 12, 2024

Can SOL Hit $500 as JetBolt Spikes This Altseason

By |2024-12-10T01:30:52+02:00December 10, 2024|Crypto News, News|0 Comments

Solana (SOL) is back in the spotlight, consolidating above $230 after a jaw-dropping 199% surge this year. With decentralized exchange volumes topping $100 billion and whales scooping up 185,000 SOL last week alone, crypto analysts are eyeing a $500 breakout for Solana.

Meanwhile, a next-gen altcoin is emerging as what could be the next crypto superstar: JetBolt (JBOLT), with its zero-gas technology and impressive blockchain capabilities magnetizing whales at a neck-breaking pace.

With whales circling and Solana’s ecosystem surging, the question remains: can Solana really break past its resistance levels and claim the $500 throne? Or will a new altseason star like JetBolt steal the spotlight? Let’s explore whether Solana can hit $500 while uncovering how JetBolt’s presale success is reshaping the crypto market narrative.

Solana’s $500 Target: Is SOL Breaking Barriers or Stalling Momentum?

Solana (SOL) has been a top performer this year, surging over 199% to a peak of $263 before consolidating near the $230 resistance level with a market cap of $110 billion. Thanks to this, crypto analysts are questioning whether Solana can break out and hit $500 this altseason.

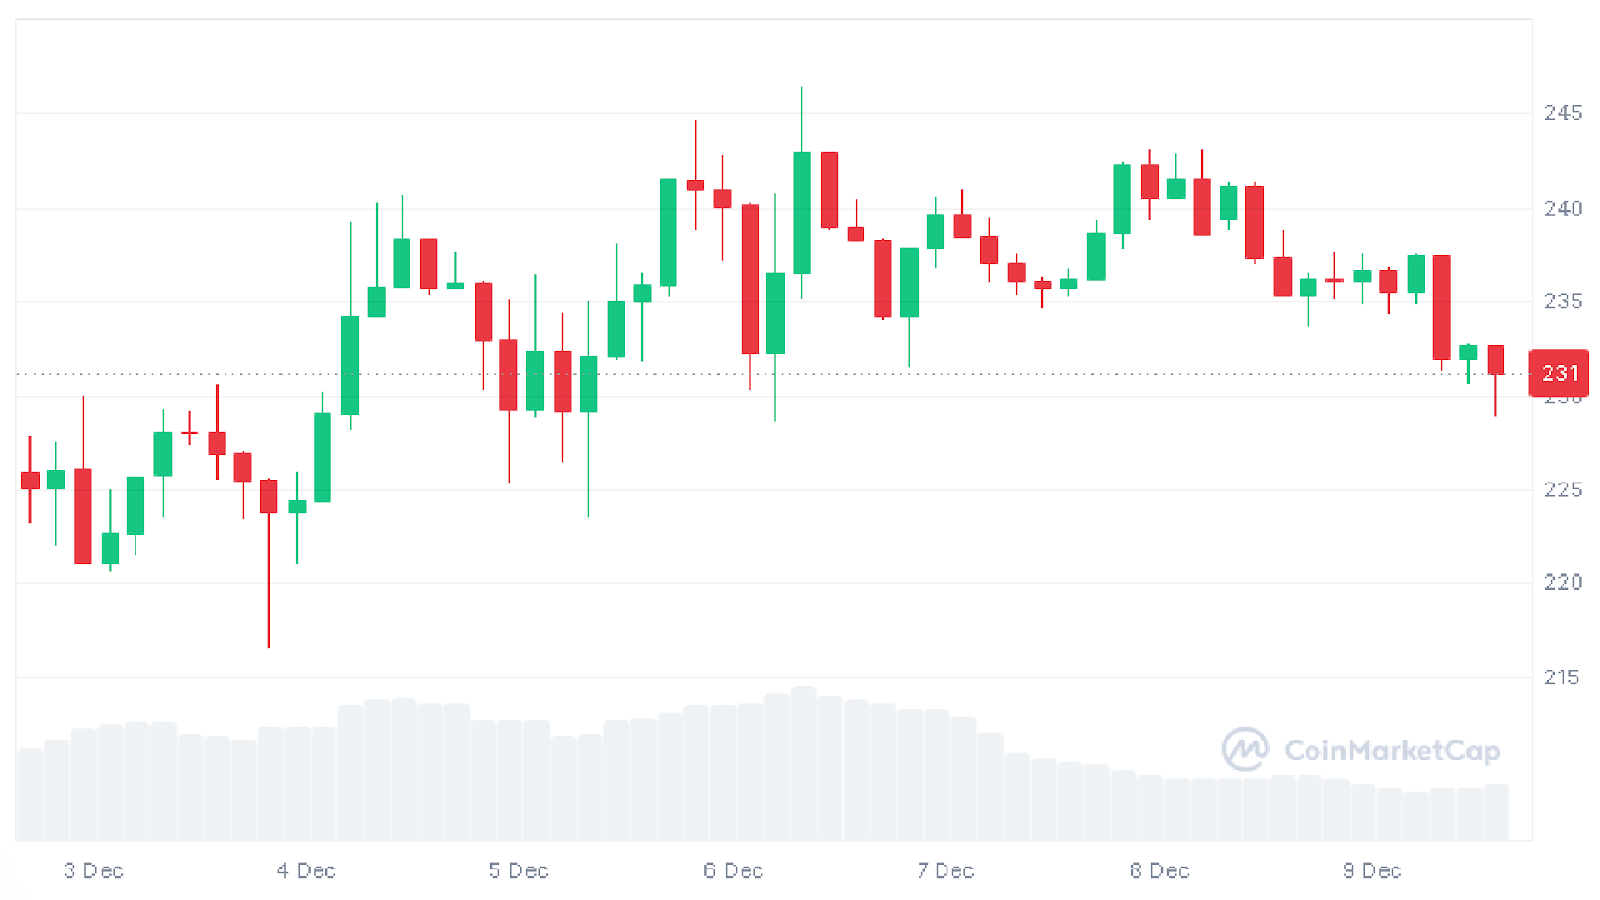
Over the past week, Solana has steered a volatile yet consolidative pattern, oscillating between $225 and $245 before closing near $231. Solana’s recent technical indicators also show mixed signals:

  • 10-day SMA: $240.01, just above the 100-day SMA of $231.69.
  • RSI: 51.74, indicating neutral conditions.
  • Trading Volume: Declined from $14 billion two weeks ago to $4.4 billion as of press time.
Solana (SOL) 7-day trading chart from CoinMarketCap, showing price fluctuations between $225 and $245 before settling at $231

Solana (SOL) 7-day trading chart from CoinMarketCap, showing price fluctuations between $225 and $245 before settling at $231

On-chain data also highlights sustained whale interest, with 185,000 SOL tokens ($42 million) withdrawn from Binance last week. Additionally, Solana’s ecosystem is thriving, fueled by DEX volumes surpassing $100 billion and meme coins like WIF driving user activity. However, breaking $500 depends on maintaining momentum from whales and broader market optimism, including Bitcoin’s rally above $100,000.

While Solana’s fundamentals remain robust, challenges like resistance at $240 and a cooling meme coin frenzy may delay its push to $500. For now, all eyes are on Solana’s ability to reclaim its bullish trajectory. Meanwhile, JetBolt (JBOLT) is making waves of its own with a groundbreaking zero-gas presale and outstanding blockchain capabilities that are turning heads across the crypto community.

JetBolt (JBOLT): The Zero-Gas Revolution Taking Altseason by Storm

JetBolt (JBOLT) is rewriting the rules of altcoins during its ongoing presale. Since its launch, JetBolt’s presale has been blazing through the altseason, with over 100 million JBOLT tokens already snapped up, cementing its place as the new sensation ready to reshape the crypto landscape.

Thinking of expanding into Africa?

Avoid the common mistakes businesses during expansion. Register to learn the common mistakes business make when expanding into Africa.

Written by seasoned experts, who have over 16 years of experience in Free Zones development. Learn more.

This next-gen altcoin is already shaking up the market with its zero-gas technology, powered by the Skale Network. Say goodbye to high gas fees—JetBolt ensures seamless, gas-free transactions. This innovation also unlocks limitless possibilities for rolling out dApps, SocialFi, Web3, and blockchain gaming projects, giving developers the freedom to build without gas-cost limitations.

On top of that, JetBolt’s AI-powered crypto tool delivers the latest market data and crypto news to its users, seamlessly integrating utility into its platform and equipping users with a cutting-edge tool to help them navigate the fast-paced crypto space.

Meanwhile, JetBolt revolutionizes staking with its user-friendly Web3 wallet, making joining as simple as a few clicks, while turning the process into a vibrant, community-driven experience. Stakers don’t just earn rewards for token staking—they also get bonuses for active participation and collaboration within the ecosystem, transforming engagement into real value.

JetBolt’s presale success has been impossible to ignore, with whales making moves to secure their share of the future of blockchain technology, and the excitement shows no signs of slowing down. JetBolt’s special Alpha Boxes, which reward batch purchases with up to 25% additional JBOLT tokens, have been particularly popular, creating a rush to grab these exclusive bonuses.

With innovation at every turn, unmatched utility, and a fully functional ecosystem already in place even during its presale phase, JetBolt isn’t just keeping up with the altseason buzz—it’s setting the pace for what the future of altcoins looks like.

SOL Price Prediction: Can SOL Hit $500 as JetBolt Spikes This AltseasonSOL Price Prediction: Can SOL Hit $500 as JetBolt Spikes This Altseason

Can SOL Hit $500 as JetBolt Spikes This Altseason?

Solana (SOL) continues to dominate headlines, consolidating just above $230 with whales eyeing its next move. Meanwhile, JetBolt’s (JBOLT) presale has already sold over 100 million tokens, driven by its zero-gas technology and plethora of cutting-edge features with real-world utility, pulling in major whale activity. While Solana’s breakout remains uncertain, JetBolt’s explosive momentum signals what could be a seismic shift in the altcoin space, proving it’s one to watch this altseason.

Visit the links below to learn more about JetBolt’s exciting features and presale:

Official Website: https://jetbolt.io/

X/Twitter Page: https://x.com/jetboltofficial

Please keep in mind that this article is not to be taken as financial or trading advice. Cryptocurrency markets are unpredictable and volatile—always do your own research and/or consult an expert before jumping into any crypto ventures. While we strive for accuracy, the fast-moving crypto world means details can quickly change. Proceed responsibly and stay informed.


Source link

10 12, 2024

Natural Gas Price Forecast: Poised for Upswing Amid Symmetrical Triangle Support

By |2024-12-10T00:53:22+02:00December 10, 2024|Forex News, News|0 Comments


Watching for Further Bullish Signs

Further bullish signs may include a daily close above the three-day high, or a daily close above the five-day high of 3.22, and then a daily close above the nearby uptrend line. The uptrend line must be watched visually. Natural gas is rallying following a successful test of support around the breakout area for a symmetrical triangle pattern, which includes a 61.8% Fibonacci retracement.

In other words, it is rising off a logical support zone that could complete the bearish retracement. Also, notice that over the past few days as natural gas was trying to find a bottom it was able to close above the 20-Day MA trend indicator each day.

Trend Support Indicated by 20-Day MA at 3.11

The 20-Day MA is now at 3.11. Along with the internal uptrend line, the 20-Day line provides a dynamic support line for the trend. If support continues to be found at or above the 20-Day MA, the rising trend remains in place. Since a bullish breakout of a symmetrical triangle formation occurred recently, there is the potential for a new upswing for the developing bull trend. Following the initial breakout, above 3.02, natural gas was able to sustain strength and reclaim prior swing highs at 3.16 and 3.39. This is bullish behavior that should return to the market for natural gas once the correction is complete.

Weekly Bullish Reversal Also Triggered

There was also a bullish reversal that triggered today on the weekly chart as last week’s high of 3.28 was exceeded to the upside. Therefore, the high provide another key near-term pivot to keep an eye on. A daily close above that level would provide another sign of strengthening.

For a look at all of today’s economic events, check out our economic calendar.


Source link

Go to Top