About Editorial team of BIPNs

Main team of content of bipns.com. Any type of content should be approved by us.
3 12, 2024

XAG/USD remains capped below $31.00, further consolidation cannot be ruled out: Analytics and Market news from 3 December 2024 07:11

By |2024-12-03T11:20:54+02:00December 3, 2024|Forex News, News|0 Comments


  • Silver price climbs to around $30.90 in Tuesday’s early European session, up 1.24% on the day. 
  • Silver crosses above the 100-day EMA, but further consolidation cannot be ruled out with the neutral RSI indicator. 
  • The first upside barrier is located at $31.68; the initial support level is seen at $30.50.

The Silver price (XAG/USD) gains traction to near $30.90 during the early European session on Tuesday. The white metal edges higher due to the potential stimulus measures from China and ongoing geopolitical uncertainty. 

However, JPMorgan analysts expect a near-term downside for base metals in early 2025 due to potential US tariffs on Chinese goods but see a recovery later in the year, bolstered by stronger Chinese economic stimulus and improved valuations.

According to the daily chart, Silver is set to resume its upside as the price crosses above the key 100-day Exponential Moving Average (EMA). However, further consolidation cannot be ruled out as the 14-day Relative Strength Index (RSI) hovers around the midline, indicating the neutral momentum of the white metal. 

The immediate resistance level for XAG/USD emerges near the upper boundary of the Bollinger Band of $31.68. Any follow-through buying above this level could pave the way to the $32.90-$33.00 zone, representing the psychological level and the high of November 5. The additional upside filter to watch is $34.55, the high of October 29. 

In the bearish event, sustained trading below $30.50, the 100-day EMA, could see a drop to $29.65, the low of November 28. A breach of the mentioned level could expose $27.70, the low of September 9. 

Silver price (XAG/USD) Daily Chart

Silver FAQs

Silver is a precious metal highly traded among investors. It has been historically used as a store of value and a medium of exchange. Although less popular than Gold, traders may turn to Silver to diversify their investment portfolio, for its intrinsic value or as a potential hedge during high-inflation periods. Investors can buy physical Silver, in coins or in bars, or trade it through vehicles such as Exchange Traded Funds, which track its price on international markets.

Silver prices can move due to a wide range of factors. Geopolitical instability or fears of a deep recession can make Silver price escalate due to its safe-haven status, although to a lesser extent than Gold’s. As a yieldless asset, Silver tends to rise with lower interest rates. Its moves also depend on how the US Dollar (USD) behaves as the asset is priced in dollars (XAG/USD). A strong Dollar tends to keep the price of Silver at bay, whereas a weaker Dollar is likely to propel prices up. Other factors such as investment demand, mining supply – Silver is much more abundant than Gold – and recycling rates can also affect prices.

Silver is widely used in industry, particularly in sectors such as electronics or solar energy, as it has one of the highest electric conductivity of all metals – more than Copper and Gold. A surge in demand can increase prices, while a decline tends to lower them. Dynamics in the US, Chinese and Indian economies can also contribute to price swings: for the US and particularly China, their big industrial sectors use Silver in various processes; in India, consumers’ demand for the precious metal for jewellery also plays a key role in setting prices.

Silver prices tend to follow Gold’s moves. When Gold prices rise, Silver typically follows suit, as their status as safe-haven assets is similar. The Gold/Silver ratio, which shows the number of ounces of Silver needed to equal the value of one ounce of Gold, may help to determine the relative valuation between both metals. Some investors may consider a high ratio as an indicator that Silver is undervalued, or Gold is overvalued. On the contrary, a low ratio might suggest that Gold is undervalued relative to Silver.


Source link

3 12, 2024

Dogecoin Price Could Rally 400% As Whales Move $100M DOGE

By |2024-12-03T10:02:10+02:00December 3, 2024|Crypto News, News|0 Comments

Dogecoin (DOGE) price has seen a retracement in the last 24 hours after failing to breach the resistance at the intra-day high of $0.4602. However, during the dip, Dogecoin whales have transferred over $100 million worth of DOGE, signaling significant market interest in the asset. Simultaneously, analysts anticipate that DOGE could potentially experience a 400% price surge in light of the heightened market interest amid a highly bullish Q4 market.

Whale Transactions Indicate Increased Market Activity

Recent reports reveal that two large transactions have taken place involving Dogecoin, involving over 249 million DOGE worth around $102 million. The first transaction saw 131 million DOGE transferred from an unknown wallet to Coinbase, while the second involved 117 million DOGE moved from Binance to an undisclosed wallet.

These large transfers could suggest that whales are positioning themselves for a possible price move, while also indicating heightened market interest.

The increased activity by major holders often signals potential price shifts. As DOGE trades above $0.40, many market participants are closely watching these large transfers, which may precede a breakout or retracement in price. In particular, the recent surge in derivatives trading volume by 77% suggests a rise in demand for Dogecoin, potentially setting the stage for the next big move.

Analyst Predicts 400% Dogecoin Price Surge

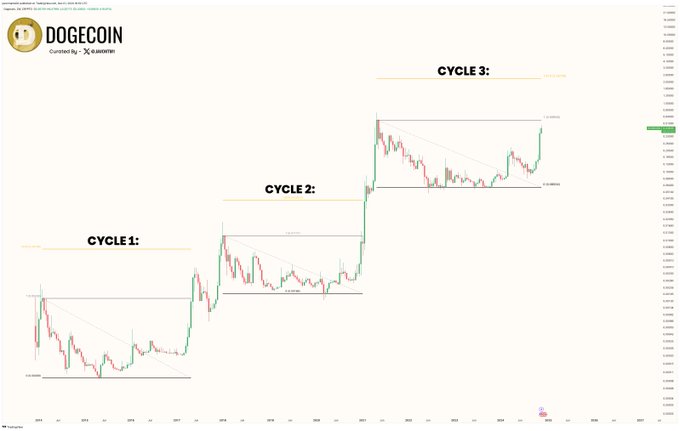
Market analyst Javon Marks has speculated that Dogecoin’s price could rise by 400% based on historical trends and Fibonacci extension levels. According to Marks, the meme coin is in its third bull cycle, following similar patterns from previous cycles in 2017 and 2021. The analyst believes that DOGE price could target the 1.618 Fibonacci extension, which currently sits at $2.28, up from its current price of around $0.42.

Image

In his analysis, Marks points out that during the previous bull cycles, Dogecoin surged from its market bottom to the 1.618 Fibonacci extension level. In 2017, DOGE rose from $0.00009 to a peak of $0.8750, while in 2021, the asset moved from $0.00168 to its current all-time high of $0.73995.

Marks anticipates that a similar trend could unfold this time, with DOGE rising from its current cycle bottom at $0.06004 to $2.28. This represents a potential upside of 457% from the current price.

DOGE Bullish Pennant Formation Signal Breakout

Technical indicators are also signaling a bullish outlook for Dogecoin. The chart pattern currently forming suggests a Bullish Pennant, a continuation formation that typically precedes an upward breakout. After a strong price increase, DOGE has entered a consolidation phase, where it is currently trading near the $0.42 level. This consolidation may indicate a cooling-off period before the price makes another significant move.

The breakout from this pattern could propel Dogecoin to higher levels. If the price clears key resistance at $0.45 and $0.50, it could test the projected target level of $0.65. This would align with the bullish structure observed in previous cycles, where DOGE experienced substantial upward movements following similar consolidations.

doge/usd price chart (source: TradingView)doge/usd price chart (source: TradingView)
doge/usd price chart (source: TradingView)

As Dogecoin continues to consolidate, traders and analysts are keeping an eye on key support and resistance levels. The immediate support for DOGE lies at $0.40, where the price has recently stabilized. If this level holds, DOGE may be able to push through the next resistance at $0.45.

A breakout above this level could pave the way for further gains, potentially bringing DOGE closer to the $0.50 mark amid Dogecoin ETF anticipation. On the other hand, if the price fails to hold above $0.40, there could be a pullback to lower support levels at $0.35.

✓ Share:

Kelvin Munene Murithi

Kelvin is a distinguished writer with expertise in crypto and finance, holding a Bachelor’s degree in Actuarial Science. Known for his incisive analysis and insightful content, he possesses a strong command of English and excels in conducting thorough research and delivering timely cryptocurrency market updates.

Disclaimer: The presented content may include the personal opinion of the author and is subject to market condition. Do your market research before investing in cryptocurrencies. The author or the publication does not hold any responsibility for your personal financial loss.


Source link

3 12, 2024

4 winning branded ingredients for active nutrition supplements

By |2024-12-03T08:02:52+02:00December 3, 2024|Dietary Supplements News, News|0 Comments


Todd Runestad has been writing on nutrition science news since 1997. He is content director for SupplySide Supplement Journal and its digital magazines. Other incarnations: content director for Natural Products Insider (now rebranded to SupplySide Supplement Journal), supplements editor for NewHope.com, Delicious Living!, and Natural Foods Merchandiser. Former editor-in-chief of Functional Ingredients magazine and still covers raw material innovations and ingredient science.

Connect with me here on LinkedIn.

Specialty

Todd writes about nutrition science news such as this story on mitochondrial nutrients, innovative ingredients such as this story about 12 trendy new ingredient launches from SupplySide West 2023, and is a judge for the NEXTY awards honoring innovation, integrity and inspiration in natural products including his specialty — dietary supplements. He extensively covered the rise and rise and rise and fall of cannabis hemp CBD. He helps produce in-person events at SupplySide West and SupplySide East trade shows and conferences, including the wildly popular Ingredient Idol game show, as well as Natural Products Expo West and Natural Products Expo East and the NBJ Summit. He was a board member for the Hemp Industries Association.

Education / Past Lives

In previous lives Todd was on the other side of nature from natural products — natural history — as managing editor at the Denver Museum of Nature & Science. He’s sojourned to Burning Man and Mount Everest. He graduated many moons ago from the State University of New York College at Oneonta.

Quotes

“There is not a colds-and-flu season. There is a vitamin D-deficiency season.”

“There is no such thing as inclement weather. Only improper attire.”

Link answers question, “When taking magnesium, should you also take vitamin D3 2,000 IU?”

“Cannabis is nature’s most nearly perfect plant.”


Source link

3 12, 2024

Can Cardano Price Rally another 230% in December?

By |2024-12-03T08:00:57+02:00December 3, 2024|Crypto News, News|0 Comments

Cardano price, a standout in the crypto market, surged past $1 this November, solidifying its position among top-performing altcoins. This remarkable rally reflects growing bullish sentiment across the sector, drawing renewed interest from investors in alternative digital assets. ADA has demonstrated robust upward momentum, making it a key performer in the market’s resurgence. With increasing optimism, speculation arises whether Cardano could achieve another significant rally, potentially surging 230% by December’s end.

Is a 230% Cardano Price Rally on the Horizon This December?

Cardano price is gaining attention as traders analyze its price movements and predict potential future trends. However, speculation about a massive 230% price rally appears unlikely. Current market signals suggest a possible correction instead of the anticipated upward surge.

The provided analysis highlights a critical support level of $1.10. A sustained drop below this level would signify a bearish trend shift. If the price falls further and breaks under $1.03, it could confirm a bearish breakout, potentially driving the value down to $0.88. Such a move would represent a significant 20% correction, countering the bullish expectations. Even if Cardano manages to break out from its current consolidation, the likelihood of achieving a 230% rally seems remote. 

Can Cardano Price Rally another 230% in December?
Source: X

ADA Price Soars 10%; What Next for Token?

At the time of writing, the ADA price has surged by 12%, trading at $1.20. The Cardano price demonstrated impressive performance over the past 24 hours, rallying from a low of $1.06 to a high of $1.21. The gain signals renewed investor confidence in the cryptocurrency, placing it back in the spotlight among top-performing assets. The Relative Strength Index (RSI) at 81, the asset currently sits in overbought territory, suggesting potential caution for investors.

The top altcoin is nearing a critical resistance level at $1.3, supported by bullish momentum that signals the potential for further gains. A successful breakthrough could propel the cryptocurrency toward the $2 mark, its next significant resistance point.

Can Cardano Price Rally another 230% in December?Can Cardano Price Rally another 230% in December?
Cardano Price Chart: TradingView

The whale activity surrounding Cardano price has surged, with transactions exceeding $100K, alongside ADA’s rising price. This growing activity highlights increasing interest from large investors. Notably, ADA’s price gains correlate with heightened whale transaction counts, reflecting positive sentiment. This trend underscores the significance of institutional involvement in Cardano’s ecosystem.

Source- Santiment

Cardano’s recent surge has captured attention, but a 230% rally seems overly optimistic. While bullish trends persist, overbought indicators and resistance levels suggest caution. Investors should monitor key levels as the market unfolds, balancing optimism with realistic expectations.

Frequently Asked Questions (FAQs)

A 230% rally appears unlikely based on current market indicators.

Key support levels are $1.10 and $1.03, with potential bearish trends below these.

Key resistance levels are $1.30 and $2.

✓ Share:

Coingape Staff

CoinGape comprises an experienced team of native content writers and editors working round the clock to cover news globally and present news as a fact rather than an opinion. CoinGape writers and reporters contributed to this article.

Disclaimer: The presented content may include the personal opinion of the author and is subject to market condition. Do your market research before investing in cryptocurrencies. The author or the publication does not hold any responsibility for your personal financial loss.


Source link

3 12, 2024

XAU/USD buyers appear non-committal ahead of US labor data

By |2024-12-03T07:18:41+02:00December 3, 2024|Forex News, News|0 Comments


  • Gold price nurses losses below $2,650 early Tuesday, awaits US JOLTS survey for fresh impetus.   
  • US Dollar recovers from Fedspeak-induced pain as market mood sours on China concerns, looming Trump tariffs threat.
  • Technically, Gold price stays below the 21-day SMA at $2,641 with a bearish daily RSI.

Gold price is nursing losses below $2,650 in Asian trades on Tuesday, though remaining in the recent range, awaiting the key US employment data for further trading directives. The US JOLTS Job Openings data will set off the critical week of top-tier labor data, offering hints on the US Federal Reserve’s (Fed) future interest rate cuts.

Gold price awaits US data for fresh cues on the Fed policy

The focus now seems to have shifted toward the sentiment surrounding the Fed policy outlook following the latest speeches from several Fed policymakers and ahead of Friday’s Nonfarm Payrolls (NFP) data.

The US Dollar (USD) returned to the red in American trading on Monday after Fed Governor Christopher Waller said that “policy is still restrictive enough that an additional cut at our next meeting will not dramatically change the stance of monetary policy and allow ample scope to later slow the pace of rate cuts, if needed, to maintain progress toward our inflation target.”

The Greenback erased gains from the first half of Monday’s trading, spurred by broad risk-aversion as traders took account of US President-elect Donald Trump’s weekend warning against the so-called ‘BRICS’ nations. Trump threatened 100% tariffs on Brazil, Russia, India, China and South Africa if they create a new currency or support another currency that would replace the Greenback.

However, the revival of the haven demand for the USD early Tuesday keeps Gold buyers on the back seat. Persistent China’s economic concerns and the global tariff threat from Trump remain a drag on investors’ sentiment.

The next direction in Gold price will likely hinge on the upcoming US employment data and their impact on the Fed rate cut expectations. Markets are currently pricing in a 75% probability of a 25 basis points (bps) rate cut later this month, the CME Group’s FedWatch Tool shows, up from about 65% seen a day ago. Dovish Fed expectations tend to benefit the non-interest-bearing Gold price.

Meanwhile, Gold traders also remain wary of the geopolitical tensions between Russia and Ukraine and Israel and Iran, which could have a strong bearing on the traditional safe-haven asset, Gold price.

Gold price technical analysis: Daily chart

Having closed below the critical short-term 21-day Simple Moving Average (SMA) support, now at $2,641, Gold buyers seem reluctant to step in.

The 14-day Relative Strength Index (RSI) sits beneath the 50 level, justifying the cautious approach.

The previous week’s Bear Cross also remains in play, adding to the downside risks in Gold price.

Gold sellers need to crack the $2,621 static support to challenge the previous week’s low of $2,605.

A sustained drop below that level could expose the 100-day SMA at $2,577.

Conversely, recapturing the 21-day SMA support-turned-resistance at $2,641 is critical to reviving the recent recovery.

The next relevant resistance aligns at the 50-day SMA at $2,669, above which the $2,700 level will be on buyers’ radars.

Economic Indicator

JOLTS Job Openings

JOLTS Job Openings is a survey done by the US Bureau of Labor Statistics to help measure job vacancies. It collects data from employers including retailers, manufacturers and different offices each month.

Read more.


Source link

3 12, 2024

USD/JPY Forecast Today 02/12: Tests Key Support (Video)

By |2024-12-03T06:02:35+02:00December 3, 2024|Forex News, News|0 Comments

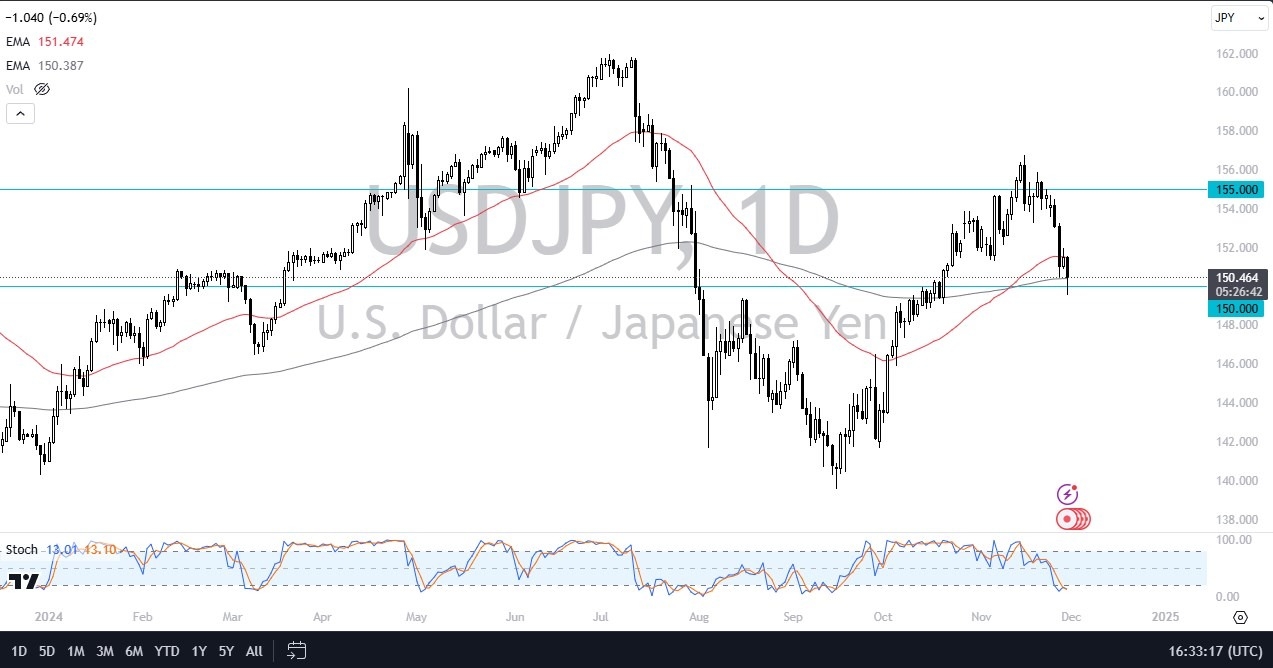
  • The US dollar has plunged against the Japanese yen during the trading session on Friday to dip below the 150 yen level.
  • But this is an area that I think will continue to be crucial, so it’ll be interesting to see how this plays out.
  • I like the idea of buying on a dip that then finds itself bouncing, and I think that’s what we’re watching right now to see whether or not it happens.

We are right around the 200 day EMA, so I would anticipate a certain amount of technical trading in this area regardless. The fact that the 150 yen level is a large round psychologically significant figure is probably something worth paying attention to anyways. Ultimately, I think this is a situation where if we can break above the top of the candlestick for the Friday session, then we could really start to take off towards the 155 yen level.

On the other hand, if we break down below the bottom of the candlestick for the USD/JPY trading session on Friday, then we could go down to the 148 in level, possibly even 146 yen. There is an interest rate differential that you need to pay close attention to. With that being said, I think you’ve got to look at this as a scenario where traders will probably continue to find one way or the other to take advantage of this interest rate differential.

If things settle down. When you look at the pullback that we’ve seen from the bounce, we’re only at about the 38.2% Fibonacci retracement level. So really, it is still technically bullish. It’s just been tough to be bullish over the last four or five sessions. A bounce from here though, would solidify the idea of people taking advantage of the carry trade. So, we’ll have to wait and see how that plays out.

Want to trade our USD/JPY forex analysis and predictions? Here’s a list of forex brokers in Japan to check out. 

Source link

3 12, 2024

Ripple’s XRP extends monthly gains above 400% in quest for new all-time high, key metrics to keep tabs on

By |2024-12-03T06:00:13+02:00December 3, 2024|Crypto News, News|0 Comments

  • Ripple whales have accumulated over $1.8 billion worth of XRP tokens amid a 200% rise in weekly active addresses.
  • WisdomTree filed an S-1 registration with the SEC for an XRP ETF.
  • XRP investors across several cohorts realized over $2.7 billion in profits in past three days following heavy Ripple token unlock.
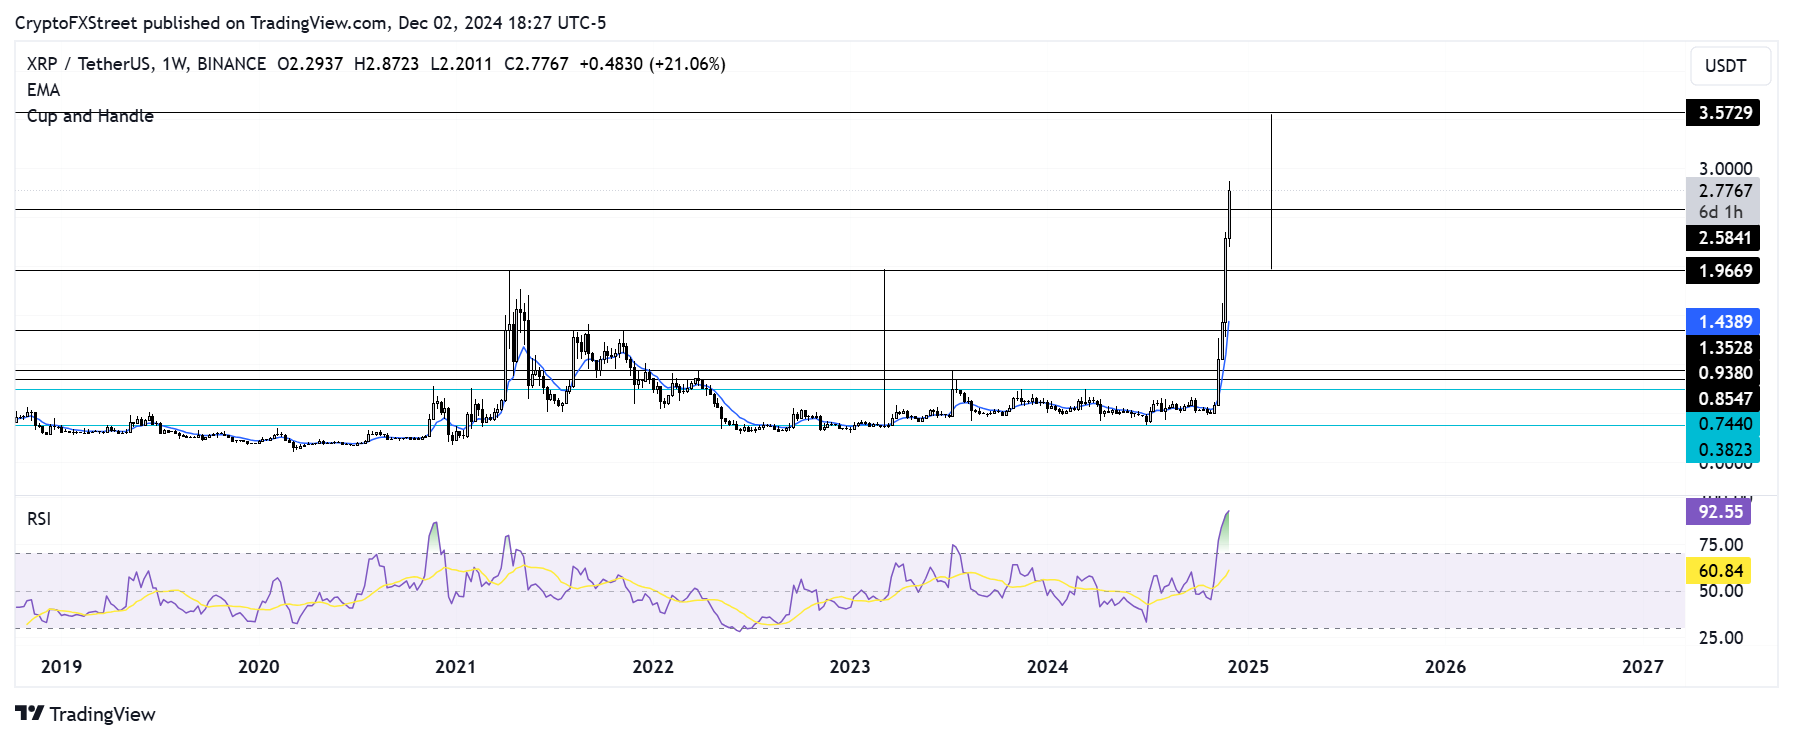
  • XRP eyes a new all-time high at $3.57 after sweeping the $2.58 resistance level.

Ripple’s XRP continued its rally with a 25% surge on Monday, stretching its monthly gains to over 430%. Following the recent uptrend, the remittance-based token now ranks #3 among top cryptocurrencies despite witnessing a mix of bullish and somewhat bearish investor actions in the past few days.

XRP key updates to watch out for amid recent bullish charge

According to Santiment data, XRP has been seeing heightened buying activity from investors in the past three weeks following its recent surge.

Whales holding between 1M-10M of the remittance-based token bought 679.1 million XRP, now worth ~$1.8 billion. This comes as the non-empty XRP wallets surged above 5.5M for the first time since launch.

XRP investors have also woken up as weekly active addresses on the XRP Ledger increased nearly 200% to 307K in the past month — its highest level since August 2023.

XRP Supply Distribution (1M-10M), Weekly Active Addresses & Holders | Santiment

The bullish view is also evident in XRP Coinbase premium, which showed that US traders have likely been fueling the recent price surge. In November, the exchange’s XRP premium ranged from 3% to 13%. However, Upbit, which holds the largest XRP reserve, maintained a moderate premium level.

Meanwhile, asset manager WisdomTree filed an S-1 registration statement with the SEC for an XRP ETF on Monday after an initial registration in the state of Delaware last week. With the latest filings, XRP has joined. Bitwise, 21Shares and Canary Capital.

This follows rumors of the New York government approving Ripple’s stablecoin trending across several investment subgroups on social media platform X, with many speculating on how it could fuel the current XRP bull run.

However, market activity hasn’t been all green for XRP. Following the recent price surge over the weekend, XRP investors realized more than $2.7 billion in profits — the highest in the past eight years. This shows despite the recent whale accumulation, investors are increasingly booking profits as they ride the wave.

XRP Network Realized Profit/Loss

XRP Network Realized Profit/Loss | Santiment

The Mean Coin Age metric, which measures investors’ accumulation/distribution activity, has been trending downwards across all age cohorts. This shows that selling activity has been constant among short-term and long-term investors in the past three weeks.

XRP Mean Coin Ages

XRP Mean Coin Ages | Santiment

Additionally, Ripple unlocked 500 million XRP tokens worth over $1.35 billion on Sunday as part of its escrow unlock system. If this supply enters the market immediately, the current bullish momentum will slow down.

XRP bulls could target a new all-time high at $3.57

Ripple’s XRP smashed the $2.58 resistance on Monday, sparking liquidations of more than $91 million in the past 24 hours, per Coinglass data. Liquidated long and short positions accounted for $38.67 million and $52.47 million, respectively.

XRP/USDT weekly chart

XRP/USDT weekly chart

If XRP maintains the uptrend above the $2.58 level, it could rally as high as $3.57 to complete the maximum profit target of a rounded bottom pattern. The remittance-based token validated the pattern after rallying above the $1.96 level last week.

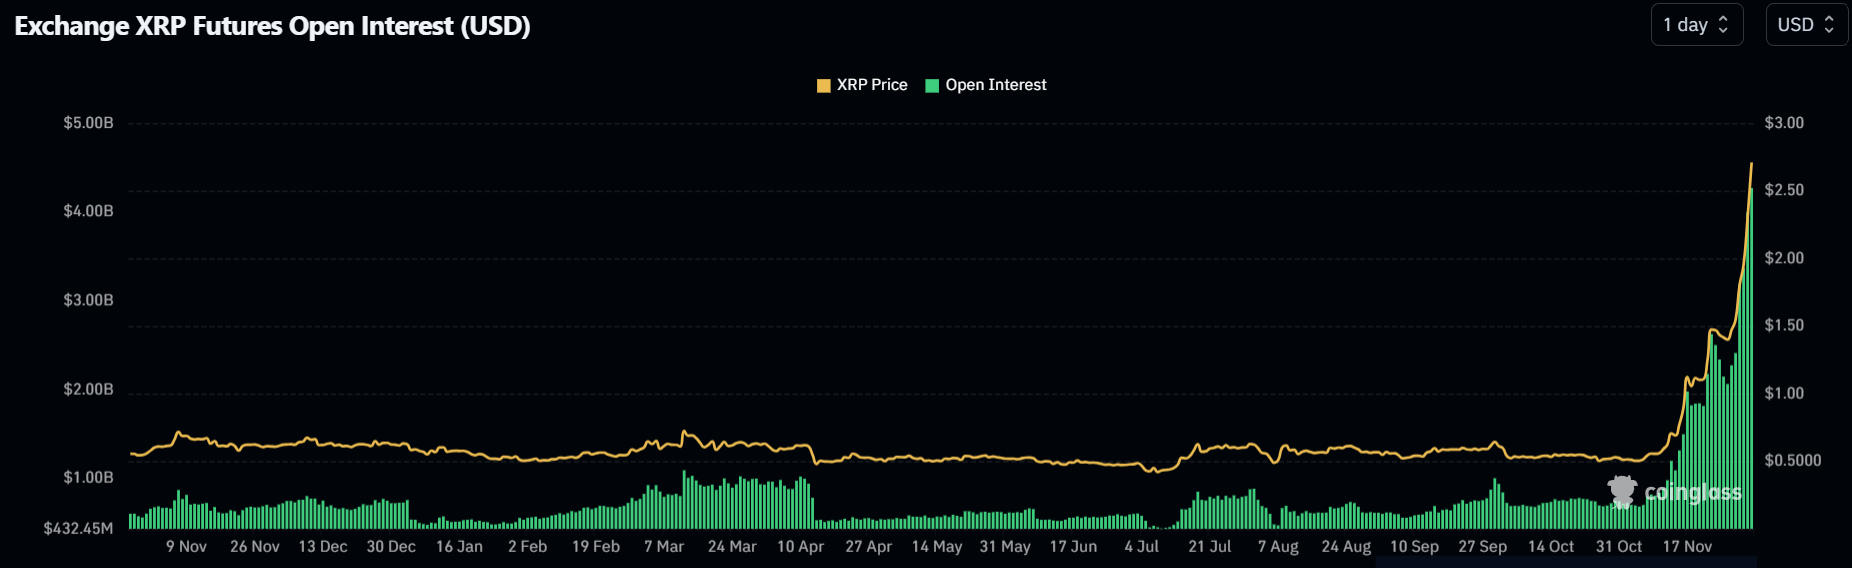
The bullish momentum is strengthened by XRP futures open interest (OI) surge to a new all-time high of $4.24 billion on Monday.

Open interest is the total amount of outstanding contracts in a derivatives market. An increase in OI during a price uptrend signifies new money is coming into the market in support of the bullish momentum.

XRP Open Interest | Coinglass

XRP Open Interest | Coinglass

The Relative Strength Index (RSI) has remained at elevated levels in the oversold region in the past week, indicating a correction is imminent due to overheated prices.

A weekly candlestick close below $1.96 will invalidate the bullish thesis.

Cryptocurrency prices FAQs


Source link

3 12, 2024

Elon Professor explores how NFT collectors navigate the digital art market | Today at Elon

By |2024-12-03T05:39:05+02:00December 3, 2024|News, NFT News|0 Comments


Assistant Professor Hyunuk Kim of Elon’s Business School has published research on how digital art collectors navigate the NFT market using their digital wallets.

Share: