About Editorial team of BIPNs

Main team of content of bipns.com. Any type of content should be approved by us.
3 12, 2024

Can Cardano ADA Break $5 As JetBolt Surges This Altseason

By |2024-12-03T18:07:01+02:00December 3, 2024|Crypto News, News|0 Comments

Cardano (ADA) and JetBolt (JBOLT) are shaking up the market as a potential altseason looms. Rumors are swirling about the U.S. federal government potentially utilizing Cardano’s blockchain technology to develop a secure and transparent election voting system. As the community eagerly awaits further developments, the Cardano price prediction remains full of speculations.

Mirroring the excitement for this altseason, JetBolt’s hot presale has captured the attention of tech-savvy whales. With JBOLT’s zero-gas technology’s innovative approach, combined with a successful presale that has already seen over 100 million tokens sold, has positioned JetBolt as a watch-out new player in the crypto space.

Dive in as we discuss can Cardano ADA break $5 alongside JetBolt surges this altseason.

Cardano Price Prediction: Is the $5 Dream Farfetched?

Cardano’s ADA has been a standout in the crypto market, delivering an impressive rally with over 100% gains in the past nine days, driven by renewed market interest and speculation.

A surge past the $0.6837 mark has fueled optimism, with some attributing the momentum to unconfirmed rumors about the Department of Government Efficiency (DOGE) exploring Cardano for a federal blockchain voting system. Bullish sentiment has been further supported by significant exchange outflows, reflecting strong buying pressure, and a continued push to test key resistance levels at $0.8104.

However, a realistic evaluation of ADA’s near-term trajectory suggests that breaching the ambitious $5 mark is unlikely during this altseason. The Relative Strength Index (RSI) hovering in the overbought territory at 84.56 points to an impending correction, which could stall its current uptrend.

Furthermore, despite bullish market indicators, ADA’s price would require sustained momentum and broader adoption breakthroughs to approach such high valuations. Investors should temper expectations and focus on incremental growth rather than expecting meteoric rises in the short term.

Is JetBolt the Next Star? 100M Tokens Sold So Far

A fresh contender is capturing the imagination of next-gen altcoin enthusiasts—JetBolt (JBOLT). This rising star has already turned heads with its ongoing presale, surpassing the milestone of 100 million tokens sold. This achievement highlights the growing confidence among whales in JetBolt’s potential with the zero-gas technology.

JetBolt stands out in the competitive altcoin market with a suite of groundbreaking innovations. The key to its popularity is its zero-gas technology, a transformative feature powered by the Skale network. By eliminating gas fees, JBOLT addresses one of the most persistent challenges in blockchain transactions. This not only enhances the user experience but also creates a developer-friendly ecosystem, empowering creators to build diverse applications—ranging from dApps to SocialFi platforms—without the financial strain of high transaction costs.

Thinking of expanding into Africa?

Avoid the common mistakes businesses during expansion. Register to learn the common mistakes business make when expanding into Africa.

Written by seasoned experts, who have over 16 years of experience in Free Zones development. Learn more.

Adding to its allure is JetBolt’s fresh approach to staking. Unlike traditional, often complex staking mechanisms, JetBolt introduces a simplified, gamified system. Users can stake their JBOLT tokens and earn rewards, with added bonuses for connecting and engaging with friends on the platform. This social and interactive twist makes staking more engaging, drawing in both crypto veterans and newcomers alike.

Fueling the presale excitement are strategic incentives designed to attract early supporters. Buyers can unlock up to 25% additional tokens through Alpha Box purchases, a perk that appeals to whales and bulk buyers.

As JetBolt surges this altseason, it is rapidly carving out its niche as a standout player in the altcoin space. It’s no surprise that bullish whales are rallying behind JBOLT, anticipating its potential in the crypto landscape.

Cardano Price Prediction: Can ADA  ADA Break $5 As JetBolt Surges This AltseasonCardano Price Prediction: Can ADA  ADA Break $5 As JetBolt Surges This Altseason

Final Thoughts: Cardano and JetBolt–Can They Dominate an Altseason?

Cardano and JetBolt are igniting excitement as the altseason heats up, offering bold innovations that could redefine the crypto landscape. While Cardano eyes institutional use cases with a rumored federal blockchain initiative to break $5, JetBolt takes center stage with its presale momentum and zero-gas revolution. With these projects sparking bullish interest, the coming months promise to reveal which will dominate the altcoin narrative.


Source link

3 12, 2024

EUR/USD, Oil Forecast: Two trades to watch

By |2024-12-03T16:09:54+02:00December 3, 2024|Forex News, News|0 Comments

EUR/USD rises but the outlook remains weak

  • France’s government is on the brink of collapse
  • US JOLTS job openings are due
  • EUR/USD recovers from 1.0460 support

EUR/USD is inching higher after steep losses in the previous session. The market is waiting cautiously for further developments in France and looks ahead to a big week for U.S. economic data.

PM Michel Barnier’s coalition government is on the brink of collapse, and he’s expected to face a vote of no confidence tomorrow, which he is unlikely to win. This could lead to further political uncertainty in the eurozone’s second-largest economy.

Political instability runs alongside a weak economic outlook. Yesterday’s PMI data showed that the region’s manufacturing sector recession continues and shows no sign of letting up.

Adding Trump’s threat of trade tariffs when he takes office in January to the mix, it’s hard to be anything but bearish towards the Euro.

EUR/USD parity wasn’t even a topic for conversation a few months ago. Now, it looks like a possibility in 2025

Separately, the US dollar is easing lower, giving back some of yesterday’s gains. The US dollar typically suffers seasonal weakness in December. However, following Donald Trump’s indication of support for a stronger dollar, that might not necessarily be the case this year.

Over the weekend, trump threatened tariffs, on BRIC members that weren’t committed to the USD as a reserve currency.

Attention today now turns to jolts job openings, which are expected to hold steady at 7.44 million.

The data comes ahead of a busy week for U.S. economic figures, including ADP payrolls, ISM services PMI, and Friday’s non-farm payroll report.

Strong data could see the market rein in fed rate cut expectations fella.

EUR/USD forecast – technical analysis

After running into resistance at 1.06, EUR/USD rebounded lower but found support at 1.0460, the 2023 low. The price trades caught between these levels. The RSI is below 50 and the 50 SMA crossed below the 200 SMA in a bearish signal.

Sellers will look to extend the 2-month bearish trend by taking out support at 1.0460 to brig 1.04 into focus ahead of 1.0330, the 2024 low.

Any recovery would need to rise above 1.06 to negate the trend and create a higher high. Above here, 1.07 comes into play.

eur/usd forecast chart

Oil rises ahead of inventory data & OPEC’s meeting later in the week

  • OPEC+ is expected to postpone the unwinding of production cut
  • Chinese data helped the demand outlook
  • Oil trades in a familiar range

Oil prices are rising in the European session but continued to trade in a narrow range ahead of the OPEC class policy meeting on Thursday.

The market is expecting the group of oil producers to delay its planned unwinding of production cuts beyond January 2025 in the hope of rebalancing the market and protecting prices. The outlook for supply surplus has put pressure on prices, meaning there is little option but to defer.

 Yesterday, Chinese factory activity expanded, raising hopes that the oil demand outlook is improving as the recent stimulus measures seep through the economy. However, optimism over data from China is being offset by questions over the outlook for Fed rate cuts in the coming months.

Geopolitical tensions remain in focus in the Middle East after the US-brokered ceasefire deal between Israel and Hezbollah appears to be on shaky ground.

Attention now turns to US crude stockpiles which are expected to have fallen last week while gasoline and distillate inventories are forecast to have risen. API data is due today, and EIA inventory data will be released on Wednesday.

Oil forecast – technical analysis

Oil continues to trade within a familiar range that it has traded within since September. The price is capped on the upside by 71.50 -72.50 and around 67 -67.50 on the downside. The RSI is neutral.

Sellers will want to wait from a break below 67.00 to enter a sell position, bringing 65.50, the 2024 low, into focus ahead of 63.50, the October 2023 low.

Should buyers rise above 72.50, bulls will look to 75.00 round number and 76.60 the 200 SMA.

oil FORECAST CHART

Source link

3 12, 2024

Health Conscious Consumer Statistics 2024 By Best Results

By |2024-12-03T16:07:50+02:00December 3, 2024|Dietary Supplements News, News|0 Comments


Introduction

Health Conscious Consumer Statistics: A health-conscious consumer prioritizes physical, mental, and environmental well-being in their purchasing decisions.

They favor organic, natural, and plant-based foods, along with functional products like supplements and performance enhancers.

Fitness and active lifestyles are key, with many using technology to track their health. Mental health awareness is also a significant factor, driving interest in stress-reducing and mindfulness products. This group prefers eco-friendly, sustainable options and is heavily influenced by social media trends.

Retailers are responding by offering health-focused products and services, creating growth opportunities in sectors like food, wellness, fitness, and technology.

Editor’s Choice

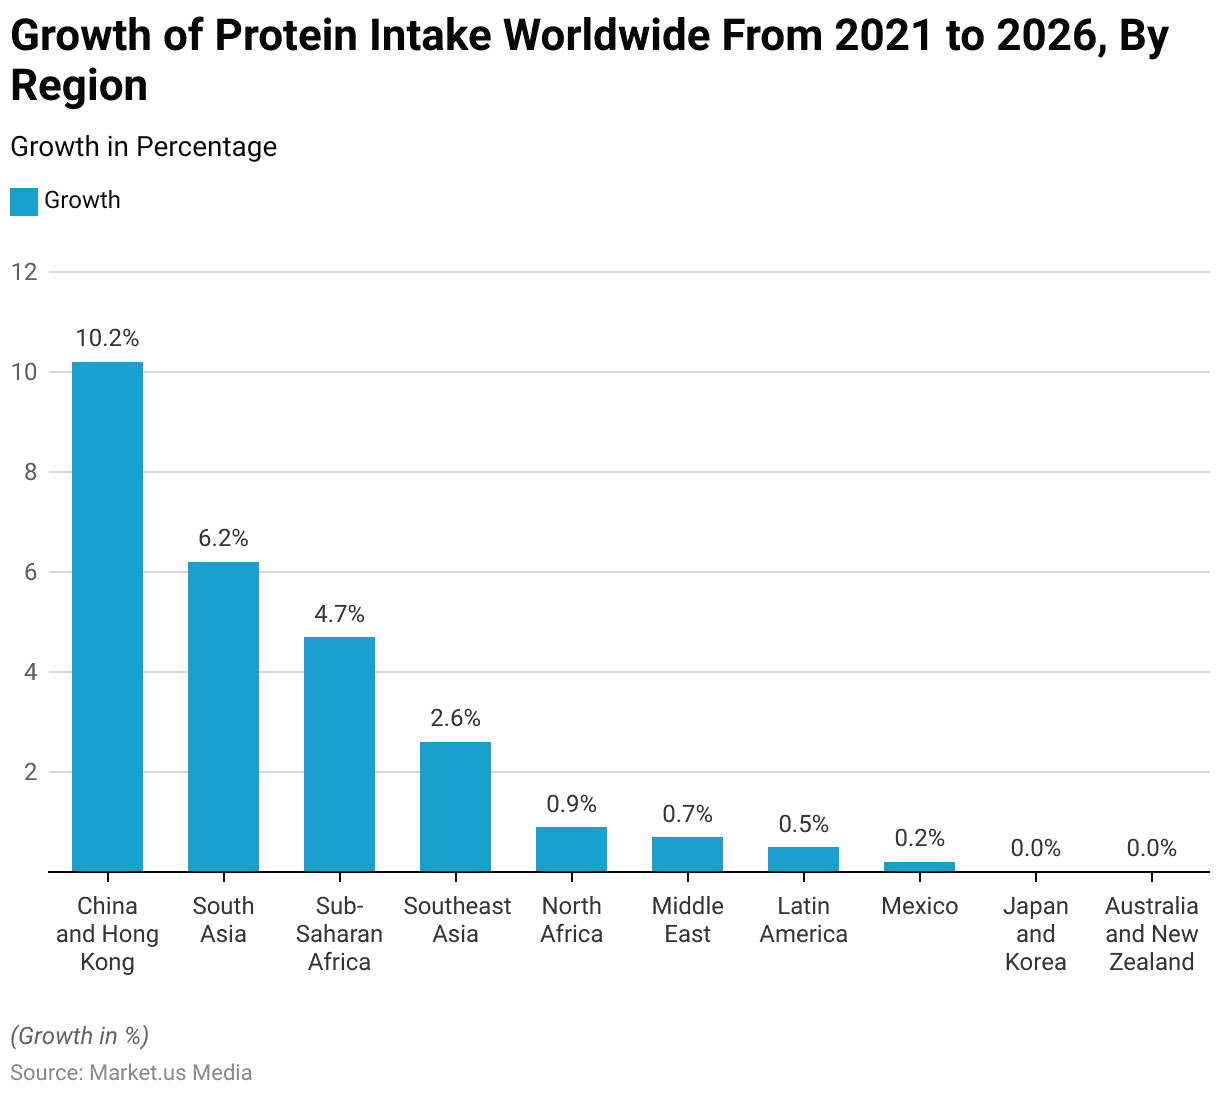
  • From 2021 to 2026, protein intake is expected to grow at varying rates globally, with China and Hong Kong leading at a 10.2% increase.
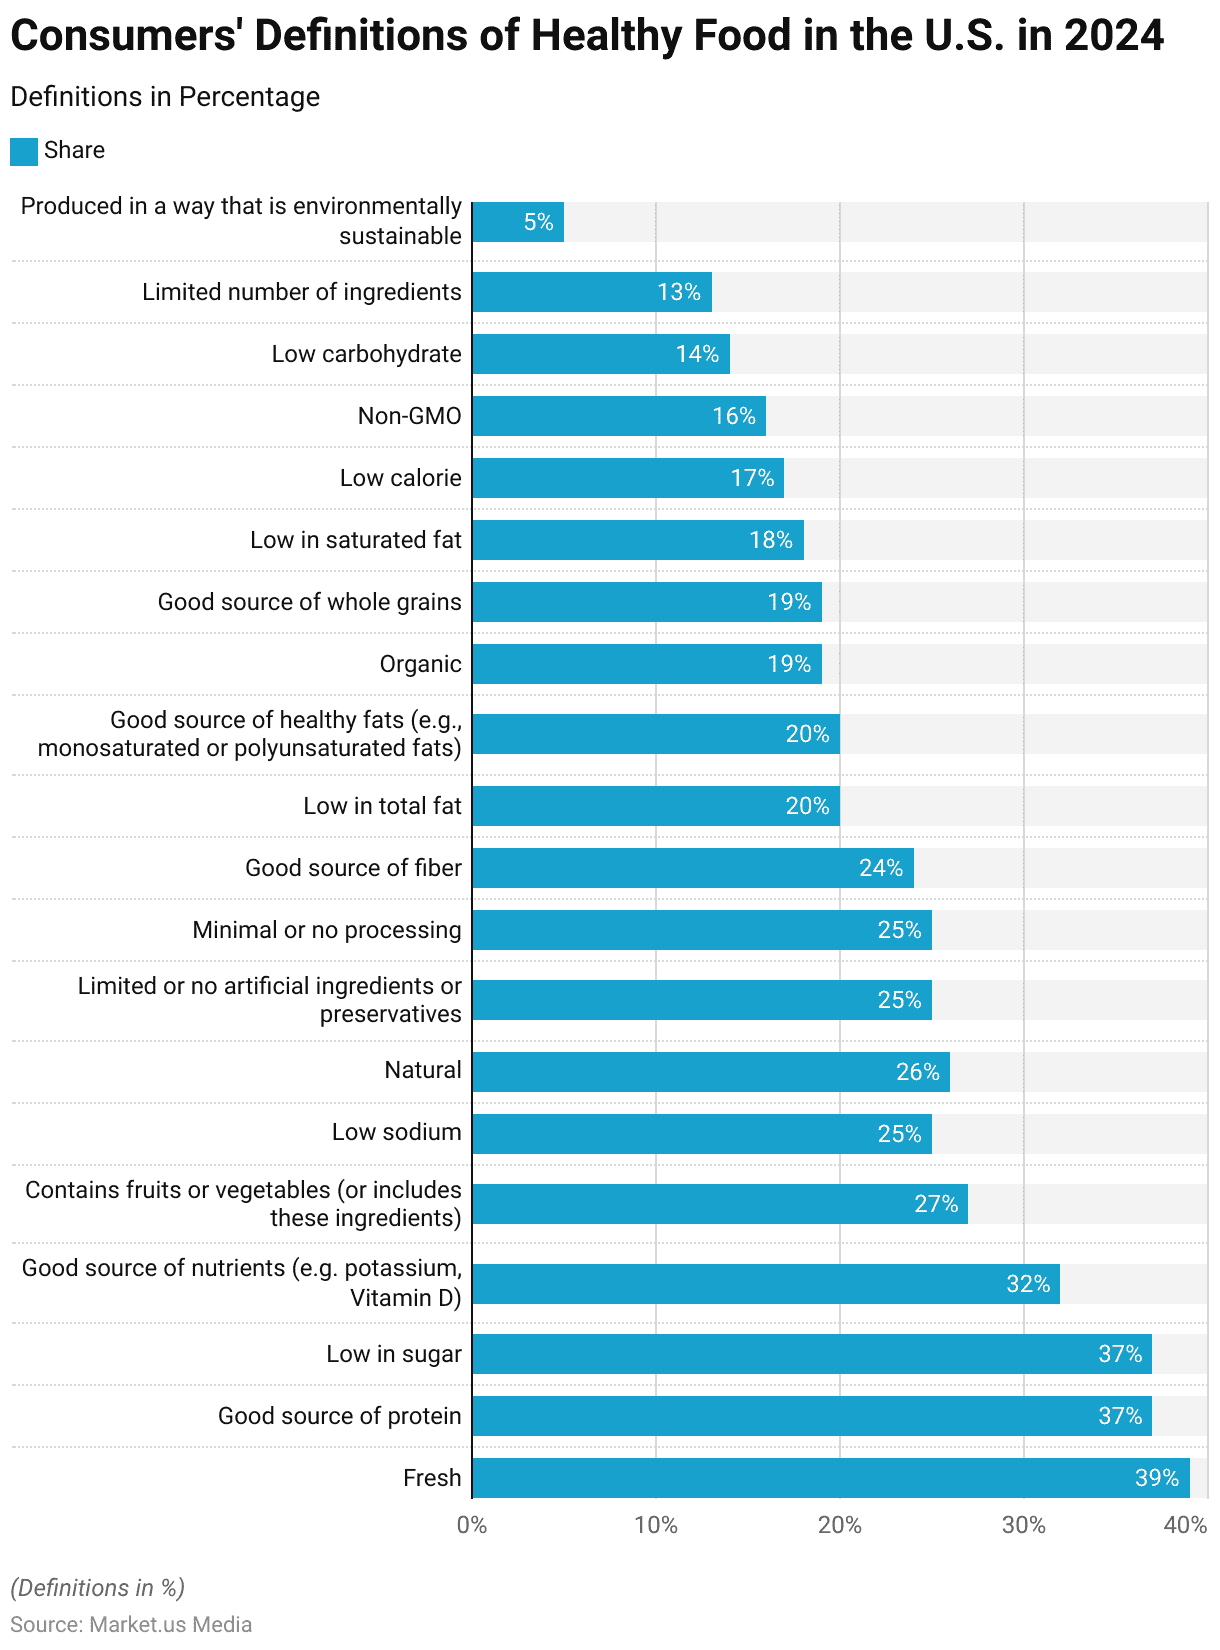
  • In 2024, U.S. consumers defined healthy food primarily as fresh (39%) or rich in protein and low in sugar (37%).
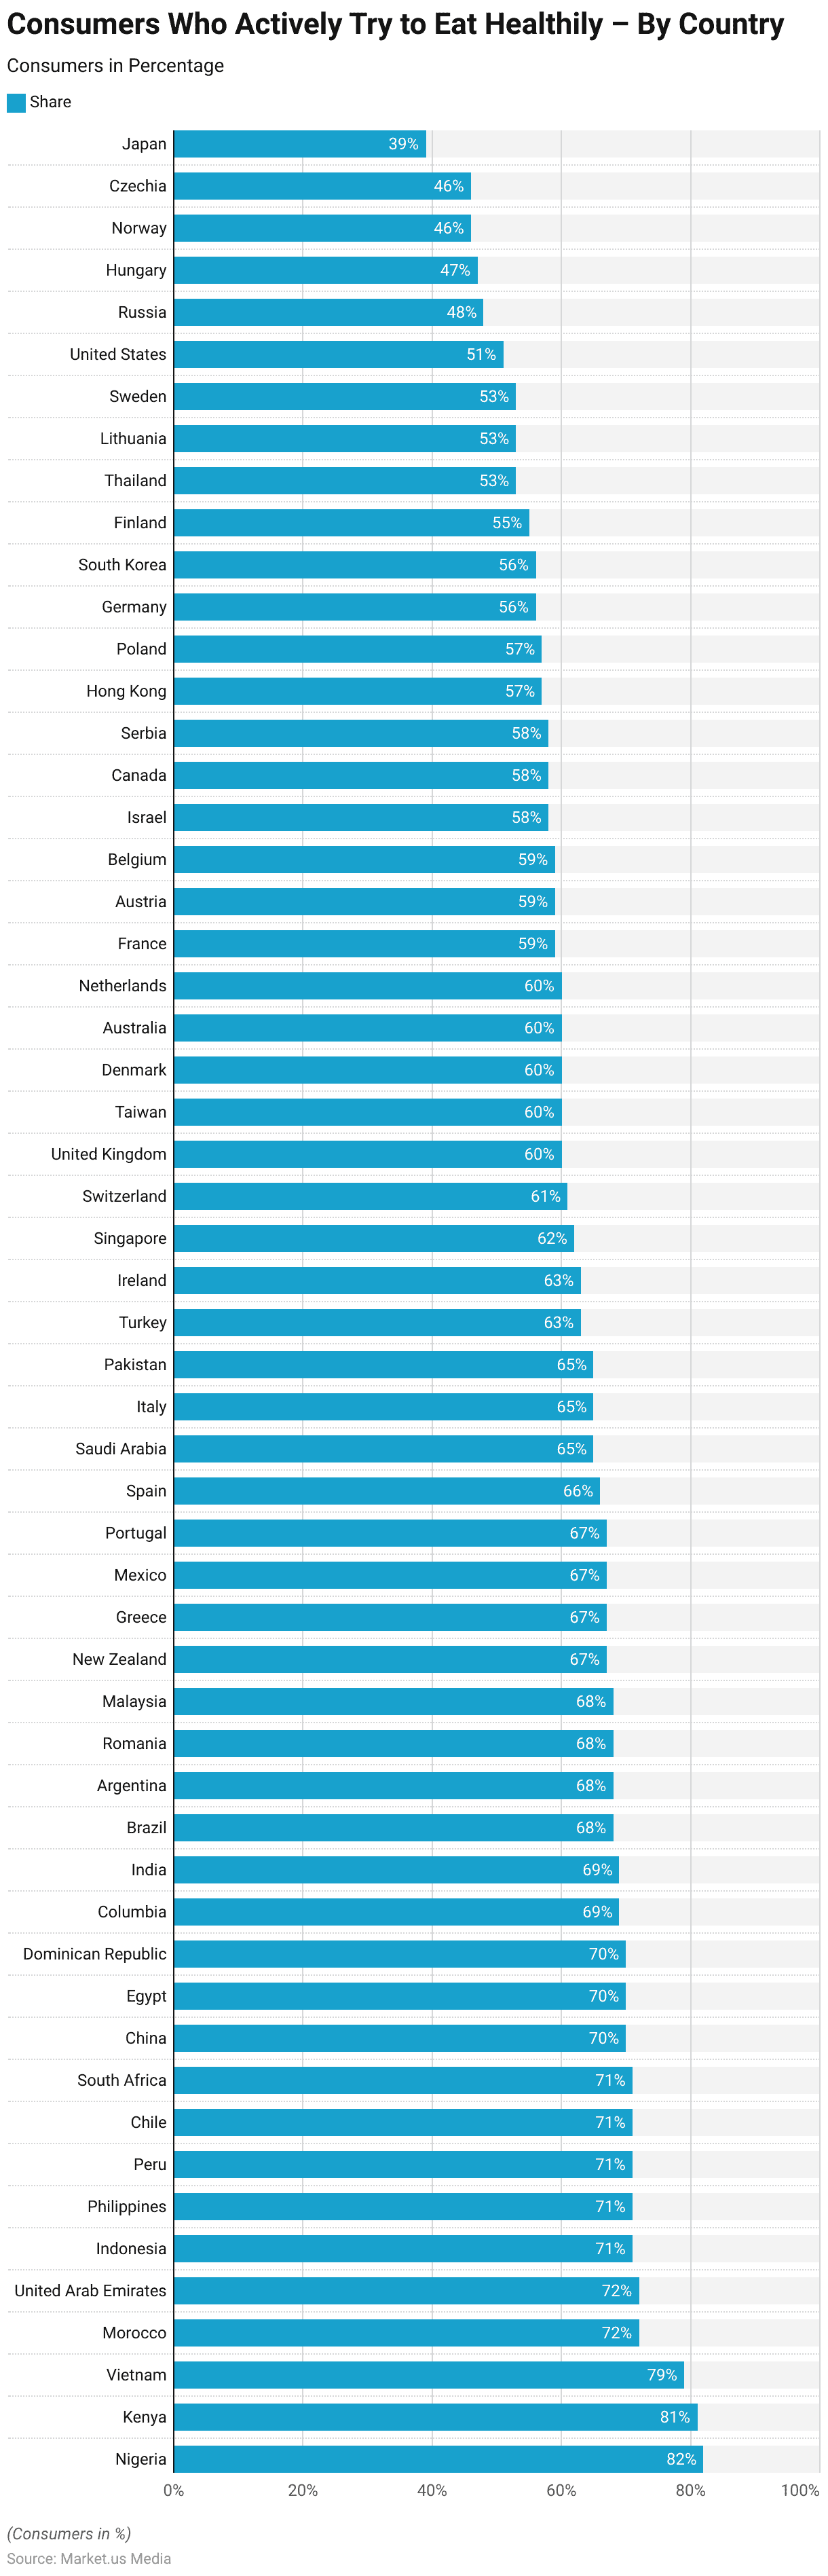
  • As of February 2024, the highest proportions of consumers trying to eat healthily were in Nigeria (82%) and Kenya (81%).
  • As of September 2024, 67% of respondents in India reported actively trying to eat healthy, reflecting a growing focus on health and sustainability.
  • As of April 2023, the Philippines had the highest share of consumers (85%) ordering fast food through delivery apps in Asia.
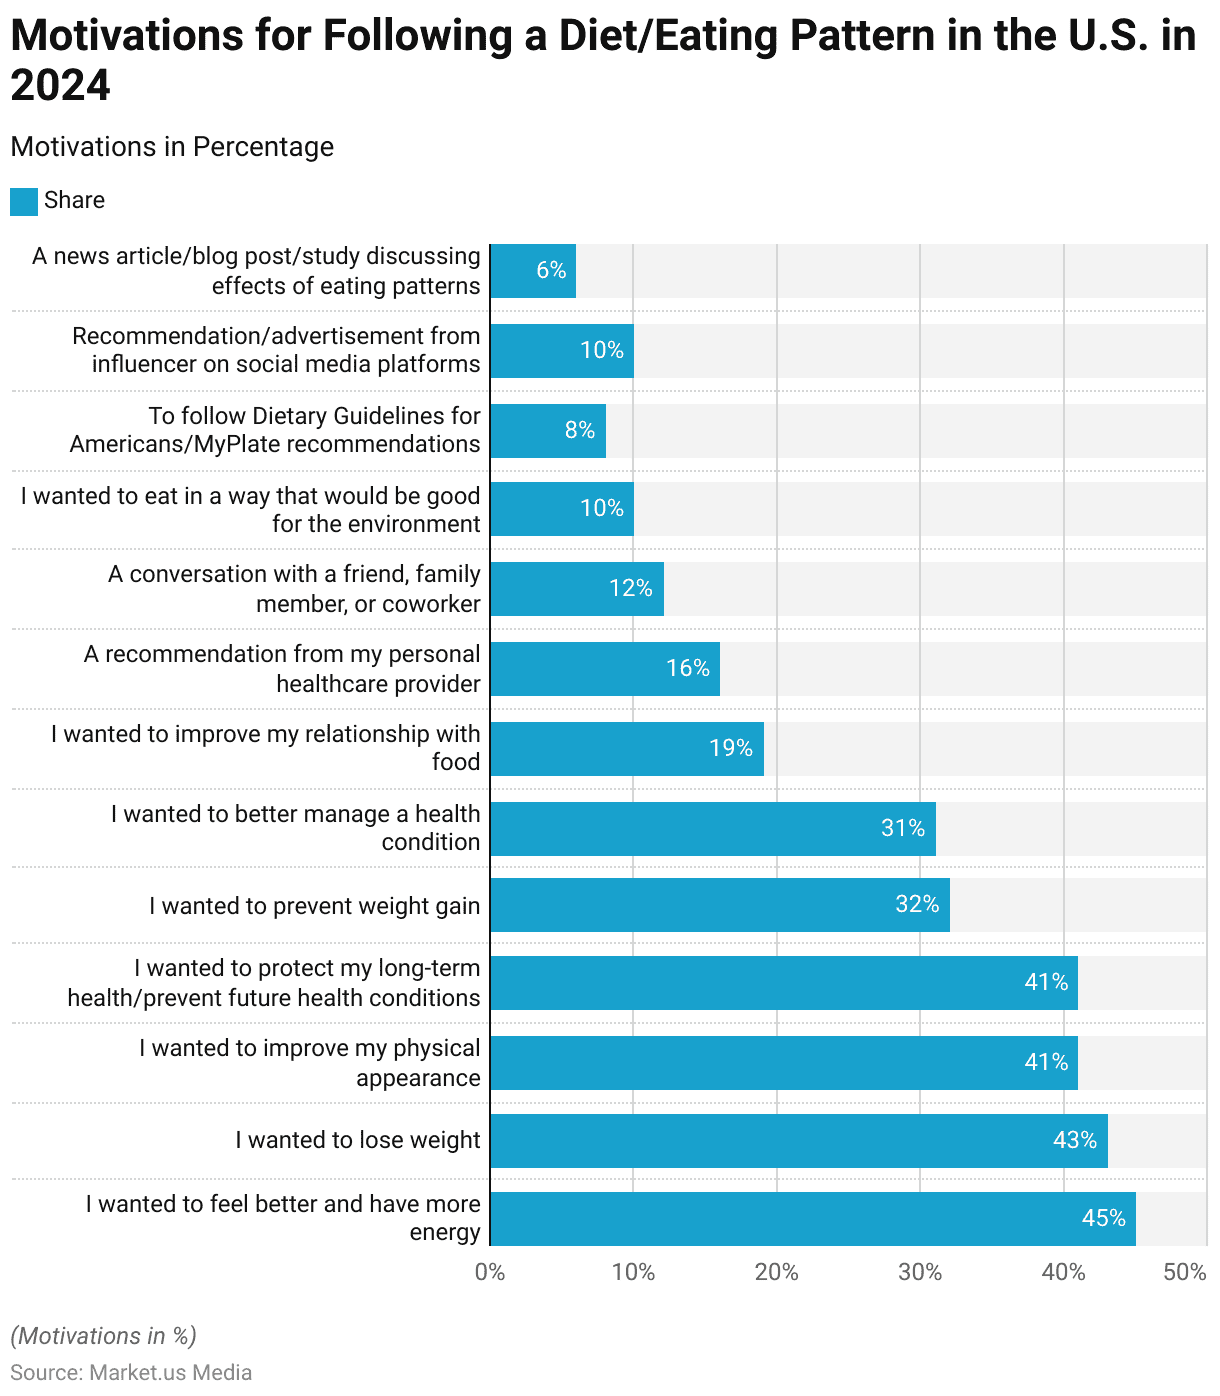
  • In the United States, 45% of respondents in 2024 followed a diet to feel better and have more energy, the most common motivation.
  • The National Institutes for Health (NIH) allocated nutritional funding to reach 2.231 billion dollars in 2023.

Functional and Natural Health Food Market Value Worldwide

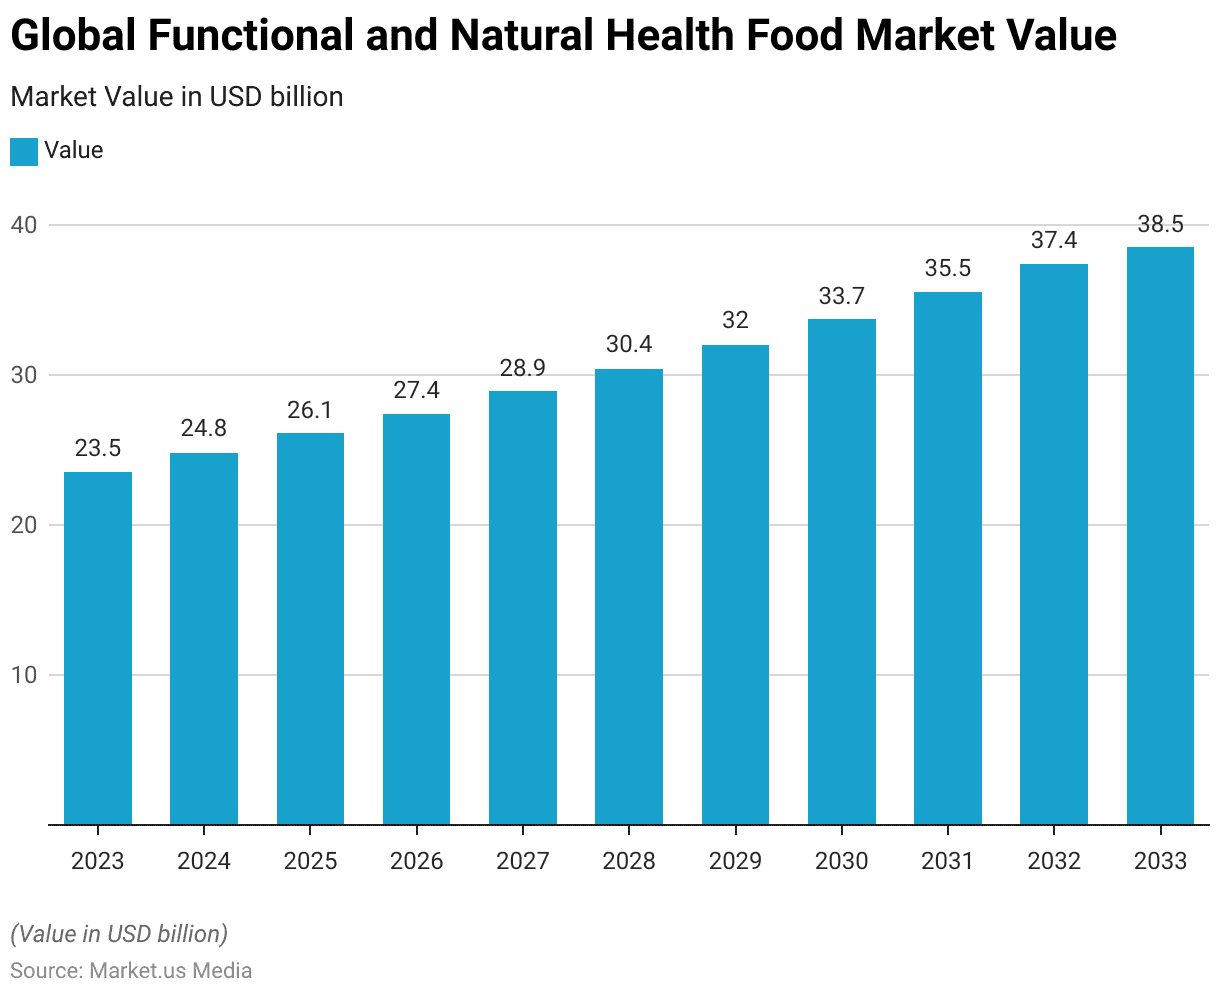
  • The global functional and natural health food market is projected to experience steady growth from 2023 to 2033.
  • In 2023, the market value is estimated at USD 23.5 billion and is expected to increase to USD 24.8 billion in 2024.
  • By 2025, the market is anticipated to reach USD 26.1 billion, followed by further growth to USD 27.4 billion in 2026.
  • The upward trend continues, with the market value advancing to USD 28.9 billion in 2027 and USD 30.4 billion in 2028.
  • The market is forecasted to expand to USD 32.0 billion by 2029, reaching USD 33.7 billion in 2030.
  • By 2031, the market value is projected to grow to USD 35.5 billion, and it is expected to reach USD 37.4 billion in 2032.
  • Finally, the global functional and natural health food market is estimated to achieve a value of USD 38.5 billion by 2033.
  • This consistent growth highlights the increasing consumer demand for health-conscious and natural food products.

(Source: Statista)

Health Conscious Consumer Statistics 2024 By Best Results

Healthy Snacks Market Value Worldwide

  • The global healthy snacks market has shown a consistent upward trajectory from 2021 to 2030.
  • In 2021, the market was valued at USD 85.6 billion and increased to USD 90.6 billion in 2022.
  • By 2023, the market reached USD 96.58 billion, and it is expected to grow further to USD 102.95 billion in 2024.
  • The market value is projected to rise to USD 109.75 billion in 2025 and USD 116.99 billion in 2026.
  • This growth continues, with the market reaching USD 124.71 billion in 2027 and USD 132.94 billion in 2028.
  • By 2029, the market is forecasted to achieve USD 141.72 billion, and it is expected to reach USD 152.5 billion by 2030.
  • This steady expansion reflects the increasing consumer demand for healthier snack options across the globe.

(Source: Statista)

Global Dietary Supplements Market Size

  • The global dietary supplements market has demonstrated significant growth from 2016 to 2028.
  • In 2016, the market size was valued at USD 135 billion and grew to USD 147 billion in 2017.
  • By 2018, the market reached USD 160 billion, continuing its upward trend to USD 175 billion in 2019.
  • In 2020, the market expanded further to USD 191 billion, followed by a rise to USD 205 billion in 2021.
  • The growth continued in 2022, with the market size reaching USD 220 billion, and it further increased to USD 235 billion in 2023.
  • In 2024, the market is expected to reach USD 250 billion, followed by a projected increase to USD 265 billion in 2025.
  • By 2026, the market size is forecasted to reach USD 280 billion, continuing its expansion to USD 295 billion in 2027.
  • Finally, the global dietary supplements market is expected to reach USD 308 billion by 2028, underscoring the increasing demand for health and wellness products.

(Source: Statista)

Global Wellness Market Statistics

Size of the Wellness Market Worldwide

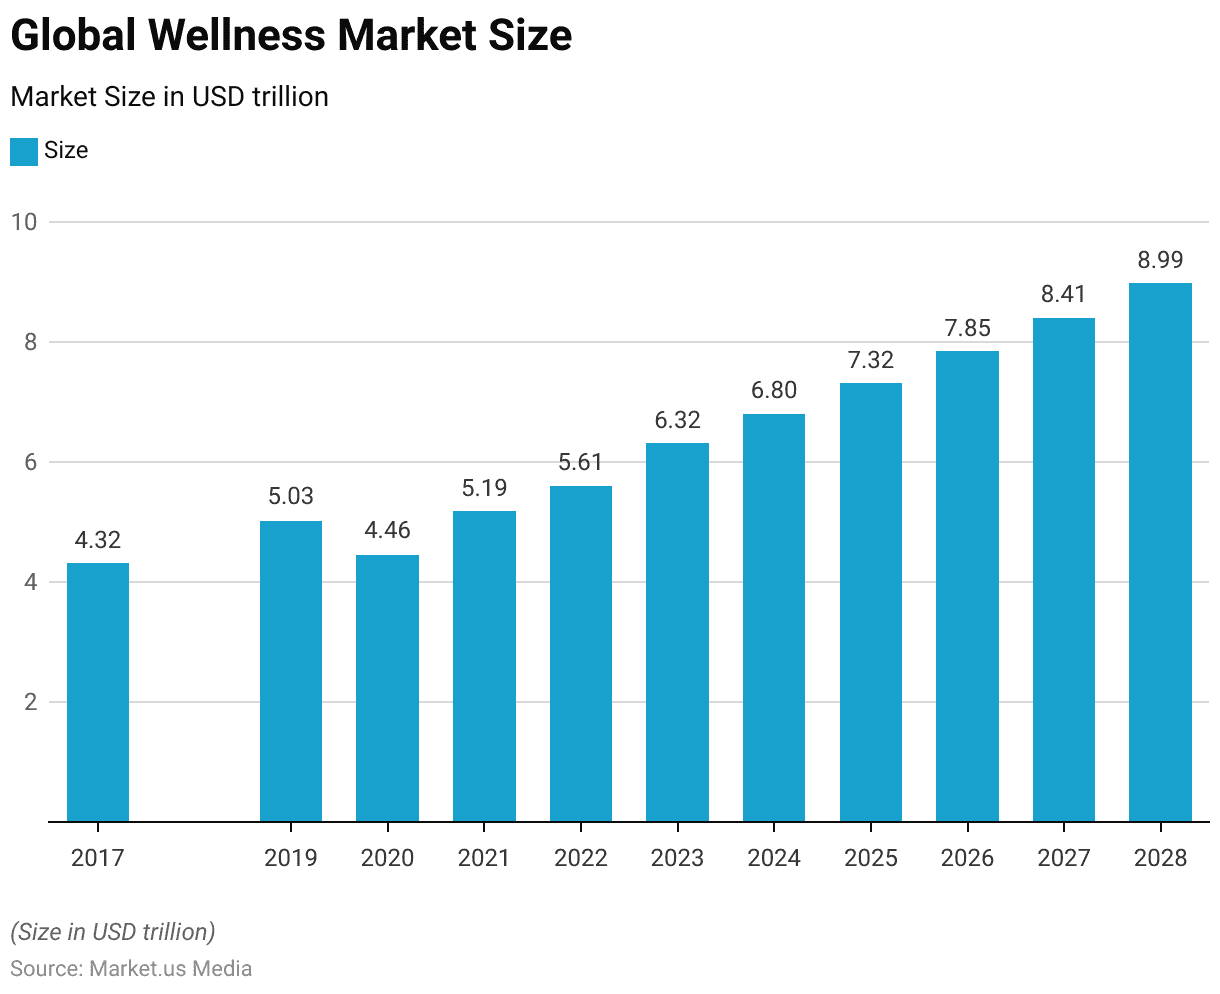
  • The global wellness market has experienced significant growth from 2017 to 2028.
  • In 2017, the market was valued at USD 4.32 trillion, and it increased to USD 5.03 trillion in 2019.
  • However, in 2020, the market size slightly decreased to USD 4.46 trillion due to the global impact of the pandemic.
  • The market rebounded in 2021, reaching USD 5.19 trillion, and continued its upward trajectory in 2022 with a value of USD 5.61 trillion.
  • By 2023, the market had grown to USD 6.32 trillion, with further expansion expected in the coming years.
  • In 2024, the market is forecasted to reach USD 6.8 trillion, followed by USD 7.32 trillion in 2025.
  • The growth continues with projections of USD 7.85 trillion in 2026, USD 8.41 trillion in 2027, and a forecasted value of USD 8.99 trillion by 2028.
  • This consistent expansion reflects the increasing global focus on health, well-being, and wellness-related products and services.

(Source: Statista)

Market Size of the Wellness Industry Worldwide – By Segment

  • In 2023, the global wellness industry was valued across several key segments.
  • The largest segment was personal care and beauty, with a market size of USD 1,213 billion, followed by health eating, nutrition, and weight loss at USD 1,096 billion.
  • The physical activity sector reached USD 1,060 billion, while wellness tourism was valued at USD 830 billion.
  • Public health prevention and personalized medicine contributed USD 781 billion to the market, and traditional and complementary medicine accounted for USD 553 billion.
  • Wellness real estate had a market size of USD 438 billion, with mental wellness at USD 233 billion.
  • The spa industry was valued at USD 137 billion, while springs contributed USD 63 billion.
  • Workplace wellness was the smallest segment, valued at USD 52 billion.
  • This distribution highlights the broad scope and diverse range of services driving the global wellness market in 2023.

(Source: Statista)

Global Digital Health Market Size

  • The global digital health market has experienced significant growth from 2019 to 2025.
  • In 2019, the market size was valued at USD 175 billion and grew to USD 216 billion in 2020.
  • By 2021, the market reached USD 268 billion, followed by a further increase to USD 334 billion in 2022.
  • The market continued its rapid expansion, reaching USD 417 billion in 2023.
  • It is projected to grow to USD 523 billion in 2024, with the market size expected to reach USD 657 billion by 2025.
  • This remarkable growth reflects the increasing integration of digital technologies in healthcare, driven by innovations in telemedicine, wearable devices, and health data management.

(Source: Statista)

Vitamins & Minerals Market Statistics

Revenue of the Vitamins & Minerals Market Worldwide

  • The global vitamins and minerals market has shown steady growth from 2020 to 2029.
  • In 2020, the market revenue was USD 23.56 billion and increased to USD 25.89 billion in 2021.
  • By 2022, the market reached USD 27.5 billion, followed by a rise to USD 29.7 billion in 2023.
  • The market continued to expand, with revenues projected to reach USD 31.93 billion in 2024 and USD 35.24 billion in 2025.
  • Growth persists through the following years, with the market expected to reach USD 36.7 billion in 2026 and USD 39.2 billion in 2027.
  • By 2028, the market is forecasted to grow to USD 41.69 billion, and it is projected to reach USD 44.18 billion by 2029.
  • This consistent increase underscores the rising demand for vitamins and minerals, driven by growing health awareness and a focus on preventive care.

(Source: Statista)

Revenue of the Vitamins & Minerals Market Worldwide – By Country

  • In 2023, the revenue from the vitamins and minerals market varied significantly across different countries.
  • China led with a revenue of USD 4,820.57 million, followed by the United States at USD 4,369.39 million.
  • India ranked third with USD 2,402.96 million, while Australia generated USD 1,302.10 million.
  • Brazil’s revenue stood at USD 1,175.49 million, and Japan’s market reached USD 1,024.59 million.
  • Canada earned USD 937.19 million, with Poland contributing USD 804.08 million.
  • The United Kingdom had a revenue of USD 723.66 million, and Indonesia followed with USD 677.32 million.
  • South Korea and the Philippines recorded revenues of USD 665.95 million and USD 515.86 million, respectively.
  • Russia’s market reached USD 512.94 million, while Germany earned USD 392.19 million.
  • Other countries such as Israel, Iran, and Mexico generated USD 360.52 million, USD 335.69 million, and USD 302.97 million, respectively.
  • Spain’s revenue was USD 295.16 million, with the Netherlands, France, Switzerland, Belgium, and Turkey earning between USD 191.68 million and USD 97.81 million.
  • Saudi Arabia and Sweden recorded much smaller revenues, at USD 49.08 million and USD 5.36 million, respectively.
  • This distribution reflects the varying levels of demand and consumption for vitamins and minerals across the globe.

(Source: Statista)

Global Sports and Active Nutrition Market Value

  • The global sports and active nutrition market has demonstrated steady growth from 2022 to 2027.
  • In 2022, the market was valued at USD 27.7 billion and increased to USD 29.4 billion in 2023.
  • By 2024, the market is projected to reach USD 31.1 billion, followed by further growth to USD 33 billion in 2025.
  • The expansion continues, with the market expected to reach USD 35 billion in 2026, and it is projected to reach USD 37.1 billion by 2027.
  • This growth reflects the rising consumer demand for products that support active lifestyles and athletic performance, driven by increasing health consciousness and fitness trends.

(Source: Statista)

Protein Intake Worldwide

  • From 2021 to 2026, protein intake is expected to grow at varying rates across different regions worldwide.
  • China and Hong Kong are projected to experience the highest growth, with an increase of 10.2%.
  • South Asia follows with a growth rate of 6.2%, while Sub-Saharan Africa is expected to see a 4.7% rise in protein intake.
  • Southeast Asia is projected to experience a more moderate growth of 2.6%, followed by North Africa at 0.9%.
  • The Middle East is expected to grow at a rate of 0.7%, and Latin America at 0.5%.
  • Mexico is forecasted to have a minimal growth of 0.2%. At the same time, Japan and Korea, along with Australia and New Zealand, are expected to see no growth in protein intake during this period.
  • These regional variations reflect diverse dietary habits, economic factors, and health trends driving protein consumption worldwide.

(Source: Statista)

Consumers’ Definitions of Healthy Food

  • In 2024, consumers in the United States defined healthy food in various ways, with the most common responses reflecting a preference for fresh and nutritious options.
  • A significant 39% of respondents considered fresh food to be healthy, while 37% identified foods that are a good source of protein and low in sugar as key characteristics of healthy eating.
  • Additionally, 32% considered foods that are rich in nutrients like potassium and Vitamin D as healthy.
  • Other notable responses included foods containing fruits or vegetables (27%) and those that are low in sodium (25%).
  • Around 26% viewed natural foods as healthy, and 25% emphasized the importance of foods with minimal artificial ingredients or preservatives.
  • Foods that are minimally processed (25%) and high in fiber (24%) were also important to many consumers.
  • Lower total fat content (20%) and the presence of healthy fats (20%) were cited by a similar proportion of respondents.
  • Organic foods (19%) and those with whole grains (19%) were considered healthy by many, while 18% highlighted the importance of foods that are low in saturated fat.
  • Other factors like low-calorie content (17%), non-GMO (16%), low carbohydrate (14%), and a limited number of ingredients (13%) also contributed to the definition of healthy food.
  • Lastly, only 5% of respondents emphasized environmental sustainability in food production as a key factor in defining healthy food.

(Source: Statista)

Health Conscious Consumer Statistics

Consumers Who Actively Try to Eat Healthily – By Country

  • As of February 2024, the share of consumers who actively try to eat healthily varies significantly across countries and territories worldwide.
  • The highest proportions were seen in Nigeria (82%) and Kenya (81%), followed closely by Vietnam at 79%.
  • Several countries, such as Morocco, the United Arab Emirates, Indonesia, the Philippines, Peru, and Chile, each reported 71%, while South Africa was at 71%.
  • Other notable countries include China and Egypt, both at 70%, with the Dominican Republic also at 70%.
  • In South America, Colombia, India, Brazil, and Argentina, around 69% of consumers are trying to eat healthily. Similarly, Romania, Malaysia, and New Zealand recorded 68%.
  • In European countries such as Greece, Mexico, Portugal, Spain, Saudi Arabia, and Italy, around 67% of consumers focused on healthy eating.
  • Other countries with strong healthy eating trends include Pakistan (65%), Turkey (63%), Ireland (63%), and Singapore (62%).
  • In developed markets, Switzerland, the United Kingdom, Taiwan, Denmark, Australia, and the Netherlands all reported 60%, with France, Austria, and Belgium at 59%.
  • Israel and Canada showed 58%, while Serbia and Hong Kong were at 58% as well.
  • Other countries like Poland and Germany reported around 57%, with South Korea at 56%. In the Nordic and Baltic regions, Finland, Thailand, Lithuania, and Sweden reported 53%.
  • The lowest shares of consumers trying to eat healthily were observed in the United States (51%), Russia (48%), Hungary (47%), Norway (46%), and Czechia (46%), with Japan showing the lowest at 39%.
  • This data reflects varying levels of health-conscious eating habits across different regions and cultures globally.

(Source: Statista)

Health Conscious Consumer Statistics

Demographics of Consumers That Actively Try to Eat Healthy

Health Conscious Consumer Statistics By Age Group

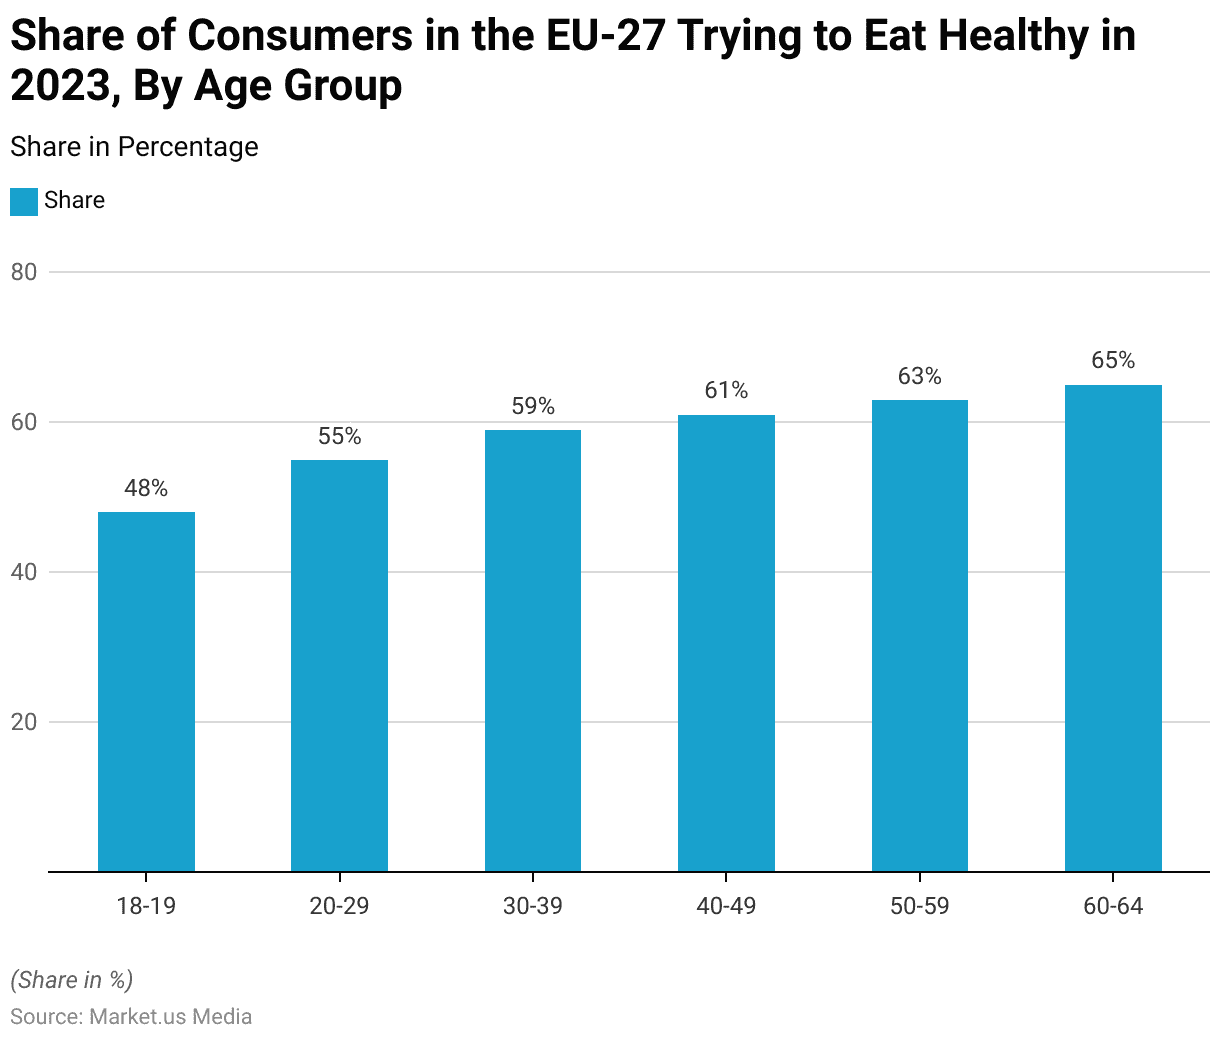
  • In 2023, the share of consumers in the European Union (EU-27) who actively try to eat healthily varied across different age groups.
  • Among respondents aged 18-19, 48% reported actively trying to eat healthy.
  • This share increased with age, with 55% of consumers in the 20-29 age group and 59% in the 30-39 group.
  • The trend continued upward, with 61% of those aged 40-49, 63% of individuals aged 50-59, and 65% of those in the 60-64 age group actively making efforts to eat healthily.
  • This data indicates that older consumers are more likely to focus on healthy eating compared to younger age groups within the EU.

(Source: Statista)

Health Conscious Consumer Statistics By Generation

  • In 2023/24, the share of consumers in the United Kingdom who actively try to eat healthy varied across different generations.
  • Among Generation Z, 58% of respondents reported actively making efforts to eat healthily, while 59% of Millennials shared the same intention.
  • Generation X showed a slightly higher proportion, with 60% trying to eat healthy.
  • Baby boomers had the highest percentage, with 63% of respondents actively focusing on healthy eating.
  • This data reveals that the inclination to maintain a healthy diet increases with age in the UK, with older generations being more likely to prioritize healthy eating.

(Source: Statista)

Attitudes Towards Food in Various Countries

Health Conscious Consumer Statistics in India

  • As of September 2024, attitudes towards food in India reflect a growing focus on health and sustainability.
  • A significant 67% of respondents reported actively trying to eat healthy, while 48% expressed a preference for avoiding plastic packaging when purchasing food.
  • Additionally, 46% of consumers stated they avoid artificial flavors and preservatives, and 44% emphasized the importance of convenience and fast food options.
  • There was also a notable inclination towards reducing meat consumption, with 29% of respondents indicating they try to eat less meat.
  • Cultured meat, or lab-grown meat, had a smaller but still significant appeal, with 20% of consumers expressing openness to it.
  • Food intolerances were reported by 18% of respondents, and 16% mentioned that they do not enjoy cooking.
  • Financial concerns related to healthy eating were acknowledged by 12% of consumers, stating they couldn’t afford to eat healthily.
  • Only 3% of respondents indicated they did not relate to any of the listed food-related attitudes.
  • These responses highlight the evolving food culture in India, with increasing attention to health, sustainability, and convenience.

(Source: Statista)

Health Conscious Consumer Statistics in United States

  • As of September 2024, attitudes towards food in the United States reveal a mix of health-consciousness and convenience.
  • Half of the respondents (50%) reported actively trying to eat healthy, while 30% emphasized the importance of food being convenient and fast.
  • A significant 24% of consumers stated they avoid artificial flavors and preservatives, and 21% try to eat less meat.
  • Financial concerns were noted by 19% of respondents, who said they can’t afford to eat healthily, while 17% expressed a lack of interest in cooking.
  • Another 17% reported food intolerances, and 15% indicated they try to avoid plastic packaging when buying food.
  • Lab-grown or cultured meat was met with a degree of openness, with 13% of respondents willing to consider it.
  • Finally, 12% of participants identified with none of the listed attitudes towards food.
  • These findings reflect the ongoing shift in U.S. food attitudes, balancing health, convenience, and environmental considerations.

(Source: Statista)

Health Conscious Consumer Statistics in Australia

  • As of September 2024, attitudes towards food in Australia reflect a strong emphasis on health and sustainability.
  • A majority of respondents (59%) reported actively trying to eat healthily, while 32% expressed a preference for avoiding artificial flavors and preservatives.
  • Additionally, 29% of Australians stated they try to avoid plastic packaging when purchasing food, and 28% emphasized the need for food to be convenient and fast.
  • There was also a significant proportion (21%) who try to eat less meat, while 19% indicated that they do not enjoy cooking.
  • Food intolerances were reported by 17% of respondents, and 14% mentioned financial barriers, stating they cannot afford to eat healthily.
  • The idea of lab-grown or cultured meat was met with some openness, as 14% of consumers expressed interest in it.
  • Lastly, 7% of respondents identified with none of the listed attitudes towards food.
  • These findings highlight Australia’s growing concern for healthy eating, sustainability, and the convenience of food choices.

(Source: Statista)

Health Conscious Consumer Statistics in France

  • As of September 2024, attitudes towards food in France reveal a growing focus on health and sustainability.
  • A majority of respondents (58%) reported actively trying to eat healthy, while 36% stated they try to eat less meat, and 35% avoided artificial flavors and preservatives.
  • Additionally, 30% emphasized the need for food to be convenient and fast, with the same proportion (30%) also trying to avoid plastic packaging when purchasing food.
  • Financial constraints were mentioned by 16% of respondents, who indicated they could not afford to eat healthily, and 16% expressed a lack of interest in cooking.
  • Openness to lab-grown or cultured meat was relatively low, with only 10% of consumers willing to consider it.
  • Food intolerances were also reported by 10% of respondents and 7% of participants identified with none of the listed attitudes.
  • These insights illustrate the evolving food culture in France, balancing health-conscious choices with concerns about sustainability and convenience.

(Source: Statista)

Health Conscious Consumer Statistics in Canada

  • As of September 2024, attitudes towards food in Canada highlight a strong focus on health and convenience.
  • A majority of respondents (60%) reported actively trying to eat healthily, while 32% avoided artificial flavors and preservatives.
  • Additionally, 31% emphasized the importance of food being convenient and fast, and 24% expressed a preference for avoiding plastic packaging when purchasing food.
  • There is also a desire to reduce meat consumption, with 24% of respondents trying to eat less meat.
  • Financial concerns were noted by 17% of participants, who said they could not afford to eat healthily, while 19% admitted to not enjoying cooking.
  • Food intolerances were reported by 16% of respondents, and 13% expressed openness to eating lab-grown or cultured meat.
  • Finally, 7% of respondents identified with none of the listed attitudes.
  • These findings reflect a growing commitment to healthy eating in Canada, alongside concerns about convenience, sustainability, and affordability.

(Source: Statista)

Health Conscious Consumer Statistics in Spain

  • As of September 2024, attitudes towards food in Spain reveal a significant commitment to health and sustainability.
  • A majority of respondents (61%) reported actively trying to eat healthily, while 38% avoided artificial flavors and preservatives.
  • Additionally, 31% expressed a preference for avoiding plastic packaging when purchasing food, and 28% stated they try to eat less meat.
  • The desire for convenience in food was mentioned by 21% of participants, while 16% admitted to not enjoying cooking.
  • Food intolerances were reported by 13% of respondents, and 12% expressed openness to eating lab-grown or cultured meat.
  • Financial constraints were less of an issue, with only 7% indicating they could not afford to eat healthily, and 7% of respondents identified with none of the listed attitudes.
  • These findings highlight a strong focus on health-conscious eating and sustainability, with a growing awareness of food choices in Spain.

(Source: Statista)

Health Conscious Consumer Statistics in the Netherlands

  • As of September 2024, consumer attitudes towards food in the Netherlands reflect a strong focus on health and convenience.
  • A majority of respondents (59%) actively try to eat healthy, while 37% prioritize food that is convenient and fast.
  • Additionally, 33% aim to eat less meat and 25% make an effort to avoid plastic packaging when purchasing food.
  • A smaller proportion, 22%, avoid artificial flavors and preservatives, while 17% do not enjoy cooking.
  • Lab-grown or cultured meat is a possibility for 16% of respondents, and 11% report having one or more food intolerances.
  • Financial constraints seem to be less of a concern, as only 10% indicate they can’t afford to eat healthily.
  • These findings suggest that while health-conscious eating and sustainability are important to many Dutch consumers, convenience remains a key factor in their food choices.

(Source: Statista)

Healthy Eating at Restaurants

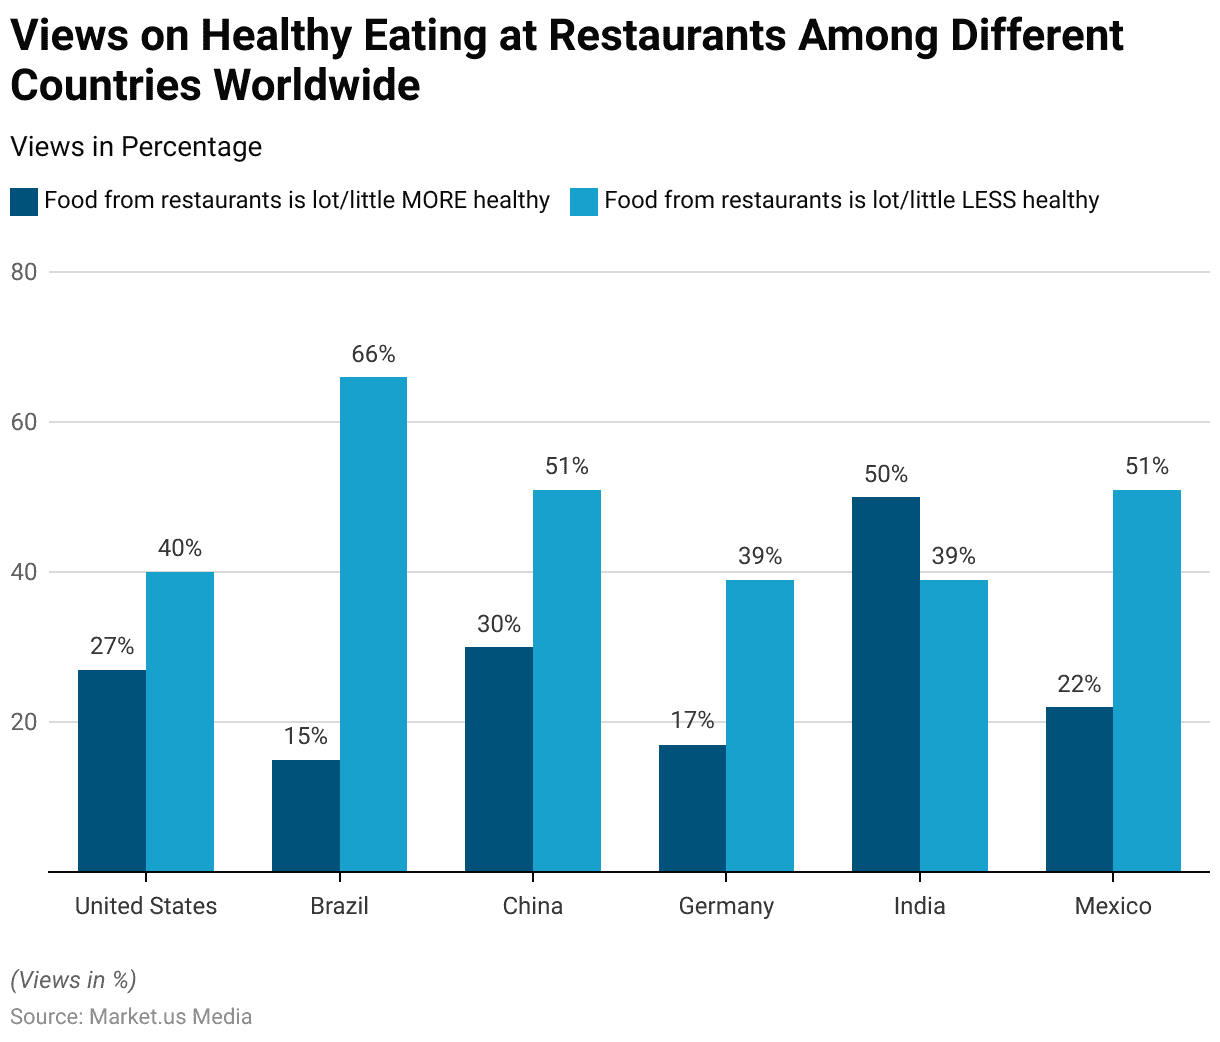
Views on Healthy Eating at Restaurants in Different Countries Worldwide

  • In 2021, consumer views on the healthiness of food from restaurants varied across selected countries.
  • In the United States, 27% of respondents believed that restaurant food is a lot or a little healthier than other food options, while 40% felt it is a lot or a little less healthy.
  • In Brazil, 66% of respondents considered restaurant food to be less healthy, with only 15% viewing it as healthier.
  • In China, 30% saw restaurant food as healthier, but 51% viewed it as less healthy.
  • Germany exhibited similar trends, with 39% believing restaurant food is less healthy, while only 17% thought it was healthier.
  • In India, half of the respondents (50%) felt that restaurant food was healthier, while 39% considered it less healthy.
  • In Mexico, 22% believed restaurant food was healthier, and 51% thought it was less healthy.
  • These responses indicate regional variations, with some countries perceiving restaurant food as a less healthy choice, while others view it more favorably in terms of health.

(Source: Statista)

Health Conscious Consumer Statistics

Generations Most Likely to Choose Healthy Restaurants

  • As of December 2020, U.S. generations displayed different preferences for choosing restaurants based on healthy menu options. Among those who planned to eat on-premises,
  • Baby Boomers (ages 56-74) were the most likely to choose such restaurants, with 45% expressing this preference.
  • Gen Z adults (ages 18-23) and Millennials (ages 24-39) followed closely, with 36% each planning to dine at restaurants with healthy menu options.
  • Gen X (ages 40-45) had a slightly lower inclination, with 30% choosing restaurants for their healthy offerings.
  • Regarding takeout or delivery, Gen Z adults were again the most likely to order from restaurants with healthy menus at 44%, followed by Baby Boomers at 39%.
  • Millennials and Gen X showed less interest in takeout from healthy restaurants, at 29% and 31%, respectively.
  • Overall, 38% of all customers in the U.S. planned to dine at restaurants offering healthy options on-site, while 33% intended to order takeout or delivery.

(Source: Statista)

Fast Food Preferences

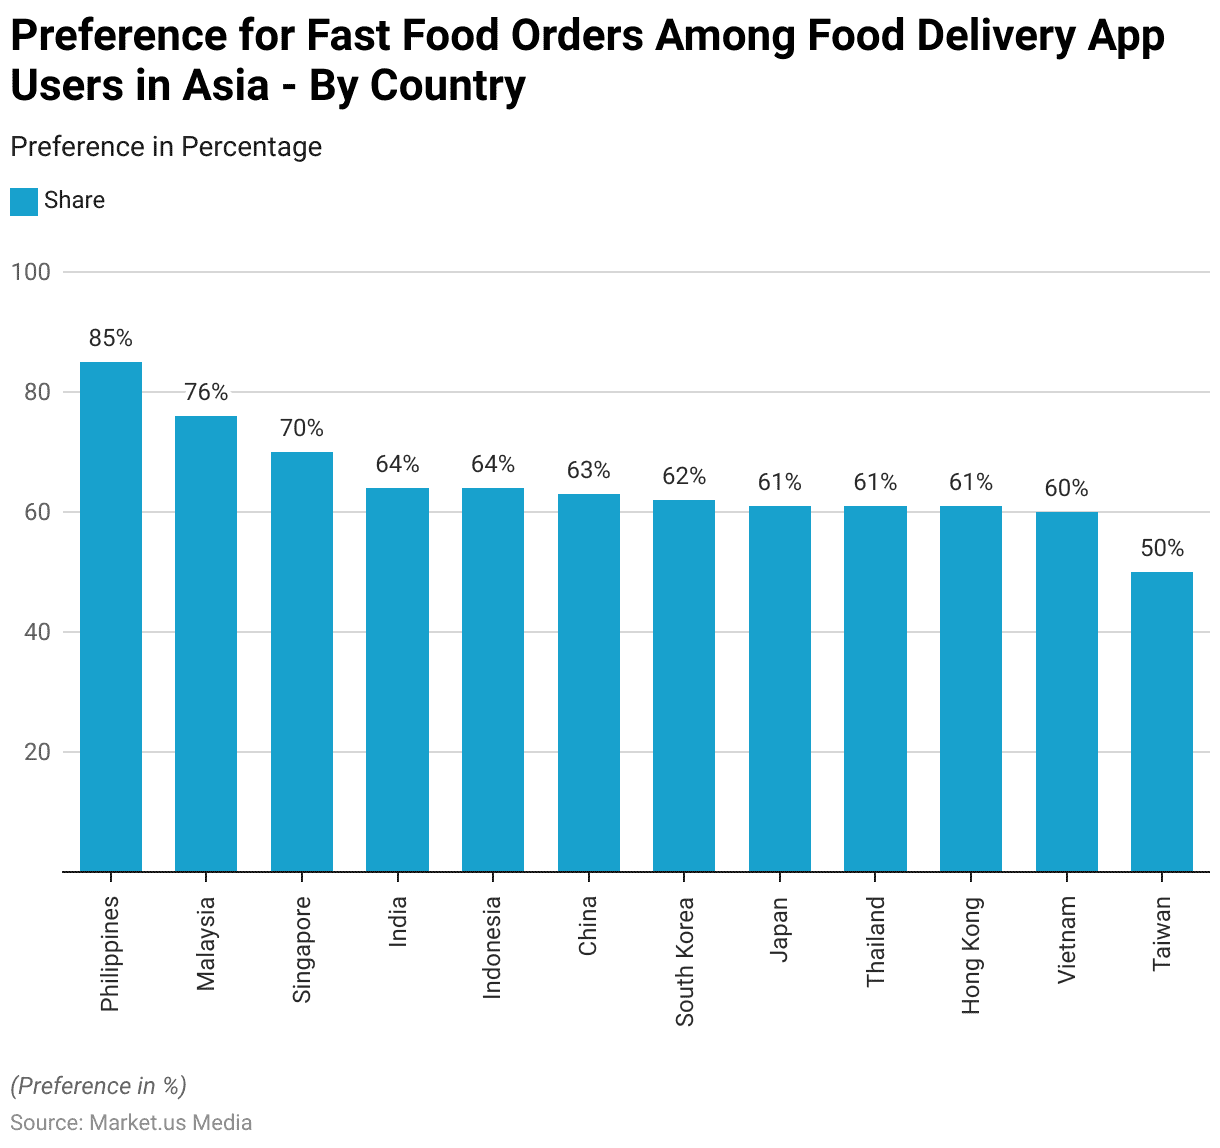
Preference for Fast Food Orders Among Food Delivery App Users

  • As of April 2023, the share of consumers in Asia who typically order fast food through food delivery apps varied by country.
  • The Philippines had the highest proportion, with 85% of consumers using delivery apps for fast food.
  • Malaysia followed with 76%, while Singapore recorded 70%.
  • In India and Indonesia, 64% of consumers commonly ordered fast food through such apps.
  • China had a similar trend, with 63% of consumers engaging in this behavior, followed closely by South Korea (62%) and Japan (61%).
  • Thailand, Hong Kong, and Vietnam also showed notable figures, with 61% of consumers ordering fast food, while Taiwan had the lowest share at 50%.

(Source: Statista)

Frequency of Ordering from Quick Service Restaurants – By Restaurant Type

  • As of the first quarter of 2023, the frequency of ordering from quick-service restaurants (QSRs) in the United States varied by restaurant type.
  • Coffee and snacks had the highest percentage of consumers ordering more than once a week, at 38%, followed by Tex-Mex (32%) and sandwiches (26%).
  • For once-a-week orders, burgers led with 29%, closely followed by chicken (28%) and pizza (28%).
  • Orders occurring once every couple of weeks were most common for pizza (31%) and burgers (29%), with chicken (24%) and sandwiches (26%) also showing strong figures.
  • For once-a-month orders, chicken (27%) and pizza (31%) were the top choices, while coffee and snacks (15%) and sandwiches (18%) had lower shares in this category.

(Source: Statista)

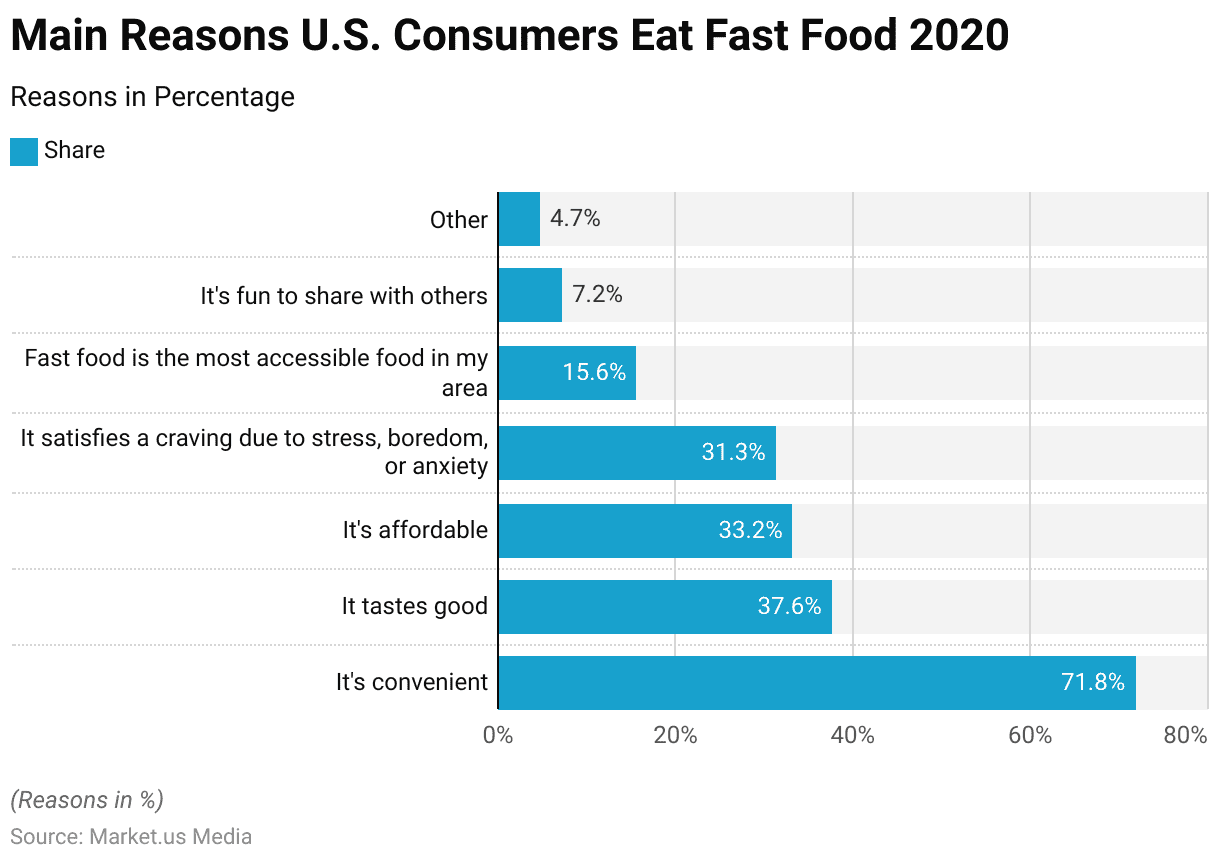
Leading Reasons Consumers Eat Fast Food

  • As of November 2020, the leading reasons consumers in the United States eat fast food were primarily driven by convenience, with 71.8% of respondents citing it as a key factor.
  • Taste was the second most significant reason, mentioned by 37.6% of consumers, while affordability was important for 33.2%.
  • Additionally, 31.3% of respondents indicated that they turn to fast food to satisfy cravings stemming from stress, boredom, or anxiety.
  • Access to fast food was a key factor for 15.6% of respondents, as it was considered the most accessible food in their area.
  • Sharing fast food with others was noted by 7.2%, while 4.7% gave other reasons for their fast food consumption.

(Source: Statista)

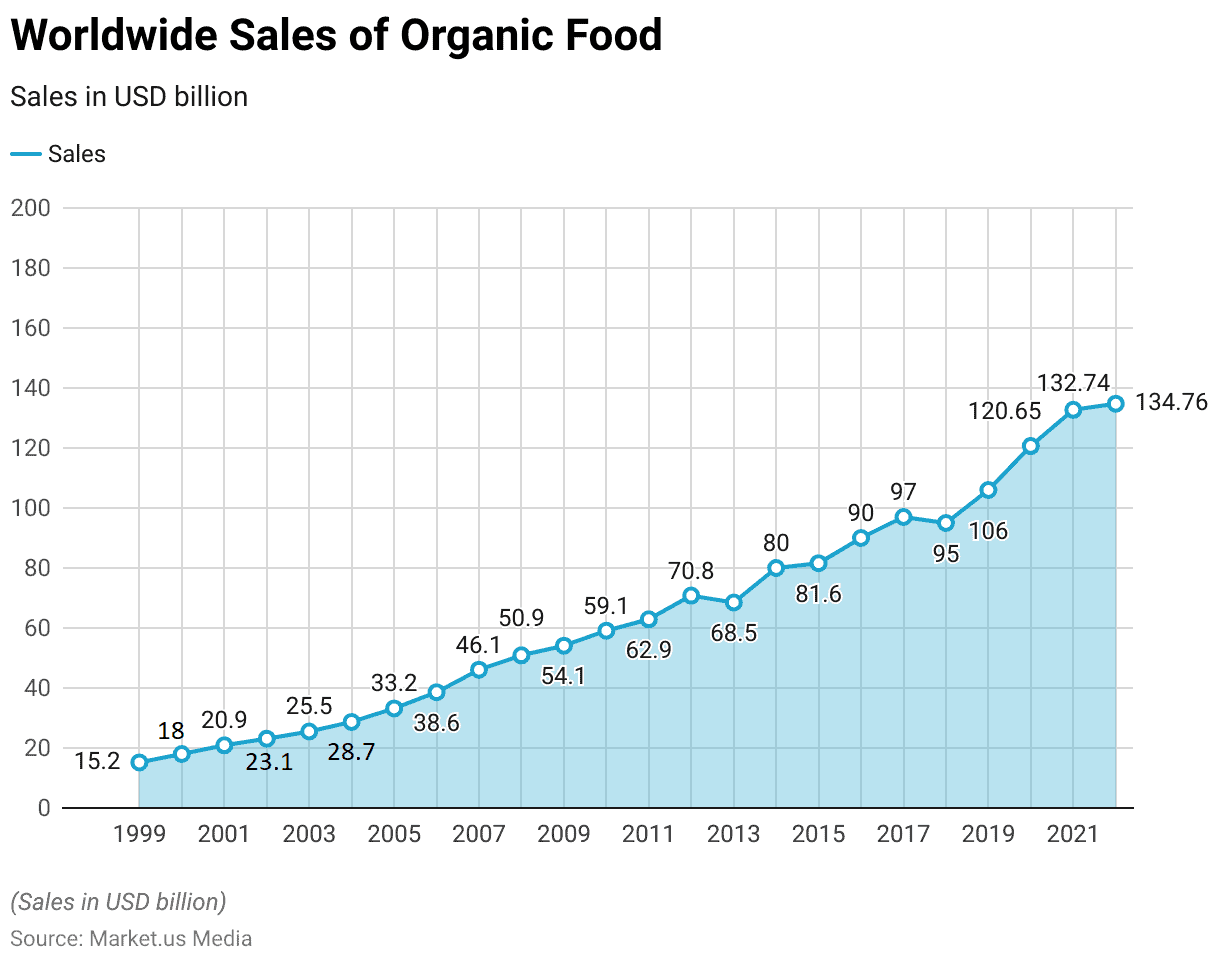
Worldwide Sales of Organic Food

  • The global sales of organic food have witnessed substantial growth from 1999 to 2022.
  • In 1999, the market was valued at approximately USD 15.2 billion, and this figure steadily increased year on year.
  • By 2000, sales had risen to USD 18 billion, and by 2005, it reached USD 33.2 billion.
  • The upward trajectory continued, with sales surpassing USD 50 billion in 2008 and USD 60 billion by 2010.
  • The market’s growth accelerated further, reaching USD 80 billion in 2014 and USD 90 billion by 2016.
  • In 2019, global sales crossed USD 100 billion, reaching USD 106 billion.
  • The trend continued into the 2020s, with the market reaching USD 120.65 billion in 2020 and USD 132.74 billion in 2021.
  • By 2022, worldwide organic food sales had peaked at USD 134.76 billion.
  • This steady increase reflects the growing consumer demand for organic products over the past two decades.

(Source: Statista)

Health Conscious Consumer Statistics

Healthy Food Purchase Preferences

Purchase Location of Healthy Food and Drink Products

  • In 2015, the majority of consumers in Europe purchased healthy food and drink products from supermarkets, with 82% of respondents indicating this as their primary purchase location.
  • Grocery stores followed with 43%, while 17% reported buying from health food stores.
  • Additionally, 16% of consumers made their purchases through online marketplaces, and 15% bought from regional farms or local sources.
  • Drug stores accounted for 7% of the purchases.

(Source: Statista)

Reasons for Sustainable and Health Frozen Food Purchases

  • In the United States, the reasons for purchasing sustainable and healthy frozen foods remained relatively consistent between October 2022 and October 2023.
  • The most common claim driving purchases was “all natural/organic,” which accounted for 11.4% of respondents in October 2022 and slightly decreased to 11% in October 2023.
  • The claim of “non-GMO ingredients” was cited by 7.4% of consumers in October 2022, falling to 6.4% the following year.
  • “Gluten-free” products saw a decrease from 5.3% in October 2022 to 4.2% in October 2023.
  • Consumers also considered the environmental responsibility of brands, with 3.6% of respondents in October 2022 and 3.3% in October 2023 citing this factor.
  • Interestingly, the percentage of respondents who valued a “socially responsible brand” increased from 2.3% in October 2022 to 3.3% in October 2023.

(Source: Statista)

Health Functional Food Shopping Frequency Per Year

  • In South Korea, the annual frequency of healthy functional food purchases varied among consumers as of July 2022.
  • A significant portion of respondents, 42.6%, reported purchasing healthy, functional foods 3 to 4 times a year.
  • This was followed by 23.8% who bought them 5 to 6 times annually.
  • A smaller group, 16.9%, made such purchases 1 to 2 times per year.
  • Additionally, 8.3% of respondents purchased healthy functional foods 7 to 8 times annually, while 5.1% bought them 11 times a year.
  • Fewer consumers, 3.4%, reported purchasing them 9 to 10 times per year.

(Source: Statista)

Frequency of Health Functional Food Purchases

  • As of February 2023, the frequency of healthy functional food purchases in South Korea varied among consumers.
  • Approximately 10% of respondents purchased such products once a month or more.
  • A larger share, 24%, bought them once every two months, while 36% made their purchases once every three months.
  • Additionally, 23% of respondents bought healthy, functional foods once every six months, and 6% purchased them once a year.
  • Only 2% reported purchasing these products less than once a year.

(Source: Statista)

Healthy Food Shopping Frequency Among Consumers – By Education

  • In the United States, in 2018, the frequency of looking for healthy food options while shopping varied according to education level.
  • Among respondents with less than a college education, 35% reported actively seeking healthy options.
  • This number increased to 47% for those with a college degree and further rose to 54% among individuals with a graduate education.

(Source: Statista)

Adoption of Dieting

Motivations for Following a Diet or an Eating Pattern

  • In the United States, the motivations for following a diet or eating pattern in 2024 were driven by a range of health and personal goals.
  • The most common reason, cited by 45% of respondents, was the desire to feel better and have more energy.
  • This was closely followed by the aim to lose weight, with 43% of respondents indicating this as a key motivation.
  • Additionally, 41% of individuals sought to improve their physical appearance or protect their long-term health and prevent future health conditions.
  • A further 32% followed diets to prevent weight gain, while 31% aimed to manage a health condition better.
  • Some respondents were motivated by emotional factors, with 19% wanting to improve their relationship with food.
  • Recommendations from personal healthcare providers influenced 16% of respondents, and conversations inspired 12% with friends, family, or co-workers.
  • Environmental considerations also played a role, with 10% of people seeking diets that they felt were good for the environment.
  • Following official guidelines, such as the Dietary Guidelines for Americans or MyPlate recommendations, was a motivation for 8%, while recommendations from social media influencers influenced 10%.
  • Finally, 6% of respondents were motivated by news articles, blog posts, or studies discussing the effects of eating patterns.

(Source: Statista)

Factors that Encourage Consumer Adoption of Vegan or Vegetarian Diets

  • In the United Kingdom in 2023, various factors encouraged consumers to adopt a vegan or vegetarian diet, with some differences between male and female respondents.
  • Among females, 24% were motivated by general health reasons, while environmental concerns drove 19%, and 24% were influenced by concerns over animal welfare.
  • Additionally, 19% of female respondents cited worries about health risks related to meat or fish production, such as bacterial infections or food poisoning, as a motivating factor.
  • Another 19% wanted to eat more cheaply, while 17% were concerned about the healthiness of processed meat products.
  • On the other hand, 8% of female respondents indicated that they were already vegan or vegetarian, and 5% mentioned other reasons for considering the diet.
  • Among male respondents, the motivations were somewhat similar, with 19% citing general health reasons and 18% concerned about environmental factors.
  • Male respondents were also less likely than females to be motivated by concerns over animal welfare (17% vs. 24%) or health risks related to meat production (16% vs. 19%).
  • A similar proportion of males (16%) were motivated by the desire to eat more cheaply, and 14% were concerned about the healthiness of processed meat products.
  • Just 7% of male respondents were already vegan or vegetarian, and 7% cited other reasons.
  • Lastly, 6% of female respondents and 4% of male respondents were concerned about the accuracy of meat and fish labeling.

(Source: Statista)

Adoption Level of Restrictive Diet

  • In Chile, as of August 2017, various restrictive diets were adopted to differing extents.
  • The low-sugar diet had the highest adoption rate, with 52% of respondents following it sometimes and 35% adhering to it always.
  • A significant proportion of respondents also adopted a low-fat diet, with 60% following it sometimes and 24% always.
  • The low sodium diet had a similar adoption pattern, with 49% of respondents sometimes following it and 24% always doing so.
  • Less commonly, 25% of individuals followed a lactose-free diet sometimes, and 13% always, while 23% replaced traditional dairy products with vegetable milk (such as soy) sometimes, with only 7% doing so always.
  • The gluten-free diet had a lower adoption rate, with 24% following it sometimes and just 3% always, while the vegetarian diet was the least adopted, with 37% occasionally following it and only 3% adhering to it always.

(Source: Statista)

Interest in Healthy Eating and Lifestyle

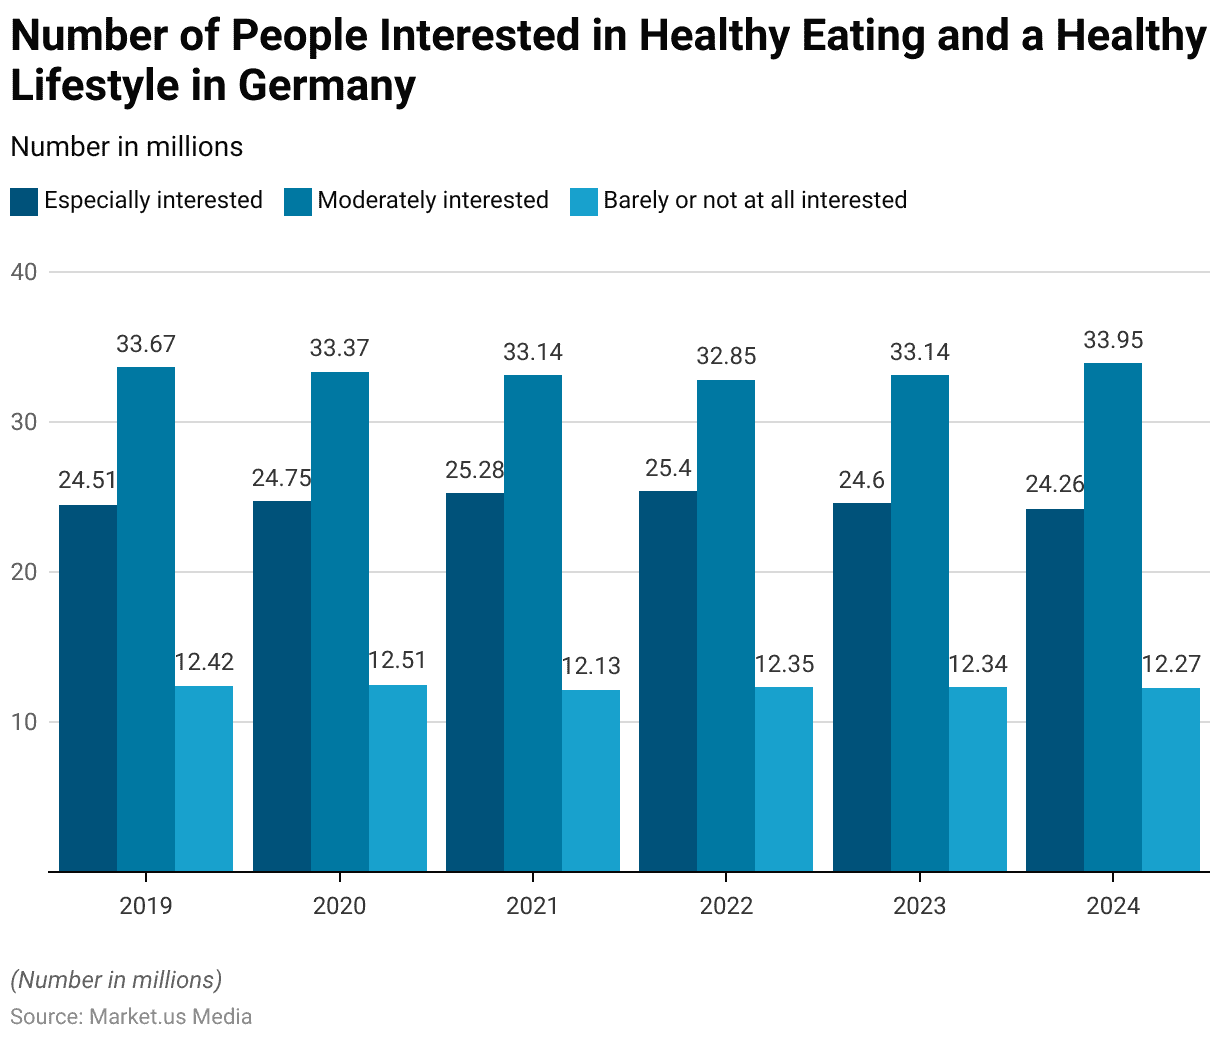
  • From 2019 to 2024, the number of people in Germany interested in healthy eating and a healthy lifestyle remained relatively stable.
  • In 2019, 24.51 million individuals were especially interested, 33.67 million were moderately interested, and 12.42 million were barely or not at all interested.
  • The following year, in 2020, the numbers were similar, with 24.75 million especially interested, 33.37 million moderately interested, and 12.51 million barely or not at all interested.
  • By 2021, the number of people especially interested increased slightly to 25.28 million, while the number moderately interested declined to 33.14 million, and those barely or not at all interested decreased to 12.13 million.
  • In 2022, the number of those especially interested increased slightly again to 25.4 million, while the number moderately interested dropped to 32.85 million, and the number barely or not at all interested rose to 12.35 million.
  • In 2023, the trend continued with 24.6 million especially interested, 33.14 million moderately interested, and 12.34 million barely or not at all interested.
  • By 2024, the number of people especially interested declined to 24.26 million, while those moderately interested rose to 33.95 million, and those barely or not at all interested remained at 12.27 million.

(Source: Statista)

Health Conscious Consumer Statistics

Consumer Views on Health and Sustainability – By Level of Usage

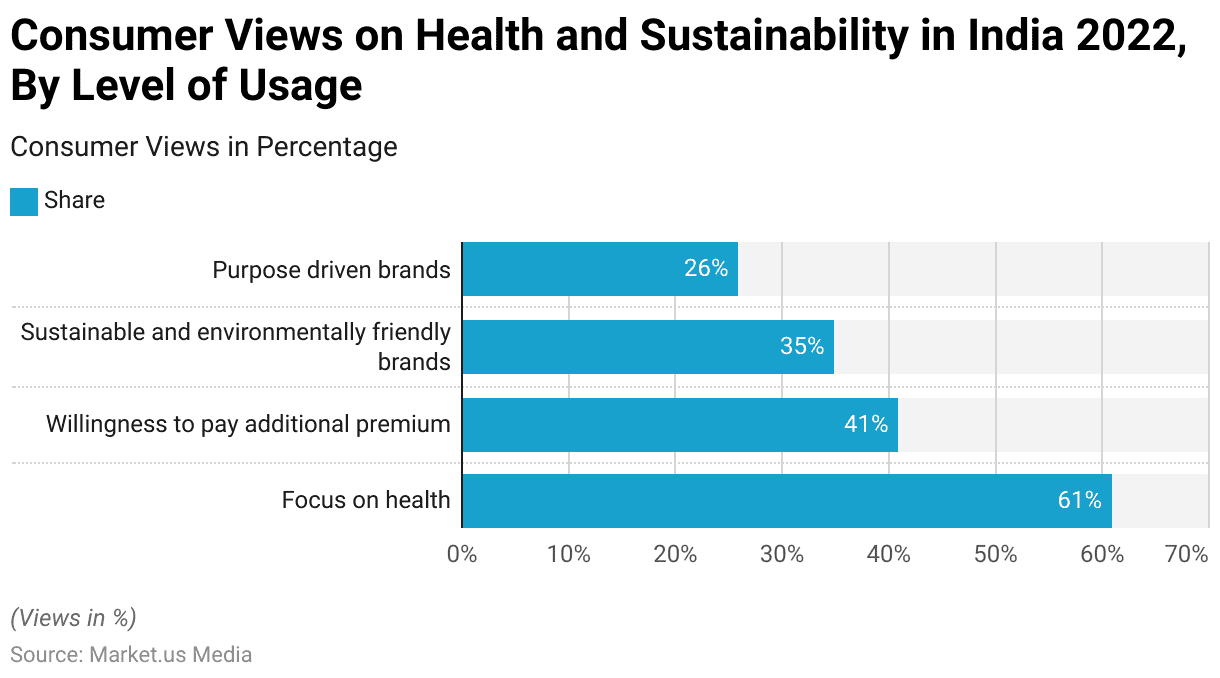
  • As of August 2022, consumer views on health and sustainability in India revealed a strong focus on health, with 61% of respondents prioritizing it.
  • Additionally, 41% of respondents expressed a willingness to pay a premium for products that align with their health and sustainability values.
  • Sustainable and environmentally friendly brands were supported by 35% of consumers, while 26% preferred purpose-driven brands that align with specific social or environmental goals.

(Source: Statista)

Cost of a Healthy Diet in Various Nations and Regions

India

  • From 2017 to 2022, the cost of a healthy diet in India gradually increased.
  • In 2017, the cost was $2.86 per person per day, and by 2018, it slightly rose to $2.87.
  • This upward trend continued in 2019, with the cost reaching $2.92.
  • In 2020, it increased further to $3.01, followed by a rise to $3.11 in 2021.
  • By 2022, the cost of a healthy diet had risen to $3.36 per person per day.

(Source: Statista)

Japan

  • From 2017 to 2021, the cost of a healthy diet per person per day in Japan remained relatively stable.
  • In 2017, the cost was $5.53 in PPP dollars, and it slightly increased to $5.7 in 2018.
  • In 2019, the cost decreased slightly to $5.57 but then rose again to $5.65 in 2020.
  • By 2021, the cost was $5.64, indicating a small fluctuation but no significant changes over the five years.

(Source: Statista)

China

  • From 2017 to 2021, the cost of a healthy diet per person per day in China showed slight fluctuations but remained relatively stable.
  • In 2017, the cost was $5.53 in PPP dollars, which increased to $5.7 in 2018.
  • In 2019, it slightly decreased to $5.57, followed by a modest rise to $5.65 in 2020.
  • By 2021, the cost remained almost unchanged at $5.64, showing only a minor decline over the five years.

(Source: Statista)

Hong Kong

  • From 2017 to 2021, the cost of a healthy diet per person per day in Hong Kong steadily increased.
  • In 2017, the cost was $3.66 in PPP dollars, which rose to $3.82 in 2018.
  • The upward trend continued in 2019 with a significant increase to $4.15, followed by a further rise to $4.51 in 2020.
  • By 2021, the cost reached $4.72, marking a consistent annual increase over the five years.

(Source: Statista)

Latin America and the Caribbean

  • From 2017 to 2022, the cost of a healthy diet per person per day in Latin America and the Caribbean showed a consistent upward trend.
  • In 2017, the cost was $3.62 in PPP dollars, which slightly increased to $3.69 in 2018.
  • The cost continued to rise, reaching $3.78 in 2019 and $3.88 in 2020.
  • By 2021, the cost had risen further to $4.08, and in 2022, it reached $4.56, reflecting a steady annual increase over the six years.

(Source: Statista)

Key Spending Statistics

Spending on Health and Functional Foods

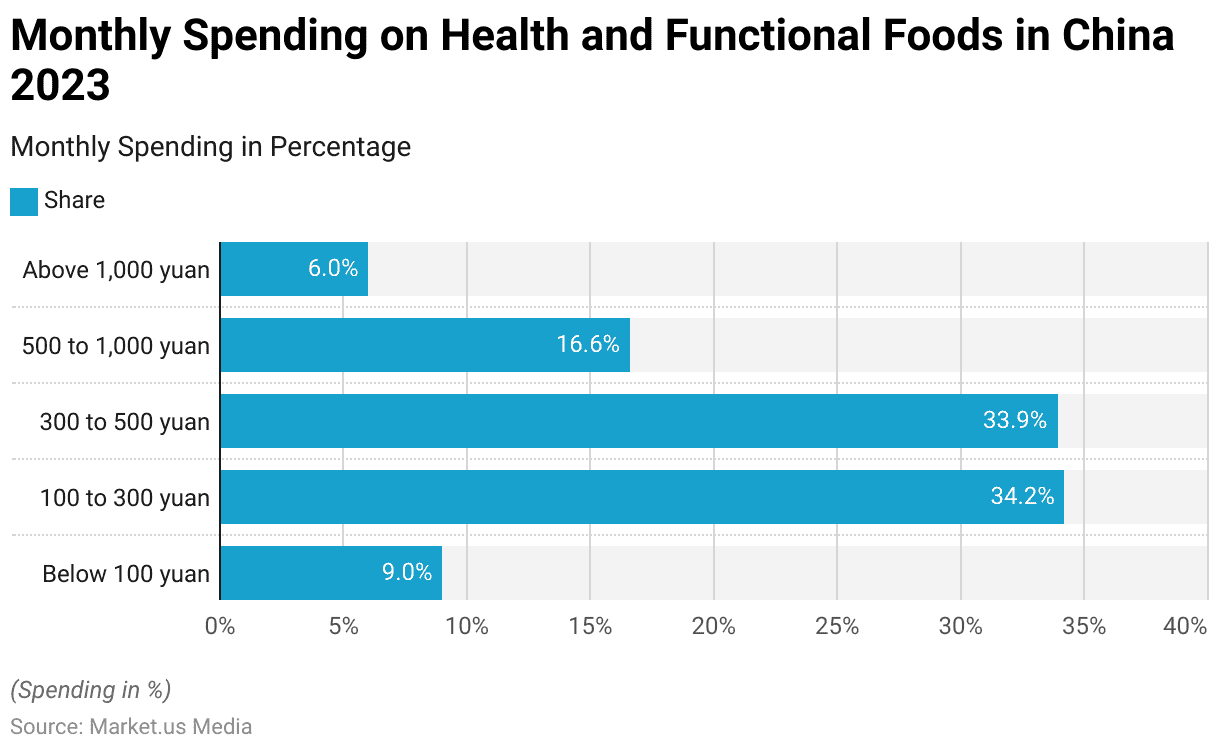
  • As of February 2023, the distribution of monthly spending on health and functional food products in China revealed varying spending habits.
  • A significant portion of respondents, 34.2%, spent between 100 to 300 yuan, followed closely by 33.9% who spent between 300 to 500 yuan.
  • Additionally, 16.6% of respondents allocated between 500 to 1,000 yuan, while 9% spent less than 100 yuan.
  • Only a smaller group, 6%, reported spending above 1,000 yuan on these products each month.

(Source: Statista)

Willingness to Spend Money on Good Food

  • From 2019 to 2023, the number of people in Germany with a high willingness to spend money on a good diet and quality food showed a gradual decline.
  • In 2019, the figure stood at 39.05 million, slightly increasing to 39.15 million in 2020.
  • However, this number decreased over the following years, with 38.17 million in 2021, 37.49 million in 2022, and reaching 36.68 million in 2023.

(Source: Statista)

Nutrition Spending Per Household – By Degree of Urbanization

  • From 2016 to 2020, the monthly expenditure per household on nutrition products in Vietnam varied between urban and rural areas.
  • In urban areas, the expenditure ranged from 467,000 Vietnamese dong in 2016 to 468,000 dong in 2020, showing a steady trend.
  • Meanwhile, rural households initially spent 50,000 dong in 2016, which gradually increased over the years, reaching 266,000 dong by 2020.
  • The gap between urban and rural expenditure on nutrition products widened as the years progressed, reflecting the increasing consumption of nutrition products in rural areas, though urban areas consistently spent more.

(Source: Statista)

Funding for Nutrition Research

  • From FY 2013 to FY 2025, the National Institutes for Health (NIH) allocated increasing funding for nutrition research.
  • The funding began at 1.524 billion U.S. dollars in 2013 and steadily rose each year, reaching 2.301 billion U.S. dollars in 2025.
  • The most notable growth occurred from 2013 to 2020, with funding surpassing the two billion-dollar mark in 2020.
  • In 2023, the funding reached 2.231 billion dollars, a slight increase from the previous year.
  • The allocation has remained relatively stable, with a small dip projected in 2024 to 2.224 billion dollars before rising again in 2025.
  • This trend highlights a consistent commitment to advancing nutrition research.

(Source: Statista)

Regulations for Different Health and Functional Foods

  • Regulations for health and functional foods vary significantly across countries, reflecting diverse approaches to ensuring consumer safety and product efficacy.
  • In the United States, the Food and Drug Administration (FDA) oversees dietary supplements under the Dietary Supplement Health and Education Act of 1994, which requires manufacturers to ensure product safety and proper labeling but does not mandate pre-market approval.
  • The European Union enforces the Food Supplements Directive 2002/46/EC, mandating that supplements be proven safe in both dosage and purity before market entry.
  • Japan‘s system includes Foods for Specified Health Uses (FOSHU), where products must undergo rigorous evaluation and approval by the Consumer Affairs Agency to bear health claims.
  • In India, the Food Safety and Standards Authority of India (FSSAI) regulates health supplements and nutraceuticals under the Food Safety and Standards (Health Supplements, Nutraceuticals, Food for Special Dietary Use, Food for Special Medical Purpose, Functional Food, and Novel Food) Regulations, 2016, requiring product approval and adherence to specified standards.
  • These regulatory frameworks aim to protect consumers by ensuring that healthy and functional foods are safe, accurately labeled, and their health claims substantiated.

(Sources: U.S. Senate, EU, FOSHU, FSSAI)

Recent Developments

Acquisitions and Mergers:

  • Unilever Acquires The Vegetarian Butcher (2023): Unilever acquired The Vegetarian Butcher for an undisclosed amount to expand its plant-based product portfolio. The company aims to strengthen its position in the growing health-conscious consumer segment, where plant-based food demand is rising.
  • Nestlé Acquires the AI-Powered Health Tech Firm (2024): In a bid to integrate health-conscious tech solutions into its portfolio, Nestlé acquired a health technology firm, which uses AI to personalize nutrition and wellness plans. This move highlights Nestlé’s focus on integrating technology with food offerings to cater to health-conscious consumers, especially in the wake of the rising trend in personalized nutrition.

Product Launches

  • Coca-Cola’s New Line of Health-Oriented Beverages (2023): Coca-Cola launched a new product line called “Coca-Cola with Nutrients” which includes beverages enriched with vitamins, minerals, and electrolytes to appeal to health-conscious consumers. The company invested $100 million in developing these health-conscious beverages, targeting the growing demand for functional drinks.
  • PepsiCo’s Launch of Plant-Based Snacks (2024): PepsiCo introduced a line of plant-based snacks under the “Off the Eaten Path” brand. This launch is aligned with consumer preferences for clean-label, healthy, and sustainable snack options, responding to the 18% annual growth of the plant-based food market globally.

Funding and Investments:

  • Impossible Foods Raises $200 Million (2024): Impossible Foods, known for its plant-based meat products, raised $200 million in Series G funding in 2024 to expand its offerings and market presence. The company plans to use the funds to scale production and enhance consumer education on plant-based eating, aiming to tap into the growing number of health-conscious individuals seeking sustainable food options.
  • MycoTechnology’s $75 Million Investment (2024): MycoTechnology, a company specializing in edible fungi-based products, raised $75 million in a Series D round to boost production of its plant-based protein alternatives. The company plans to use the investment to expand product lines that cater to the health-conscious consumer seeking alternatives to traditional protein sources.

Conclusion

Health Conscious Consumer Statistics – The rise of health-conscious consumers is reshaping global purchasing behaviors, with individuals increasingly prioritizing natural, organic, and sustainable products.

Driven by a growing awareness of the link between diet and well-being, consumers are willing to pay more for healthier food options, as seen in the rising costs of healthy diets and increased nutrition research funding.

This trend is evident across regions, influencing food industries to offer more health-focused and sustainable choices.

As consumers demand better-for-you products, the health-conscious shift is expected to continue driving innovation and influencing market dynamics worldwide.

FAQs

What defines a health-conscious consumer?

A health-conscious consumer actively seeks out products and services that contribute to physical and mental well-being, with a focus on natural, organic, and sustainable options. They prioritize health benefits and often choose food and lifestyle products based on their nutritional value, environmental impact, and ethical considerations.

How are health-conscious consumers influencing the food industry?

Health-conscious consumers are driving the demand for healthier, organic, and sustainable food options. They are prompting companies to innovate by offering products with cleaner ingredients, fewer additives, and environmentally friendly packaging. This trend is also leading to the growth of plant-based, gluten-free, and non-GMO foods.

Are health-conscious consumers willing to pay more for healthier options?

Yes, studies show that a significant portion of health-conscious consumers are willing to pay a premium for products they perceive as healthier, more natural, or sustainable. This includes organic foods, functional foods, and products with transparent ingredient sourcing.

What are the key factors driving the health-conscious consumer trend?

The main drivers include increased awareness of the connection between diet and long-term health, growing concerns over environmental sustainability, and the rise of chronic diseases linked to poor eating habits. Social media and influencers also play a significant role in shaping consumer preferences.

How do health-conscious consumers view sustainability?

Sustainability is increasingly important to health-conscious consumers. Many seek products from brands that promote environmental responsibility and ethical sourcing, such as those offering plant-based foods or eco-friendly packaging. This trend also extends to choosing companies that prioritize animal welfare and carbon footprint reduction.

Discuss Your Needs With Our Analyst

Please share your requirements with more details so our analyst can check if they can solve your problem(s)


Source link

3 12, 2024

Analyst Forecast XRP to hit $10 and This New Altcoin to 20x in 2025  » The Merkle News

By |2024-12-03T16:05:25+02:00December 3, 2024|Crypto News, News|0 Comments

XRP has been recording high network activity for the last few weeks as its Futures Open Interest reached a new peak at $3.91 billion.

Since XRP’s price is currently rallying, analysts are expecting the bullish momentum to continue towards the $4.40 resistance.

Meanwhile, traders are also showing interest in Lunex Network’s low cap altcoin which is already poised for 1,800% gains by early 2025. Since Lunex Network is reshaping the DeFi trading experience, analysts are expecting this new platform to become the leading exchange by 2025.

XRP Records Massive Network Activity with Futures Open Interest Hitting New Peak

XRP recently reached a historic milestone with its Futures Open Interest hitting a record $3.91 billion. This surge in trading activity reflects a strong community engagement as both retail and institutional traders are showing increased interest in XRP.

Since XRP has recently launched its stablecoin RLUSD and is seeing increased adoption in cross-border payments, analysts are expecting more network activity for XRP in the next few weeks. XRP’s derivatives market is already booming with activity as its trading volume has surged by an impressive 289% to hit the $60 billion milestone. XRP’s Options trading has also reached $400,100 with its open interest climbing to $992,330.

XRP’s price is currently at $2.44 after an impressive 27.40% intraday surge. Since XRP’s long/short ratio still stands at 0.9932 which suggests a nearly balanced sentiment. If XRP can maintain its current momentum, XRP’s price could test the $4.4008 upper resistance before the end of Q4.

Lunex Network (LNEX) Reshapes Cross Chain Trading with New DeFi Exchange

Lunex Network is poised for even bigger gains than XRP in 2025 because of its unique cross chain interoperability features. On traditional trading platforms, users have to undergo lengthy processes and connect third-party wallets to transfer tokens across different chains. By resolving this problem, Lunex Network is attracting a range of retail and institutional investors.

Lunex Network is also distinguishing itself from other exchange platforms by focusing on user security and privacy. Since Lunex Network has no KYC checks upon signup, users can enjoy a fully anonymous trading experience. If users opt for the specialized subscription service Lunex Pro, then traders can enjoy additional benefits such as cashback and anti-money laundering checks on their wallet addresses.

To make things even better, Lunex Network also simplifies the trading process for novice traders with its Portfolio Tracker and DeFi Wallet. As users can store all of their digital assets on Lunex Network, they can view updated statistics and charts to track their trading progress over time. These statistics can also help users make better trading decisions and increase their gains over time.

Since Lunex Network is already committed to increasing its adoption across the crypto and real world markets, analysts are projecting up to 1800% gains for LNEX holders by early 2025. Lunex Network’s native LNEX token is currently priced at $0.0033 after a massive 175% jump from its initial price of $0.0012. Since analysts are already expecting another demand induced price jump within the next few days, now is the ideal time to invest in Lunex Network during Q4’s bull market before the token skyrockets in 2025.

You can find more information about Lunex (LNEX) Network here:

Disclosure: This is a sponsored press release. Please do your research before buying any cryptocurrency or investing in any projects. Read the full disclosure here.

Source link

3 12, 2024

EUR/GBP Forecast Today 03/12: Holds Key Support (Video)

By |2024-12-03T14:08:43+02:00December 3, 2024|Forex News, News|0 Comments

  • As I look at the Euro against the British pound, I have to ask a lot of questions of whether or not we are breaking down more significantly than we have seen in the past.
  • When I zoom out on the charts going back to approximately the summer of 2016, this is an area that’s held since then.

Because of that, if we break down from here, we could see the Euro just crater. That being said, it also somewhat lends itself to being a place for contrarian traders to get involved and start betting against the markets in general. It obviously would be a very difficult ride to the upside, but I think if we get beyond the 0.84 level, then you can have some credence for that.

On a Drop in this Pair

If we break down below the 0.82 level, then like I said, we really start to drop perhaps all the way down to 0.77 before it’s all said and done. That would be a brutal sell-off, but not necessarily something that is out of the realm of possibility. I think both of these economies have major issues, but right now, I think the biggest problem that I know of is probably Germany, and that does not bode well for the euro overall.

The euro is basically a basket case at this point. And I think you continue to have the major issues of the fact that you have all of these countries that have trouble cooperating. We also have the issues in Ukraine and that’s not going anywhere. So really at this point in time, while I’m not necessarily overly bullish on the pound, I definitely don’t like the euro.That’s the main takeaway here. However, I am willing to go either way. If the market tells me, it’s time to start buying, then so be it.

Ready to trade our Forex daily forecast? We’ve shortlisted the best regulated forex brokers UK in the industry for you. 

Source link

3 12, 2024

Benefits, Uses, Side Effects, and More

By |2024-12-03T14:07:17+02:00December 3, 2024|Dietary Supplements News, News|0 Comments


Vitamin C is a popular antioxidant, known largely for its immune health benefits. Many people take vitamin C supplements to prevent illness, especially during cold and flu season.

While boosting your immunity is one role of vitamin C, there are a few other lesser-known benefits of this essential vitamin. Learn what those are below, along with quality sources of vitamin C.

Some of the hallmark signs of a vitamin C deficiency are delayed wound healing and fragile skin. The main reason that vitamin C is so critical for skin health is because of its relationship to collagen. Collagen is a key component of connective tissue, and vitamin C is necessary for collagen formation. So, when you don’t consume enough vitamin C, collagen deteriorates which leaves your skin in bad shape.

Vitamin C also works with vitamin E, another antioxidant, to prevent damage to your skin from harmful UV rays. 

Vitamin C’s role in skin health also has immune benefits, as the skin is one of our body’s defense systems against pathogens. However, it doesn’t end there. Vitamin C also plays a role in both innate and adaptive immunity, our bodies’ first response and targeted response to specific pathogens, respectively. Vitamin C’s antioxidant properties prevent oxidative damage to healthy cells. 

Specifically in athletes, those exposed to extreme cold temperatures, and those on the border of vitamin C deficiency, consuming at least 200 mg of vitamin C per day may reduce risk of the common cold. For the general population, vitamin C supplementation hasn’t been shown to prevent the common cold, but it may reduce the duration of illness and severity of symptoms if taken preventatively (as opposed to after development of the cold).

Since oxidative damage— what occurs in your body when there are too many unstable molecules called free radicals in the body and not enough antioxidants to get rid of them—is thought to be a cause of cardiovascular disease, antioxidants like vitamin C may help reduce risk of cardiovascular disease. A 2020 study found that vitamin C supplementation of at least 500 mg per day was linked with reduced blood pressure levels. 

However, many other studies have found conflicting results on vitamin C’s role in reducing cardiovascular disease risk, so more studies are necessary to further explore this connection.

Vitamin C plays an important role in enhancing absorption of nonheme iron, the kind that comes from plant foods. If you’re at risk of iron deficiency, especially if you eat a plant-based diet, adding sources of vitamin C to your meals could help you better absorb the iron in foods like beans, seeds, and nuts. That might mean adding red peppers to your beans or having oatmeal with nuts, seeds, and strawberries.

While supplementation is one way of getting vitamin C, there are several great food sources as well. You’ll notice that they’re all fruits and veggies, so in addition to vitamin C, they have a bunch of other nutrients important for health. 

Some vitamin C-rich foods include:

  • Red bell pepper: 95 milligrams (mg) per ½ raw cup, or 106% of your daily value (DV)
  • Orange juice: 93 mg per ¾ cup, or 103% DV
  • Orange: 70 mg per medium orange, or 78% DV
  • Grapefruit juice: 70 mg per ¾ cup, or 78% DV
  • Kiwi: 64 mg per medium kiwi, or 71% DV
  • Green bell pepper: 60 mg per ½ raw cup, or 67% DV
  • Broccoli: 51 mg per ½ cooked cup, or 57% DV
  • Strawberries: 49 mg per ½ sliced cup, or 54% DV
  • Brussels sprouts: 48 mg per ½ cooked cup, or 53% DV
  • Baked potato: 17 mg per medium potato, or 19% DV

Supplements are another means of meeting your vitamin C needs. These come in a variety of forms including capsule, powder, gummy, chewable, and liquid. 

Vitamin C can be taken any time of day, but spreading it out or taking it with food may reduce the likelihood of gastrointestinal side effects caused by its high acidity level. 

What To Look for

When buying a supplement, we recommend finding an independently-tested option since supplements are not regulated by the FDA for purity and potency. Reputable independent testers include USP, NSF, and ConsumerLab.com. When in doubt, shop from reputable brands and always speak with a healthcare provider before starting a new supplement.

Dosage

The recommended dietary allowances (RDAs) for vitamin C vary based on age, sex, pregnancy or lactation status, and smoking status. The RDAs for vitamin C (specifically from food sources) are:

  • 0-6 months: 40 mg
  • 7-12 months: 50 mg
  • 1-3 years: 15 mg
  • 4-8 years: 25 mg
  • 9-13 years: 45 mg
  • 14-18 years: 75 mg for males; 65 mg for females; 80 mg if pregnant; 115 mg if lactating
  • 19+ years: 90 mg for males; 75 mg for females; 85 mg if pregnant; 120 mg if lactating

Studies have shown that when you consume 30-180 mg per day, 70-90% is absorbed, but when you consume upwards of 1g/day, less than 50% is absorbed.

Since vitamin C is a water-soluble vitamin, there is a low risk of toxicity. When you consume too much of it, your body typically excretes the excess in your urine rather than holding on to it. 

Some studies have suggested that excess intake of vitamin C could contribute to other health issues like increased risk for cardiovascular disease mortality, excess iron absorption, increased oxidative damage, and higher risk of kidney stones; however, these studies were mostly inconclusive or done in vitro–on test tubes–rather than on actual people. For iron absorption, the issue was only seen in those with hereditary hemochromatosis.

If you are undergoing chemotherapy or radiation treatment or taking statins, it’s recommended you check with a healthcare provider before taking a vitamin C supplement. 

Vitamin C supplements should typically be avoided if you’re undergoing chemotherapy or radiation treatment. Studies are mixed on the effects of supplemental forms of antioxidants–like vitamin C–on cancer treatment and tumor progression. Therefore, if you’re undergoing these forms of cancer treatment make sure to speak with your oncologist before starting a vitamin C supplement. 

If you’re taking a statin–a type of drug typically used to lower cholesterol levels–you may also want to hold off on a vitamin C supplement. Vitamin C may reduce the effectiveness of statins by minimizing their positive impact on HDL cholesterol levels–the “good” kind of cholesterol. Check with your doctor before starting a vitamin C supplement if you’re taking a statin.

While vitamin C toxicity is rare, there are established tolerable upper limits (ULs) that apply to food and supplemental forms of vitamin C. The ULs vary based on age and are as follows:

  • 1-3 years: 400 mg
  • 4-8 years: 650 mg
  • 9-13 years: 1200 mg
  • 14-18 years: 1800 mg
  • 19+ years: 2000 mg

While vitamin C is generally safe, some side effects can occur from excess vitamin C consumption. This is most common through supplementation since supplements tend to have much higher concentrations of vitamins than foods do. 

Potential side effects include:

Vitamin C is a powerful antioxidant and water-soluble vitamin. It plays an important role in skin health by helping with collagen synthesis and protecting against damage from UV rays. It also promotes immune health, iron absorption, and may even reduce risk for cardiovascular disease. 

Consuming vitamin C-rich foods is generally safe, but supplementation may be risky for those taking statins or undergoing chemotherapy or radiation treatment. In general, it’s best to speak with a trusted healthcare provider before starting a new supplement. 


Source link

3 12, 2024

How Network Growth Could Push SOL to $700

By |2024-12-03T14:04:36+02:00December 3, 2024|Crypto News, News|0 Comments

SOL hit a new ATH of $263.83 earlier in November, a 302.64% yearly increase. When SOL struggled to break above $25 last year, hopes for the network’s future were low. However, now, technical indicators are bullish, and buying pressure could push SOL to $330 by January 2025. The rapid growth of Solana’s dApp market is a major factor in SOL’s price action.

Meanwhile, the Layer-2 project PlutoChain (PLUTO) aims to expand Bitcoin’s applications. The biggest cryptocurrency’s role is currently limited to a reserve asset and means of payment. PlutoChain might change how we use BTC and promote its ecosystem’ development.

Can SOL Hit $700 in 2025?

Solana gained popularity as a platform for dApps and new token launches due to its scalability and thriving developer community. 

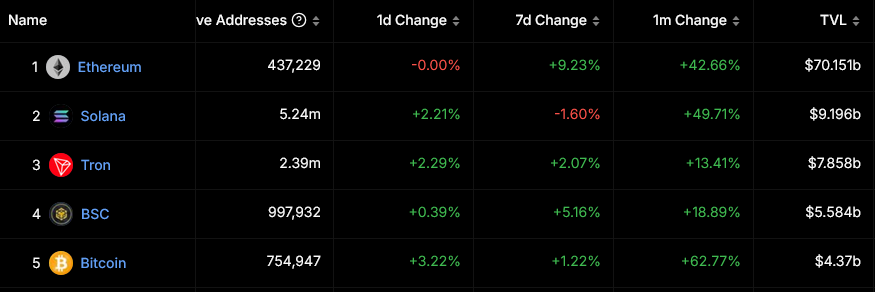
The Total Value Locked (TVL) of DeFi applications on Solana reached $6 billion in October. Within the last month, the TVL grew by 49.71% and hit $9.196 billion. This makes Solana the second-largest blockchain by TVL, only outperformed by Ethereum with a $70.151 billion TVL. 

AD 4nXf2kpjwUmczsF1x5t1nJkYUC3gR3EFQv vs Rq3BmTUvhTc Y6uCizFUbPdKqw6FtZeGtfplXzsRxUpNVvi8h9Hy6HatQIzT9MNwl9vIjYgyU7zOV4Ur ldB vEDSouCGeKEke09w?key=UL70Ozkhe14KrKTvn gsUnq

Interestingly, the number of wallets holding SOL is significantly higher than that of ETH, BSC, and BTC holders combined.  

Solana’s main competitor, Ethereum, saw moderate growth of 81.75% this year, mainly due to its high gas fees and slow transactions. If Solana continues to attract developers, it could soon outperform Ethereum in TVL. 

All of SOL’s technical indicators show a strong uptrend, both in the short and long term. Although SOL has pulled back to $244.07 after hitting its new ATH, it may soon spike again as investors see the correction as a buying opportunity. 

In a favorable outcome, SOL could reach $330 in January and $700 by the end of 2025. This scenario is plausible given that it’s only a 112% yearly growth – three times lower than in 2024.

PlutoChain Drives Bitcoin Innovation 

Bitcoin’s TVL is two times lower than Solana’s, even though BTC’s $1.9 trillion market cap is over 16 times higher than SOL’s. 

Thinking of expanding into Africa?

Avoid the common mistakes businesses during expansion. Register to learn the common mistakes business make when expanding into Africa.

Written by seasoned experts, who have over 16 years of experience in Free Zones development. Learn more.

The reason is simple – BTC is primarily used as a store of value, while SOL is the native token of a mature ecosystem. The new Layer-2 project PlutoChain aims to stimulate the network’s growth and expand BTC’s use cases. 

PlutoChain introduces smart contracts on Bitcoin, which allow for the development of complex DeFi, NFT, and gaming apps. 

AD 4nXfSDXoN8WhxPO3Tt5mGu3LstODMjLaqiWxmekiLvefejOZpyE9OFXbBYLUQsb8E gWTzMH4sEd1wT7CHI9BtZwqGDn29gsDbxGSBaQdZar3g2hj6Rbrnokgd0mZpqfI3YKa6r2Wxg?key=UL70Ozkhe14KrKTvn gsUnqAD 4nXfSDXoN8WhxPO3Tt5mGu3LstODMjLaqiWxmekiLvefejOZpyE9OFXbBYLUQsb8E gWTzMH4sEd1wT7CHI9BtZwqGDn29gsDbxGSBaQdZar3g2hj6Rbrnokgd0mZpqfI3YKa6r2Wxg?key=UL70Ozkhe14KrKTvn gsUnq

Additionally, PlutoChain’s cross-chain bridge helps port Ethereum-based apps to Bitcoin. Bitcoin already has a large and established user base. By bridging dApps to Bitcoin, developers can tap into this user base and boost the adoption of their applications.

PlutoChain recognizes the importance of security for Layer-2 solutions, so it passed an audit by SolidProof that found no vulnerabilities in its code. 

PLUTO Holders Shape the Project’s Future  

PlutoChain is still in its early stages, so its long-term potential largely depends on community sentiment. A transparent, community-driven governance model could help PlutoChain gain traction. 

All $PLUTO holders are entitled to vote on key development proposals and influence the project’s direction. This ensures that PlutoChain’s vision and updates always align with the interests of its early supporters. 

Those wishing to become part of Bitcoin’s future can now secure $PLUTO tokens at a lower entry price of $0.10619. The price will increase as the presale progresses to next stages. 

AD 4nXdfHVvtBrw9j3cktgkDObTamcVEt4 ZdD lnJchRaDTHH58DFGgkDoqHbVyUJ4IBAV0qRe5OkFyuvXbO6Z JPAjLGNCKg2k sdHCHbzxNSaN5aBKDbMHWI0OPCMZl8VUpWGIEQRzA?key=UL70Ozkhe14KrKTvn gsUnqAD 4nXdfHVvtBrw9j3cktgkDObTamcVEt4 ZdD lnJchRaDTHH58DFGgkDoqHbVyUJ4IBAV0qRe5OkFyuvXbO6Z JPAjLGNCKg2k sdHCHbzxNSaN5aBKDbMHWI0OPCMZl8VUpWGIEQRzA?key=UL70Ozkhe14KrKTvn gsUnq

Final Words

While Solana experiences explosive growth due to its dApp ecosystem, solutions like PlutoChain could stimulate innovation on the Bitcoin network. A higher TVL can potentially make Bitcoin more secure due to increased mining activity, enhance liquidity, and strengthen BTC’s position as the leading cryptocurrency. 

Visit the links below to learn more about PlutoChain and its unique features:

Official Website: https://plutochain.io

X/Twitter Page: https://x.com/plutochain/ 

Telegram Channel: https://t.me/PlutoChainAnnouncements/ 

This article is not financial advice. Past results are not indicative of future returns, and the crypto market is inherently unpredictable. Readers must conduct their own thorough research before purchasing any crypto coin or token. These forward-looking statements are subject to risks and may remain unchanged.


Source link

3 12, 2024

US Dollar Forecast: Steady Ahead of JOLTS Report, Gold, GBP/USD and EUR/USD Outlook

By |2024-12-03T12:06:13+02:00December 3, 2024|Forex News, News|0 Comments

GBP/USD Price Chart – Source: Tradingview

GBP/USD is trading at $1.26640, up 0.12%, showing a slight bullish tilt as it holds above the pivot point at $1.26443. Immediate resistance lies at $1.26916, with further targets at $1.27235 and $1.27500.

On the downside, key support levels to watch are $1.26179 and $1.25887. The pair is supported by an upward trendline, with the 50-day EMA at $1.26683 reinforcing near-term strength.

Meanwhile, the 200-day EMA at $1.26571 serves as a critical foundation for maintaining upward momentum.  If prices remain above $1.26443, buyers could push toward the next resistance levels.

Euro Pressured Amid Weak Manufacturing Data

The Euro faced headwinds as manufacturing data across the Eurozone disappointed. Spain’s Manufacturing PMI dipped to 53.1 from 53.9, while Italy (44.5), France (43.1), and Germany (43.0) reported weaker-than-expected activity, all pointing to persistent contraction.

The bloc’s Final Manufacturing PMI held at 45.2, signaling ongoing economic challenges.

However, Italy’s unemployment rate improved to 5.8% from 6.0%. Markets now await Spanish unemployment data and France’s government budget balance for further direction.

EUR/USD Technical Forecast

Source link

3 12, 2024

North America OTC Health Products Market Size, Share &

By |2024-12-03T12:05:13+02:00December 3, 2024|Dietary Supplements News, News|0 Comments


Dublin, Dec. 03, 2024 (GLOBE NEWSWIRE) — The “North America OTC Health Products Market Size, Share & Trends Analysis By Application (Digestive Health, Women’s Health), Form (Liquid, Gummies), Product, Demography, Distribution Channel, and Segment Forecasts, 2025-2030” report has been added to ResearchAndMarkets.com’s offering.

The North American OTC health products market size is expected to reach USD 106.61 billion by 2030, expanding at a CAGR of 6.15% from 2025 to 2030.

Rising consumer awareness and increasing consumer willingness to spend on nutritional supplements, the increasing prevalence of lifestyle diseases including obesity & diabetes, rise in disposable income, and an increase in the number of distribution channels for OTC products are some of the key factors driving growth. Consumers are increasingly realizing the benefits of nutritional supplements, which help them sustain a healthy lifestyle, thereby positively impacting the market growth. According to the National Institute of Health, Americans spend around USD 2.1 billion annually on weight-loss dietary supplements, usually in the form of pills.

The emergence of e-commerce has led to increased accessibility to dietary and nutritional supplements. Apart from the online channels, companies such as General Nutrition Centers, Inc.; Walmart; and Vitamin Shoppe are some of the major retail outlets. Thus, the easy availability of these products will provide growth opportunities to key players in this space. Moreover, shifting consumer preference to CBD due to its healing properties and limited to no psychoactive effects is expected to drive the growth potential for CBD-infused products. According to Gallup, Inc. report of 2019, approximately 14% of individuals in the U.S. have used some or the other form of CBD-infused products. About 58% of adults use it for pain-related conditions and around 42% for mental health-related conditions.

The COVID-19 pandemic resulted in a surge in consumer preference for immunity-boosting supplements. Segments such as sports nutrition, and women’s & men’s health saw a negative impact due to lockdowns imposed by governments to curb the pandemic. The effect of COVID-19 declined post the third quarter of 2020, which helped the market regain traction.

The market is fragmented with the presence of a large number of companies, intensifying the overall competitive rivalry. Companies are undertaking multiple partnerships and mergers & acquisitions to increase their portfolio & expand their footprint across the country. In addition, companies are focusing on product differentiation and bundling strategies to capture a greater market share. For instance, in March 2022, CV Sciences, Inc. launched PlusCBD Relief Softgels. The company claims that it can deliver seven times better Cannabidiol Acid (CBDA) and Cannabidiol (CBD) than its raw formula. This product has clinical significance in the treatment of inflammatory responses.

North America OTC Health Products Market Report Highlights

  • The dietary supplements and weight loss products segment accounted for 33.71% of the share in 2024. This is attributed to an increase in consumer awareness about the benefits of a healthy diet, growing self-health consciousness, and a rise in the prevalence of obesity
  • The sports formulation segment accounted for the largest share of 22.24% in 2024 due to rising awareness about fitness and high commercial availability of sports nutrition
  • Adults segment is projected to witness the fastest growth during the forecast period owing to the availability of a wide variety of OTC products for the adult demographic
  • Hypermarkets, supermarkets, and convenience stores dominated the market in 2024, owing to the better feasibility of buying from such places and an increase in the number of strategic initiatives like schemes such as loyalty programs
  • The capsules & tablets segment dominated the market in 2024. This can be attributed to the wide availability of products in capsule & tablet form in the market, the rise in innovation to enhance capsules & tablets delivery forms, and higher shelf-life
  • The U.S. dominated the market in terms of revenue, mainly due to the presence of key players, an increase in the prevalence of chronic diseases & obesity, and a rapidly growing geriatric population

Why should you buy this report?

  • Comprehensive Market Analysis: Gain detailed insights into the global market across major regions and segments
  • Competitive Landscape: Explore the market presence of key players worldwide
  • Future Trends: Discover the pivotal trends and drivers shaping the future of the global market
  • Actionable Recommendations: Utilize insights to uncover new revenue streams and guide strategic business decisions

This report addresses:

  • Market intelligence to enable effective decision-making
  • Market estimates and forecasts from 2018 to 2030
  • Growth opportunities and trend analyses
  • Segment and regional revenue forecasts for market assessment
  • Competition strategy and market share analysis
  • Product innovation listing for you to stay ahead of the curve

The leading players in the North America OTC Health Products market include:

  • Herbalife Nutrition
  • CV Sciences
  • Medical Marijuana
  • Nature’s Sunshine Products
  • Johnson and Johnson Services
  • GlaxoSmithKline
  • Bayer
  • American Health
  • The Bountiful Company

Key Attributes:

Report Attribute Details
No. of Pages 100
Forecast Period 2024 – 2030
Estimated Market Value (USD) in 2024 $74.83 Billion
Forecasted Market Value (USD) by 2030 $106.61 Billion
Compound Annual Growth Rate 6.1%
Regions Covered North America

Key Topics Covered:

Chapter 1. Methodology and Scope

Chapter 2. Executive Summary
2.1. Market Outlook
2.2. Segment Outlook
2.3. Country outlook
2.4. Competitive Insights

Chapter 3. North America OTC Health Products Market Variables, Trends & Scope
3.1. Market Lineage Outlook
3.2. Market Dynamics
3.2.1. Market Driver Analysis
3.2.1.1. Rising Consumer Demand for Self-Care
3.2.1.2. Expansion of Product Offerings
3.2.1.3. Aging Population
3.2.2. Market Restraint Analysis
3.2.2.1. Regulatory Challenges
3.2.2.2. Competition from Prescription Drugs
3.3. North America OTC Health Products Market Analysis Tools

Chapter 4. North America OTC Health Products Market: Product Estimates & Trend Analysis
4.1. Segment Dashboard
4.2. North America OTC Health Products Market: Product Movement Analysis
4.3. North America OTC Health Products Market by Product Outlook (USD Million)
4.4. Market Size & Forecasts and Trend Analyses, 2018 to 2030 for the following
4.5. Cough, Cold, and Flu Products
4.6. Dietary Supplements and Weight Loss Products
4.7. Sports Nutrition Products
4.8. Probiotics
4.9. CBD Nutraceutical Products

Chapter 5. North America OTC Health Products Market: Form Estimates & Trend Analysis
5.1. Segment Dashboard
5.2. North America OTC Health Products Market: Form Movement Analysis
5.3. North America OTC Health Products Market by Form Outlook (USD Million)
5.4. Market Size & Forecasts and Trend Analyses, 2018 to 2030 for the following
5.5. Liquid
5.6. Capsules/Tablets
5.7. Gummies
5.8. Others

Chapter 6. North America OTC Health Products Market: Application Estimates & Trend Analysis
6.1. Segment Dashboard
6.2. North America OTC Health Products Market: Application Movement Analysis
6.3. North America OTC Health Products Market by Application Outlook (USD Million)
6.4. Market Size & Forecasts and Trend Analyses, 2018 to 2030 for the following
6.5. Digestive health
6.6. Women’s & Men’s Health
6.7. Weight Control
6.8. Joint health
6.9. Immune Defense
6.10. Sports Formulation
6.11. Others

Chapter 7. North America OTC Health Products Market: Demography Estimates & Trend Analysis
7.1. Segment Dashboard
7.2. North America OTC Health Products Market: Demography Movement Analysis
7.3. North America OTC Health Products Market by Demography Outlook (USD Million)
7.4. Market Size & Forecasts and Trend Analyses, 2018 to 2030 for the following
7.5. Children
7.6. Adults

Chapter 8. North America OTC Health Products Market: Distribution Channel Estimates & Trend Analysis
8.1. Segment Dashboard
8.2. North America OTC Health Products Market: Distribution Channel Movement Analysis
8.3. North America OTC Health Products Market by Distribution Channel Outlook (USD Million)
8.4. Market Size & Forecasts and Trend Analyses, 2018 to 2030 for the following
8.5. Retail pharmacies
8.6. Online
8.7. Hypermarkets, supermarkets, convenience stores

Chapter 9. North America OTC Health Products Market: Regional Estimates & Trend Analysis
9.1. Regional Dashboard
9.2. Market Size & Forecasts Trend Analysis, 2018 to 2030:
9.3. North America

Chapter 10. Competitive Landscape
10.1. Market Participant Categorization
10.2. Recent Developments & Impact Analysis by Key Market Participants
10.3. Company Market Share Analysis, 2024
10.4. Key Company Profiles

  • Herbalife Nutrition
  • CV Sciences
  • Medical Marijuana
  • Nature’s Sunshine Products
  • Johnson and Johnson Services
  • GlaxoSmithKline
  • Bayer
  • American Health
  • The Bountiful Company

For more information about this report visit https://www.researchandmarkets.com/r/l7gmjc

About ResearchAndMarkets.com
ResearchAndMarkets.com is the world’s leading source for international market research reports and market data. We provide you with the latest data on international and regional markets, key industries, the top companies, new products and the latest trends.


Source link

3 12, 2024

Will BTC continue its ongoing pullback?

By |2024-12-03T12:03:05+02:00December 3, 2024|Crypto News, News|0 Comments

Bitcoin price today: $92,400

  • Bitcoin drops below $93,000 on Tuesday after declining almost 5% the previous day.
  • CryptoQuant data shows leverage overheating as open interest and leverage ratios hit annual highs, with short-term holders taking profits.
  • On-chain data shows $150 million in Bitcoin liquidations and $435 million outflows from spot ETFs, highlighting shifting market sentiment.
  • The technical outlook shows a bearish divergence in RSI, signaling weakness in bullish momentum.

Bitcoin (BTC) continues to trade in the red, dropping below $93,000 on Tuesday after declining almost 5% the previous day. CryptoQuant data shows that the recent price pullback is due to leverage overheating conditions and holders’ booking profits in BTC, resulting in $150 million in Bitcoin liquidations in the last 24 hours and $435 million in spot BTC Exchange Traded Funds (ETF) outflows on Monday.

The technical outlook further supports the price correction, as the Relative Strength Index (RSI) shows a bearish divergence.

Bitcoin price dips below $93,000

Bitcoin price faces a pullback after it failed to reach its $100,000 milestone on Friday and declined nearly 6%, reaching a low of $92,600 on Monday. This price correction triggered a wave of liquidations across the crypto market, resulting in $520 million in total liquidations in the last 24 hours, almost $150 million specifically in BTC, according to data from CoinGlass.

Bitcoin Liquidations chart. Source: Coinglass

CryptoQuant data provides a clearer picture of the recent pullback. This correction occurred due to leverage overheating, as open interest and estimated leverage ratio reached annual highs. Therefore, a 10-20% correction can be seen as a natural phenomenon.

Bitcoin Estimated Leverage Ratio Source: CryptoQuant

Bitcoin Estimated Leverage Ratio Source: CryptoQuant

As mentioned in the previous article on Monday, short-term holders are realizing profits. The  Short-Term Spent Output Profit Ratio (SOPR) indicator measures profits realized on coins held for more than 1 hour but less than 155 days. For this analysis, short-term investors hold Bitcoin for less than 155 days. 

Historically, when using a 30-day moving average to the Short-Term SOPR, it has been observed that during bullish trends, the metric tends to reach around 1.02 before profit-taking occurs. Each time this level has been reached, Bitcoin’s price has experienced a pullback or correction.

On Tuesday, the metric read 1.01, suggesting that Bitcoin’s price could continue its ongoing short-term correction.

Bitcoin Short-term Holders chart.  Source: CryptoQuant

Bitcoin Short-term Holders chart.  Source: CryptoQuant

The recent retracement could be clearly seen as institutional demand fell on Monday. According to Coinglass ETF data, US spot Bitcoin ETFs experienced an outflow of $435.30 million on Monday, breaking the streak of inflows since November 18. If this outflow trend persists or accelerates, it could further extend the ongoing decline in Bitcoin price.

Total Bitcoin Spot ETF Net Inflow chart. Source: Coinglass

Total Bitcoin Spot ETF Net Inflow chart. Source: Coinglass

In an exclusive interview on Friday, Geoff Kendrick, Global Head of Digital Assets Research at Standard Chartered, told FXStreet, “You can certainly argue when something goes up 30%, you can have pullbacks because markets can get a little bit ahead of themselves (…) The ETFs are kind of buying on any dip, so that should help cushion any sell-offs.”

From an on-chain perspective, cycle metrics such as Market Value Realised Value (MVRV), Net Unrealized Profit and Loss (NUPL), and Puell Multiple still indicate that Bitcoin is in a bull market with upward potential. 

Bitcoin MVRV Ratio chart. Source: CryptoQuant

Bitcoin MVRV Ratio chart. Source: CryptoQuant

Bitcoin Price Forecast: RSI shows bearish divergence

Bitcoin price rallied more than 40% in the last three weeks, hitting a new all-time high (ATH) of $99,588 on Friday. The failure to reach above the $100,000 mark led to a nearly 6% price pullback, falling to a low of $92,700 on Monday. At the time of writing on Tuesday, BTC continues to decline and trades around $92,380.

If BTC’s pullback continues, it could extend the decline to retest its important psychological level of $90,000. A successful close below this level would extend the additional decline to test its next support level at $85,000.

Moreover, the Relative Strength Index (RSI) indicator supports this price pullback in the daily chart. The higher high in BTC’s price formed on Friday does not reflect the RSI lower high for the same period. This development is termed a bearish divergence, often leading to a trend reversal or short-term crash.

BTC/USDT daily chart

BTC/USDT daily chart

However, if BTC finds support around the $90,000 level and recovers, it could rally to reach its ATH level of $99,588.

Bitcoin, altcoins, stablecoins FAQs

Bitcoin is the largest cryptocurrency by market capitalization, a virtual currency designed to serve as money. This form of payment cannot be controlled by any one person, group, or entity, which eliminates the need for third-party participation during financial transactions.

Altcoins are any cryptocurrency apart from Bitcoin, but some also regard Ethereum as a non-altcoin because it is from these two cryptocurrencies that forking happens. If this is true, then Litecoin is the first altcoin, forked from the Bitcoin protocol and, therefore, an “improved” version of it.

Stablecoins are cryptocurrencies designed to have a stable price, with their value backed by a reserve of the asset it represents. To achieve this, the value of any one stablecoin is pegged to a commodity or financial instrument, such as the US Dollar (USD), with its supply regulated by an algorithm or demand. The main goal of stablecoins is to provide an on/off-ramp for investors willing to trade and invest in cryptocurrencies. Stablecoins also allow investors to store value since cryptocurrencies, in general, are subject to volatility.

Bitcoin dominance is the ratio of Bitcoin’s market capitalization to the total market capitalization of all cryptocurrencies combined. It provides a clear picture of Bitcoin’s interest among investors. A high BTC dominance typically happens before and during a bull run, in which investors resort to investing in relatively stable and high market capitalization cryptocurrency like Bitcoin. A drop in BTC dominance usually means that investors are moving their capital and/or profits to altcoins in a quest for higher returns, which usually triggers an explosion of altcoin rallies.


Source link

Go to Top