About Editorial team of BIPNs

Main team of content of bipns.com. Any type of content should be approved by us.
21 11, 2024

XAG/USD slumps below $31 as safe-haven demand fades: Analytics and Market news from 20 November 2024 09:45

By |2024-11-21T00:21:45+02:00November 21, 2024|Forex News, News|0 Comments


  • Silver price slides below $31.00 as its safe-haven demand fades.
  • Higher bond yields also weighed on the Silver price.
  • Investors expect the Fed to deliver fewer interest rate cuts in the current policy-easing cycle.

Silver price (XAG/USD) extends its correction below $31.00 in European trading hours on Wednesday after facing selling pressure near $31.50 on Tuesday. The white metal falls back as fresh escalation in the Russia-Ukraine war inspired by President Vladimir Putin’s approval to lowering the threshold for counter attack by nuclear weapons faded after Russian Foreign Minister Sergei Lavrov said the country will “do everything possible” to avoid the onset of nuclear war.

Putin cleared revision in the nuclear doctrine after US President Joe Biden provided the Army Tactical Missile System (ATACMS) to Ukraine and permitted them to launch deep into Russian territory. Historically, demand for safe-haven assets such as Silver, strengthens in times of uncertainty and heightened geopolitical risks.

A sharp recovery in the US Treasury yields has also weighed on the Silver price. 10-year US Treasury yields jump to near 4.42% on expectations of fewer interest rate cuts from the Federal Reserve (Fed) in its current policy-easing cycle. Higher yields on interest-bearing assets increase the opportunity cost of holding an investment in non-yielding assets, such as Silver. The US Dollar Index (DXY), which gauges Greenback’s value against six major currencies, bounces back strongly above 106.60.

Market participants expect the economic agenda of President-elected Donald Trump will boost the United States (US) inflation and economic growth, a scenario that will force the Fed to follow a gradual rate-cut approach.

Silver technical analysis

Silver price stays on track toward the upward-sloping trendline around $29.00, plotted from the February low of $22.30, which also coincides with the 200-day Exponential Moving Average (EMA). The white metal falls back after facing selling pressure near the 50-day EMA, which trades around $31.40.

The asset weakened after the breakdown of the horizontal support plotted from the May 21 high of $32.50.

The 14-day Relative Strength Index (RSI) slides to near 40.00. A bearish momentum will trigger if the RSI (14) sustains below the same.

Silver daily chart

Silver FAQs

Silver is a precious metal highly traded among investors. It has been historically used as a store of value and a medium of exchange. Although less popular than Gold, traders may turn to Silver to diversify their investment portfolio, for its intrinsic value or as a potential hedge during high-inflation periods. Investors can buy physical Silver, in coins or in bars, or trade it through vehicles such as Exchange Traded Funds, which track its price on international markets.

Silver prices can move due to a wide range of factors. Geopolitical instability or fears of a deep recession can make Silver price escalate due to its safe-haven status, although to a lesser extent than Gold’s. As a yieldless asset, Silver tends to rise with lower interest rates. Its moves also depend on how the US Dollar (USD) behaves as the asset is priced in dollars (XAG/USD). A strong Dollar tends to keep the price of Silver at bay, whereas a weaker Dollar is likely to propel prices up. Other factors such as investment demand, mining supply – Silver is much more abundant than Gold – and recycling rates can also affect prices.

Silver is widely used in industry, particularly in sectors such as electronics or solar energy, as it has one of the highest electric conductivity of all metals – more than Copper and Gold. A surge in demand can increase prices, while a decline tends to lower them. Dynamics in the US, Chinese and Indian economies can also contribute to price swings: for the US and particularly China, their big industrial sectors use Silver in various processes; in India, consumers’ demand for the precious metal for jewellery also plays a key role in setting prices.

Silver prices tend to follow Gold’s moves. When Gold prices rise, Silver typically follows suit, as their status as safe-haven assets is similar. The Gold/Silver ratio, which shows the number of ounces of Silver needed to equal the value of one ounce of Gold, may help to determine the relative valuation between both metals. Some investors may consider a high ratio as an indicator that Silver is undervalued, or Gold is overvalued. On the contrary, a low ratio might suggest that Gold is undervalued relative to Silver.


Source link

20 11, 2024

Eating 2 Kiwis a Day Keeps Vitamin C Supplements Away

By |2024-11-20T22:57:12+02:00November 20, 2024|Dietary Supplements News, News|0 Comments


Key Takeaways

  • Two kiwis contain about 120 mg of vitamin C, enough to fulfill the daily recommended amount of vitamin C.
  • Research has suggested that eating two kiwis a day would replace the need for a vitamin C supplement.
  • Experts say that eating two kiwis a day can support immune health, and it’s better to get vitamins from food over supplements in most cases.

Kiwis are an excellent source of vitamin C, an antioxidant that supports immune function, wound healing, and iron absorption.

Two green kiwis or one SunGold kiwi alone is enough to fulfill the daily vitamin C recommendations for most adults. It’s safe to eat kiwis every day, and these fruits could replace the need for vitamin C supplementation, according to a small study published in the journal Foods.

Natural sugars in the fruit aren’t high enough to increase long-term health risks, the researchers found.

“If people like the taste of kiwis or are curious about incorporating them into their diet, they shouldn’t hesitate to regularly eat them, unless they have an allergy,” said Emma Laing, PhD, RDN, director of dietetics at the University of Georgia, who was not involved in the study.

Vitamin C Recommendations

Men (ages 19+) need 90 mg of vitamin C per day, and women (ages 19+) need 75 mg. These recommendations increase for people who are pregnant, lactating, and those who smoke.

Eating Kiwis Is Probably Better Than Taking Vitamin C

Vitamin C supplements are marketed as immune boosters, but there isn’t a lot of evidence that shows people would benefit from taking vitamin C daily.

A 2016 review suggested that daily doses of 200 mg vitamin could reduce the “severity and duration of colds,” but that amount doesn’t have any effect on lowering the chances of catching a cold.

Even if you load up on vitamin C every day, your cells don’t retain this vitamin and absorption decreases once your tissues are saturated with it. Consuming more than 1,000 mg of vitamin C per day reduces the absorption rate to 50%.

“The kidneys work to excrete any excess vitamin C into the urine that the cells don’t use,” Laing said. “Consuming a daily supplement of vitamin C in excess of what your body requires does not have a health benefit, as anything extra will go unused and will literally be flushed down the toilet.”

Taking megadoses of vitamin C isn’t dangerous for most people. However, doses over 2,000 mg could cause gastrointestinal distress, diarrhea, or abdominal cramping.

The body absorbs vitamin C the same way whether it’s from a supplement or a kiwi, but most nutrition experts recommend getting vitamins and minerals from food sources over dietary supplements.

The Health Benefits of Kiwis

Since kiwis contain nutrients beyond just vitamin C, eating these fruits also offers benefits that supplements alone can’t provide. A study published last year found that eating two kiwis a day can also help treat constipation, likely due to the fruit’s fiber content.

“Kiwis have ample amounts of vitamin C plus other healthful compounds that a single supplement can’t match, like other antioxidants, potassium, and fiber,” Laing said.

Making sure you’re reaching the daily recommended amount of vitamin C intake can also support immunity, especially during the winter months when viruses spread more easily, according to Dawn Earnesty, PhD, RDN, a registered dietitian and senior extension specialist at Michigan State University Extension.

A kiwi contains more vitamin C by weight than an orange. Two kiwis contain about 120 mg of vitamin C, which is higher than the daily recommended value. Eating kiwis could be a way to boost your vitamin C intake, but eating kiwis alone isn’t enough to prevent an illness.

“Exercise level, water intake, stress level, and other factors also impact our immunity,” Earnesty told Verywell in an email.

In addition to your diet, regular exercise and ample sleep are also crucial in enhancing your immune system and reducing inflammation.

Earnesty said that while kiwis can provide a “piece of the puzzle needed each day, but without the other pieces of the puzzle, your immunity still may not be 100%.”

What This Means For You

Kiwis are a great source of vitamin C and can be included in a varied diet to support the immune system.

Verywell Health uses only high-quality sources, including peer-reviewed studies, to support the facts within our articles. Read our editorial process to learn more about how we fact-check and keep our content accurate, reliable, and trustworthy.
  1. Harvard T.H. Chan School of Public Health. Vitamin C.

  2. USDA: FoodData Central. Kiwifruit, green, raw.

  3. USDA: FoodData Central. Kiwifruit, ZESPRI SunGold, raw.

  4. National Institutes of Health Office of Dietary Supplements. Vitamin C: fact sheet for health professionals.

  5. Mishra S, Bentley-Hewitt K, McGhie T, et al. Effects of daily ingestion of two sungold kiwifruit for 6 weeks on metabolic and inflammatory biomarkers: a randomized, cross-over, exploratory intervention study. Foods. 2023;12(23):4236. doi:10.3390/foods12234236

  6. Bucher A, White N. Vitamin C in the prevention and treatment of the common cold. Am J Lifestyle Med. 2016;10(3):181-183. doi:10.1177/1559827616629092

  7. Academy of Nutrition and Dietetics. Vitamins minerals and supplements: do you need to take them?.

  8. Bayer SB, Heenan P, Frampton C, et al. Two gold kiwifruit daily for effective treatment of constipation in adults—a randomized clinical trial. Nutrients. 2022;14(19):4146. doi:10.3390/nu14194146

  9. USDA: FoodData Central. Oranges, raw, all commercial varieties.

  10. Nieman DC, Wentz LM. The compelling link between physical activity and the body’s defense system. Journal of Sport and Health Science. 2019;8(3):201-217. doi:10.1016/j.jshs.2018.09.009

  11. Centers for Disease Control and Prevention. NIOSH training for nurses on shift work and long work hours.

By Stephanie Brown

Brown is a nutrition writer who received her Didactic Program in Dietetics certification from the University of Tennessee at Knoxville. Previously, she worked as a nutrition educator and culinary instructor in New York City.


Source link

20 11, 2024

Dogecoin Price Prediction Puts DOGE At $2.6 In December, But Investors Move Into Altcoin Rival For 36,000% ROI

By |2024-11-20T22:40:08+02:00November 20, 2024|Crypto News, News|0 Comments

Following the recent Dogecoin price success, the meme coin has been predicted to continue its rally to $2.6 by December as the excitement around it continues to build. While the prospect of the Dogecoin price surge to new highs draws interest, many investors are shifting focus toward alternative tokens with higher ROI. One altcoin rival, WallitIQ (WLTQ), is gaining momentum with an anticipated 36,000% ROI as the WLTQ presale continues gaining traction.

The Dogecoin Price Expected To Reach $2.6 By End Of December

Analysts have predicted that the Dogecoin price could hit $2.6 in December, based on the current market momentum behind the coin. Over the years, Dogecoin (DOGE) has proven that it can capture the spotlight with massive price rallies driven largely by its engaged fan base and prominent influencers.

Despite the Dogecoin price appeal, some factors could limit its potential gains. Firstly, while beneficial in generating buzz, Dogecoin’s (DOGE) meme status may be a drawback regarding long-term stability. With newer coins emerging, Dogecoin (DOGE) faces competition from utility-based tokens.

One alternative is the WLTQ altcoin rival, which has advanced utility and high growth potential. Unlike the Dogecoin price, the WLTQ altcoin rival is positioned as more than a meme coin. Built on Ethereum’s blockchain, the altcoin rival benefits from smart contract capabilities, making it versatile for applications in DeFi and data analytics, 

Dogecoin Price Prediction Puts DOGE At .6 In December, But Investors Move Into Altcoin Rival For 36,000% ROI

WallitIQ (WLTQ): The Altcoin Rival Poised To Surpass Dogecoin (DOGE) With 36,000% ROI

With its use of AI to create a secure and efficient DeFi wallet ecosystem, WallitIQ (WLTQ) is at the forefront of revolutionizing asset ownership. Implementing AI-driven solutions and improving data security is well-positioned to address the current problems with traditional crypto wallets and create unimaginable ROI opportunities as the WLTQ presale begins.

WallitIQ’s (WLTQ) intuitive interface and AI-powered insights make managing users’ DeFi wallets easier. Thanks to insights customized to their preferences and market trends, users can maneuver DeFi more easily and without feeling overwhelmed, addressing user experience challenges. 

It is crucial to stress that one of the most important aspects of the crypto industry is asset security. WallitIQ (WLTQ) guarantees that users’ assets are secure. Its advanced fraud detection, biometric authentication, and continuous transaction monitoring protect investors’ assets.

Escrow Connect, a WallitIQ (WLTQ) feature, also makes dApp use safer. Before providing access, Escrow Connect thoroughly checks dApps for potential risks, guaranteeing that all communications are safe. WallitIQ (WLTQ) also goes above and beyond by having a top security and auditing firm, SolidProof, complete an audit of its smart contract.

WallitIQ (WLTQ) provides token holders with an easy and affordable method of paying transaction fees, saving them from switching between different cryptocurrencies to cover these expenses.

Regarding simple transactions, the platform provides a Scan and Pay QR code feature that lets users transact without worrying about manually entering addresses, reducing the possibility of mistakes and time waste.

Based on a strong AI technology foundation, WallitIQ (WLTQ) makes managing crypto portfolios easier with sophisticated risk management tools and performance monitoring. By providing crucial tools for risk management and investment tracking, WallitIQ (WLTQ)  offers investors greater control over their money and assists them in identifying opportunities to maximize possible ROIs.

To digitize all legitimate forms of identification for a simple verification process, WallitIQ (WLTQ) offers a dependable feature called Physical2Digital (P2D) that allows users to switch between their physical and secure digital wallets.

When all is said and done, this crypto wallet meets the evolving needs of modern crypto users. This altcoin rival is positioned to offer investors a 36,000% ROI from its current presale price of $0.0171. Investors are flocking from the Dogecoin price to the WLTQ altcoin rival presale as it continues making headlines in crypto.

Conclusion: Investors Making Sizeable Moves

While the Dogecoin price seems promising, WallitIQ (WLTQ) presents a special opportunity for investors prepared to take on risk to make a sizable ROI. The altcoin rival presale is selling quickly, and investors are moving to secure this ROI, leaving Dogecoin (DOGE) behind. Its listing on CoinMarketCap has also been confirmed. 

Join the WallitIQ (WLTQ) presale and community: 

Join WallitIQ (WLTQ) Presale

Join the WallitIQ (WLTQ) Community

Source link

20 11, 2024

ETH Price Stalls as Ethereum DApp Volume Surges by 38%

By |2024-11-20T22:32:07+02:00November 20, 2024|News, NFT News|0 Comments


  • Ethereum (ETH) dominates in on-chain activities as it generated $163.7 million in fees in the last 30 days against the $133.4 million recorded by Solana (SOL).
  • Ethereum also recorded an on-chain volume of $149.9 billion, outshining BNB Chain, which has a lower transaction fee. 

Ethereum (ETH) is struggling to retest its crucial resistance level at $3.2k as it declined by 1.6% in the last seven days. However, its on-chain activities look positive. In the last 30 days, Ethereum’s on-chain volume surged to $149.9 billion.

According to our research, this outpaced close competitors like the BNB Chain which only managed $26.6 billion despite offering lower fees. Specifically, ETH saw its transaction activity growing by 37.7% against the 6.6% recorded by the BNB Chain.

Within the period under review, Ethereum faced tough competition from Solana (SOL), which recorded an on-chain volume growth of 83%. According to our research, this contributed to the $8.3 billion Total Value Locked (TVL) witnessed by Solana. Despite leading deposits with $59.4 billion, Ethereum was outpaced by Solana in terms of decentralized exchange (DEX) volumes.

In the aspect of fees, Ethereum dominated with a fee generation of $163.7 million over 30 days. According to DefiLlama, Solana also recorded $133.4 million in fees, taking the second position. Interestingly, Tron generated $51 million in fees, coming third in that category. Meanwhile, the three leading Decentralized Applications (dApps) on Solana – Raydium, Jito, and Photon also had a fee generation amount of $338.5 million.

ETH Price Stalls as Ethereum DApp Volume Surges by 38%
Source: DappRadder

Ethereum (ETH) and Solana (SOL) On-chain Performance

In our research, we discovered that Solana users barely benefitted from the success of its stakes and investors. Its annual staking reward of 6.2% and equivalent SOL inflation of 5.2% implies that the adjusted gain is very small.

Ethereum, on the other hand, offers a 3.3% annualized reward rate while its equivalent ETH inflation rate stood at 0.7% or lower.

Ethereum Ethereum
Source: StakingRewards

According to analysts, Ethereum’s 2.6% adjusted return is more attractive than Solana’s 1%, unlocking institutional interest to maintain its dominance in TVL. However, its main issue is reported to be the lack of a clear strategy for achieving scalability without affecting the layer-2 ecosystem. Even that, Ethereum 3.0 is expected to reintroduce “sharding and leveraging a zero-knowledge Ethereum Virtual Machine (zkEVM) at the base layer” to improve scalability. This was disclosed by Consensys CEO Joe Lubin.

The interesting thing about that is that way of using layer 1 wasn’t possible a few years ago when we discarded the idea of execution sharding; what we needed to do was throw open this divergent exploration and a lot of stuff came back…You’re just boiling down a giant amount of computation at different layers and amortizing a lot of computation into a single transaction. If you do that every two seconds or less, then you get a lot of transactions per second.

At press time, ETH was trading at $3,100. However, its daily trading volume was 19% down with $28 billion changing hands.


Recommended for you:


Source link

20 11, 2024

Tea Tourisms Market Is Booming So Rapidly with Teanamu,

By |2024-11-20T20:56:08+02:00November 20, 2024|Dietary Supplements News, News|0 Comments


Tea Tourisms Market

HTF MI recently introduced Global Tea Tourisms Market study with 143+ pages in-depth overview, describing about the Product / Industry Scope and elaborates market outlook and status (2024-2032). The market Study is segmented by key regions which is accelerating the marketization. At present, the market is developing its presence. Some key players from the complete study are Dilmah Tea Trails, Makaibari Tea Estate, Glenburn Tea Estate, Happy Valley Tea Estate, Sikkim Tea Garden, Munnar Tea Plantations, Assam Tea Gardens, Adam’s Peak Tea Trail, Dambatenne Tea Factory, Ceylon Tea Trails, Ambootia, Chamong Tea, Darjeeling Tea Estates, Teanamu, Twinings Museum, Tregothnan, Bohea Tea Tours, Lipton Tea Experience, Tea Trails, Yorkshire Tea Tour.

Get a sample report in PDF format, complete with a table, figures, and TOC 👉 https://www.htfmarketreport.com/sample-report/2379276-global-tea-tourisms-market?utm_source=Akash_OpenPR&utm_id=Akash

According to HTF Market Intelligence, the Global Tea Tourisms market is expected to grow from 1.4 Billion USD in 2024 to 3 Billion USD by 2032, with a CAGR of 8.1% from 2024 to 2032.

The Tea Tourisms market is segmented by Types (Plantation Tours, Tea Tasting, Cultural Tours, Heritage Experiences), Application (Leisure Tourism, Culinary Tourism, Educational Tourism) and by Geography (North America, LATAM, West Europe, Central & Eastern Europe, Northern Europe, Southern Europe, East Asia, Southeast Asia, South Asia, Central Asia, Oceania, MEA).

Definition:

Tea tourism offers immersive experiences in tea plantations, blending heritage, culture, and nature, catering to eco-conscious and leisure travelers seeking unique and enriching activities.

Dominating Region:

• Asia-Pacific

Fastest-Growing Region:

• Europe

Do you have a question? Before making a buy, market an inquiry 👉 https://www.htfmarketreport.com/enquiry-before-buy/2379276-global-tea-tourisms-market?utm_source=Akash_OpenPR&utm_id=Akash

The titled segments and sub-section of the market are illuminated below:

In-depth analysis of Tea Tourisms market segments by Types: Plantation Tours, Tea Tasting, Cultural Tours, Heritage Experiences

Detailed analysis of Tank Container Shipping market segments by Applications: Leisure Tourism, Culinary Tourism, Educational Tourism

Geographically, the detailed analysis of consumption, revenue, market share, and growth rate of the following regions:

• The Middle East and Africa (South Africa, Saudi Arabia, UAE, Israel, Egypt, etc.)

• North America (United States, Mexico & Canada)

• South America (Brazil, Venezuela, Argentina, Ecuador, Peru, Colombia, etc.)

• Europe (Turkey, Spain, Turkey, Netherlands Denmark, Belgium, Switzerland, Germany, Russia UK, Italy, France, etc.)

• Asia-Pacific (Taiwan, Hong Kong, Singapore, Vietnam, China, Malaysia, Japan, Philippines, Korea, Thailand, India, Indonesia, and Australia).

Purchase the Most Recent Tea Tourisms Market Report Now 👉 https://www.htfmarketreport.com/buy-now?format=1&report=2379276?utm_source=Akash_OpenPR&utm_id=Akash

Tea Tourisms Market Research Objectives:

– Focuses on the key manufacturers, to define, pronounce and examine the value, sales volume, market share, market competition landscape, SWOT analysis, and development plans in the next few years.

– To share comprehensive information about the key factors influencing the growth of the market (opportunities, drivers, growth potential, industry-specific challenges and risks).

– To analyze the with respect to individual future prospects, growth trends and their involvement to the total market.

– To analyze reasonable developments such as agreements, expansions new product launches, and acquisitions in the market.

– To deliberately profile the key players and systematically examine their growth strategies.

FIVE FORCES & PESTLE ANALYSIS:

In order to better understand market conditions five forces analysis is conducted that includes the Bargaining power of buyers, Bargaining power of suppliers, Threat of new entrants, Threat of substitutes, and Threat of rivalry.

• Political (Political policy and stability as well as trade, fiscal, and taxation policies)

• Economical (Interest rates, employment or unemployment rates, raw material costs, and foreign exchange rates)

• Social (Changing family demographics, education levels, cultural trends, attitude changes, and changes in lifestyles)

• Technological (Changes in digital or mobile technology, automation, research, and development)

• Legal (Employment legislation, consumer law, health, and safety, international as well as trade regulation and restrictions)

• Environmental (Climate, recycling procedures, carbon footprint, waste disposal, and sustainability)

Receive a 10-25% discount when you buy now 👉 https://www.htfmarketreport.com/request-discount/2379276-global-tea-tourisms-market?utm_source=Akash_OpenPR&utm_id=Akash

Points Covered in Table of Content of Global Tea Tourisms Market:

Chapter 01 – Tea Tourisms Executive Summary

Chapter 02 – Market Overview

Chapter 03 – Key Success Factors

Chapter 04 – Global Tea Tourisms Market – Pricing Analysis

Chapter 05 – Global Tea Tourisms Market Background or History

Chapter 06 – Global Tea Tourisms Market Segmentation (e.g. Type, Application)

Chapter 07 – Key and Emerging Countries Analysis Worldwide Tea Tourisms Market

Chapter 08 – Global Tea Tourisms Market Structure & worth Analysis

Chapter 09 – Global Tea Tourisms Market Competitive Analysis & Challenges

Chapter 10 – Assumptions and Acronyms

Chapter 11 – Tea Tourisms Market Research Methodology

Key questions answered

• How Global Tea Tourisms Market growth & size is changing in next few years?

• Who are the Leading players and what are their futuristic plans in the Global Tea Tourisms market?

• What are the key concerns of the 5-forces analysis of the Global Tea Tourisms market?

• What are the strengths and weaknesses of the key vendors?

• What are the different prospects and threats faced by the dealers in the Global Tea Tourisms market?

Thanks for reading this article; you can also get individual chapter-wise sections or region-wise report versions like North America, LATAM, Europe, Japan, Australia or Southeast Asia.

Nidhi Bhawsar (PR & Marketing Manager)

HTF Market Intelligence Consulting Private Limited

Phone: +15075562445

sales@htfmarketreport.com

About Author:

HTF Market Intelligence Consulting is uniquely positioned to empower and inspire with research and consulting services to empower businesses with growth strategies. We offer services with extraordinary depth and breadth of thought leadership, research, tools, events, and experience that assist in decision-making.

This release was published on openPR.


Source link

20 11, 2024

EUR/USD Analysis Today – 20/11: Rebounds, Still Weak (Chart)

By |2024-11-20T20:41:43+02:00November 20, 2024|Forex News, News|0 Comments

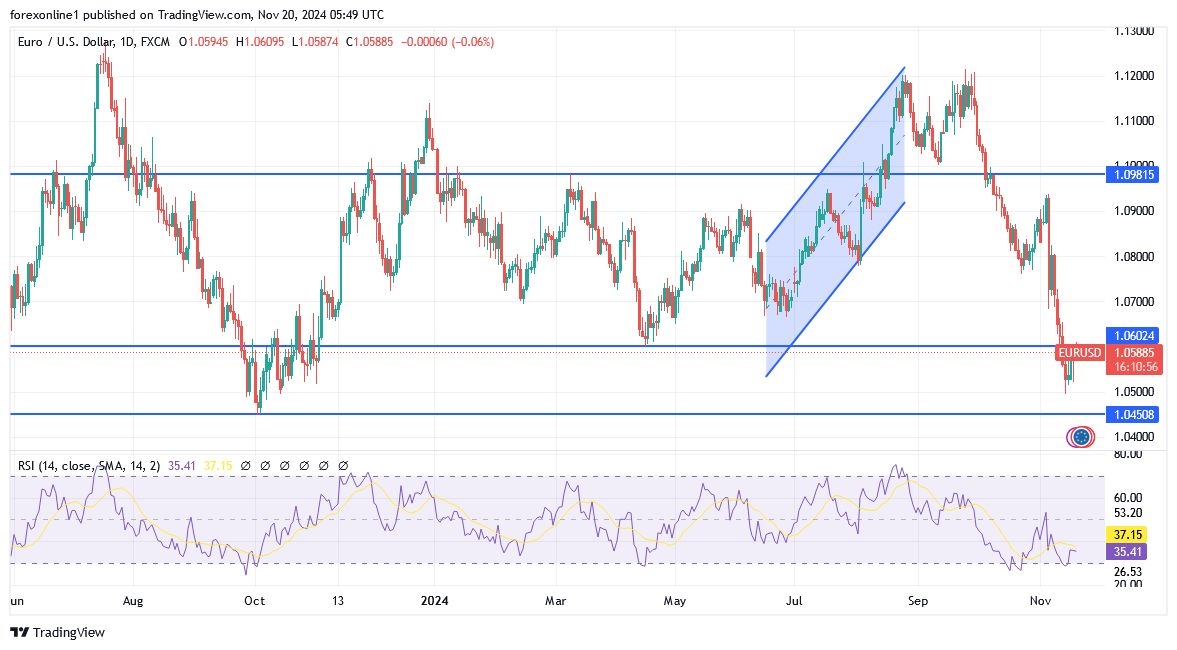
  • For four consecutive trading sessions, the EUR/USD currency pair has been attempting to rebound and recover from its lowest levels in a year, which reached the support level of 1.0496 at the end of last week.
  • This is due to the strength of Trump’s trade policies, which provided further strength to the US dollar against other major currencies. The rebound gains for the EUR/USD pair did not exceed the level of 1.0609 before stabilizing around the level of 1.0588 at the time of writing this analysis, awaiting further stimulation to avoid further collapse.

Factors Weakening the Euro Price Performance

According to the Forex market trading, the euro’s losses came primarily in light of the impact of investor sentiment on concerns about the impact of US trade tariffs on Eurozone growth and geopolitical tensions. Investors have been buying safer assets, especially after Ukraine used Western-made missiles to strike Russia, and in return, Russian President Vladimir Putin expanded Russia’s nuclear doctrine to allow nuclear responses to major conventional attacks.

In addition, European Central Bank officials warned that new US tariffs could harm economic growth in the Eurozone, reducing inflation concerns. The European Central Bank has cut interest rates three times since last June, as inflation is approaching its target of 2%, but growth forecasts have been cut twice. In general, financial markets largely expect the ECB to cut interest rates by 25 basis points next month, with a smaller chance of a larger move.

European Stocks Continue to Suffer Losses

According to stock trading platforms, selling pressure continues on the performance of European stock market indices in yesterday’s trading, Tuesday. The Stoxx 50 fell 0.9% and the Stoxx 600 fell 0.4%, closing at its lowest in more than three months and posting its third straight session of losses.

Most sectors were lower, with banks down 1.4% and travel stocks down 1%. Meanwhile, healthcare stocks rose 0.6%. furthermore, Investors moved towards safe-haven assets after Russia announced expanded terms for nuclear retaliation. Earnings updates, however, offered mixed signals: Imperial Brands reported a better-than-expected 4.6% rise in annual profit, while Germany’s Thyssenkrupp pointed to challenges at its steel division with a €1 billion impairment. Caixabank shares fell 5% after unveiling a new strategy, and Nestlé shares fell 1.9% as it announced further cost-cutting measures.

What will affect the performance of the Euro Dollar today?

According to economic data, the EUR/USD price today will be affected by the announcement of the German producer price index reading and expected statements from European Central Bank Governor Lagarde to look for signals from bank officials about the future of the ongoing easing cycle considering European political and economic concerns and under a US administration led by Trump. Later today, the EUR/USD will also be affected by new statements from some US Federal Reserve policy makers.

EUR/USD Technical Analysis

According to recent trades, the EUR/USD currency pair has formed lower consecutive peaks with a downward trend line that has been steady since last October. Technically, the price is rising from its lowest levels around 1.0490 and may be about to test the resistance zone. At the same time, Fibonacci retracement levels on the latest swing high and low show that the 61.8% Fibonacci level is closest to the trendline around the 1.0775 level. Meanwhile, the 50% level coincides with the dynamic resistance of the 100 simple moving average at 1.0721. therefore, the minor correction may actually find sellers at the 38.2% Fibonacci at 1.0666.

Overall, if either of these levels hold as resistance, EUR/USD could make its way back to the swing low or lower. Also, the 100 SMA is below the 200 SMA to indicate that the stronger trend is down or that the downtrend is likely to resume rather than reverse. As per the technical indicators, the Stochastic is already in the overbought zone, so a downward shift suggests that selling pressure is ready to increase. The oscillator has plenty of room to slide before reaching the oversold zone, so the price could continue to follow the same trend. On the other hand, the RSI has room to rise before reaching overbought levels, so the correction could continue until that happens. However, a break above the trend line and the dynamic turning point of the 200 SMA could signal the beginning of a reversal.

EUR/USD Signals:

Dear reader, we advise you to monitor the movement of the Euro against the US Dollar EUR/USD price around and below the support level of 1.0500 to look for buying levels for the Euro Dollar, waiting for an opportunity to rebound upwards. Decisively, by considering not taking risks and activating profit limit and stop loss orders to ensure the safety of your trading account from any sudden price reversals. To get EUR/USD recommendations and other free direct trading signals through our website, register your presence with us.

Ready to trade our daily EUR/USD Forex analysis? We’ve made this forex brokers list for you to check out. 

Source link

20 11, 2024

Is XRP About to Smash $5 Price Target with JetBolt Surge?

By |2024-11-20T20:39:19+02:00November 20, 2024|Crypto News, News|0 Comments

While XRP aims for $5 after hitting a three-year high of $1.263, a young altcoin surpasses expectations with its impressive presale milestone— (JBOLT). Since its presale began in August 2024, JetBolt has already sold over 66 million tokens. 

JetBolt’s groundbreaking innovations could be fueling the presale frenzy. JetBolt boasts a revolutionary zero-gas technology feature, allowing users to carry out transactions without paying hefty gas fees. This game-changing feature also makes it easier for developers to create a wide range of dApps—from NFTs and gaming to SocialFi—without worrying about expensive gas fees. 

In addition, JetBolt makes staking fun and less complex with its crypto-staking platform. Stakers have the potential to earn bonus tokens and earn more by connecting and engaging with their friends on the platform. 

Moreover, JetBolt provides token holders with an AI-powered tool that can help them stay updated with current blockchain news and developments. With such innovative features, it’s no surprise that whales and buyers are eager to accumulate JetBolt tokens during the presale. 

Adding to the excitement surrounding the JetBolt presale is its special perks for early buyers. They can get up to 25% more tokens by purchasing or buying JetBolt (JBOLT) tokens in batches. 

With its cutting-edge features and presale benefits that have captured the attention of buyers, JetBolt shines as one of the next-gen altcoins to watch. 

Source link

20 11, 2024

XAU/USD now retargets the $2,700 region

By |2024-11-20T20:19:23+02:00November 20, 2024|Forex News, News|0 Comments


  • Gold prices extended their uptrend despite alleviating geopolitical jitters.
  • The US Dollar regained composure and advanced to weekly tops.
  • XAU/USD maintains the bullish note well north of $2,600/oz.

On Wednesday, Gold prices continued their ascent despite geopolitical tensions mitigated somewhat along with the appetite for safe-haven assets. Heightened anxiety over the Russia-Ukraine conflict, coupled with broader uncertainty in global markets, has been underpinning the strong weekly rebound in the precious metal for the time being.

The yellow metal, however, is expected to remain under scrutiny in the next few weeks as recent US economic data, coupled with expectations that Republican policies could fuel inflation, have increased the likelihood of interest rates staying elevated for an extended period. While gold is traditionally viewed as a hedge against inflation, higher interest rates make the non-yielding metal less attractive to investors.

So far this week, Gold prices surged past the recently breached $2,600 mark per troy ounce, finding decent resistance around the 55-day Simple Moving Average (SMA) above $2,640, which emerges as a noticeable hurdle as it seeks to build on its recovery momentum.

The yellow metal’s rebound was also supported by a softer US Dollar (USD), which has struggled to maintain the strength it gained during its Trump-trade rally. Adding to the bullish narrative, US Treasury yields have lost steam across multiple maturities, providing further breathing room for Gold prices.

Looking ahead, this week’s spotlight will turn to a series of key global economic data releases, with preliminary Purchasing Managers’ Indexes (PMIs) taking the lead. Market participants will also be tuning in to comments from central bank officials, particularly in the wake of Fed Chair Jerome Powell’s recent cautious stance. On this, let’s recall that Powell highlighted the resilience of the US economy but reiterated the need for prudence when considering future rate cuts.

From a positioning standpoint, speculative interest in gold has softened. Non-commercial traders reduced their net long positions to approximately 236.5K contracts as of November 12—the lowest level since early June, according to the latest CFTC report. This decline in long positions coincides with a second straight drop in open interest, which could prop up some loss of traction from the recent downtrend in gold prices.

XAU/USD short-term technical outlook

The daily chart of XAU/USD indicates a clear break above the bullish 100-day Simple Moving Average (SMA) above $2,550, which is close to the November low of $2,536. Further up comes the current weekly high of $2,650 (November 20) corresponds with the transitory 55-day SMA, confirming this first resistance zone. Up from here, the next minor objective is the $2,700 barrier, prior to the weekly top of $2,749 (November 5).

On the other side, a rapid breach of the temporary 100-day SMA at $2,554 should draw attention to the November low of $2,536 (November 14).

In the short term, the 4-hour chart indicates that the current recovery has more space to go. The Relative Strength Index (RSI) has recovered but confronts resistance at 65, while the Average Directional Index (ADX) near 34 suggests a lack of significant trend momentum for the time being.

On the upside, the next resistance level to monitor is $2,650, followed by the more important 200-SMA at $2,677. On the downside, support remains solid around $2,536, a critical level to monitor if prices reverse course.


Source link

20 11, 2024

Are Your Kids’ Melatonin Supplements Safe? FDA Study Raises Concerns Over Mislabeled Doses

By |2024-11-20T18:55:08+02:00November 20, 2024|Dietary Supplements News, News|0 Comments


Melatonin use for children is on the rise, with nearly one in five school-aged kids taking it to fall asleep, according to one estimate. But a new study by researchers at the Food and Drug Administration has found that many products marketed for kids contain a lot more melatonin than their packaging suggests. 

“This study raises a very important flag for much-needed regulations concerning supplement standard testing to make sure labeling is accurate and safe for pediatric products,” Sham Singh, MD, a sleep expert and psychiatrist at WINIT Clinic, told Health.

The research builds on previous findings, including smaller studies from 2017 and 2023, which found that most tested melatonin supplements geared for both children and adults were inaccurately labeled.

Here’s what else to know about this new research, whether experts think kids should use melatonin for sleep, and how to help your little ones fall asleep without using a sleep aid.

Melatonin is a hormone that tells your body it’s time to sleep. The pineal gland, located in the middle of the brain, secretes it at higher levels when it’s dark outside and then decreases production as it gets lighter. 

Melatonin is also sold as a sleep aid online and in drug stores. It comes in various forms, from tablets and capsules to liquid and gummies.

As a supplement, melatonin is largely unregulated by the FDA. That means there’s no assurance to the public that it works, won’t interact with medications, or even contains what its label suggests.

An FDA spokesperson told Health that the increased use of melatonin for kids motivated the agency to conduct “additional research to better understand the marketplace.”

For the study, researchers purchased melatonin products between May and September 2023 from Walgreens, CVS, Walmart, Target, GNC, or Amazon. Most of the items—54%—were gummies, followed by tablets and liquid. The products, 70% of which were marketed to kids, were tested to assess how much melatonin they actually contained.

What the researchers found was eye-opening: Only half of the products contained the amount of melatonin suggested by the package, and two items contained none at all. 

Even more concerning is that some products packed in way more melatonin than advertised—one sample had a staggering 667% of the dosage listed. While the average dosage of 1.7 milligrams (mg) per serving fell within safe limits for pediatric consumption, the highest dose tested—50 mg per serving—far exceeded recommended levels for children, which the American Academy of Pediatrics puts at 0.5 to 6 mg.

Given the variability in melatonin dosage across products, experts advise parents to proceed cautiously. The FDA spokesperson suggested that people talk to their doctor, pharmacist, or other healthcare professional before using a dietary supplement for their child.

If parents do decide to give their children melatonin, experts said it’s best to limit the length of time that they use the products.

Despite experts’ longtime recommendation that melatonin be used “only cautiously as a short-term aid for children with specific sleep disorders, under pediatric guidance,” Singh said, studies show that many parents are giving melatonin to their children for 12 to 21 months or even longer. “There is not enough information to back up the safety of long-term use,” Michelle Caraballo, MD, a pediatric pulmonologist and sleep medicine specialist at Children’s Health in Dallas and an associate professor at the University of Texas Southwestern Medical Center, told Health.

Parents interested in melatonin for their kids should choose products from reputable and independently tested companies. A seal from third-party companies such as the U.S. Pharmacopeia and Consumerlab.com indicates that the supplement has been tested for identity and purity.

However, “while there may be brands more trusted or accurate, without oversight, even those brands cannot 100% guarantee that their product contains exactly the amount reported,” Caraballo said.

When using melatonin as a sleep aid, Caraballo said it’s important to look for signs that your child may have had too much. Short-term side effects may include:

Singh said that these latest findings may prompt healthcare professionals to place more of an emphasis on non-pharmaceutical options for sleep relief rather than melatonin use.

Whether you choose to give melatonin or not, having good “sleep hygiene”—the routine around bedtime—is incredibly important when it comes to helping your kids doze off faster. “Make sure that the room your child is sleeping in is slightly on the chillier side and that no extra lights are on,” said Caraballo. If they’re old enough, try to avoid having your child nap during the day, and it’s best if dinner is at least two hours before bedtime.

“Beyond these recommendations, establishing a bedtime routine and limiting electronic usage before bed helps children to reinforce their circadian rhythm,” Caraballo said. Instead, substitute screen time with wind-down activities, such as reading a book or listening to soothing music, Singh recommended.


Source link

20 11, 2024

Tumbles below 1.2700 after hot UK CPI: Analytics and Market news from 20 November 2024 15:18

By |2024-11-20T18:40:38+02:00November 20, 2024|Forex News, News|0 Comments

British Pound PRICE Today

The table below shows the percentage change of British Pound (GBP) against listed major currencies today. British Pound was the strongest against the New Zealand Dollar.

  USD EUR GBP JPY CAD AUD NZD CHF
USD   0.61% 0.18% 0.31% 0.35% 0.66% 0.72% 0.18%
EUR -0.61%   -0.43% -0.31% -0.27% 0.03% 0.09% -0.43%
GBP -0.18% 0.43%   0.10% 0.16% 0.46% 0.52% -0.01%
JPY -0.31% 0.31% -0.10%   0.05% 0.35% 0.40% -0.12%
CAD -0.35% 0.27% -0.16% -0.05%   0.31% 0.37% -0.16%
AUD -0.66% -0.03% -0.46% -0.35% -0.31%   0.06% -0.46%
NZD -0.72% -0.09% -0.52% -0.40% -0.37% -0.06%   -0.53%
CHF -0.18% 0.43% 0.00% 0.12% 0.16% 0.46% 0.53%  

The heat map shows percentage changes of major currencies against each other. The base currency is picked from the left column, while the quote currency is picked from the top row. For example, if you pick the British Pound from the left column and move along the horizontal line to the US Dollar, the percentage change displayed in the box will represent GBP (base)/USD (quote).


Source link

Go to Top