The euro tumbled against the Japanese yen on Tuesday, driven by heightened market anxiety over reports of Russia easing nuclear weapon restrictions following Ukraine’s launch of six NATO-provided missiles into Russian territory.
Because of this, there was a rush to safety and Europe wasn’t exactly the place people wanted to run to.
So, it all sets up for an obvious trade here.
That being said, it looks like cooler heads have prevailed and the 161.50 yen level has offered enough support to turn things around and form a bit of a hammer. The 163.50 level is an area that’s been like a bit of a magnet for price and previously it had been major resistance. So, the fact that we’re there again does make me very interested in this EUR/JPY pair, as this could be some kind of signal on where we go overall.Top Forex Brokers1 Get Started 74% of retail CFD accounts lose money If We Can Break HigherIf we can turn around and break above the highs of the trading session on Monday, then we may have the juice to go looking to the 165 yen level, possibly even the 166.50 yen level. Longer term, I still think this pair goes higher, mainly due to the fact that the Japanese have absolutely no way whatsoever to tighten monetary policy in any meaningful manner otherwise, they will trash the Japanese economy. If there is a run to safety for whatever reason, if we break down below the 161 yen level, then I think the bottom in this pair falls apart. And you probably then start to see Japanese yen strength against pretty much everything. All things being equal though, the Japanese are somewhat stuck. And I think that even the lowly euro will continue to find buyers against it although it might be a choppy road on the way higher.EURUSD Chart by TradingViewWant to trade our daily forex analysis and predictions? Here’s a list of forex brokers in Japan to check out.
MENAFN20112024000131011023ID1108905431
Legal Disclaimer: MENAFN provides the information “as is” without warranty of any kind. We do not accept any responsibility or liability for the accuracy, content, images, videos, licenses, completeness, legality, or reliability of the information contained in this article. If you have any complaints or copyright issues related to this article, kindly contact the provider above.
Meme coin Dogecoin seems like it is starting to consolidate just below the $0.4 price level. Particularly, the Dogecoin price has traded below $0.4 in the last five days, reaching a low of $0.343. This DOGE price performance is unsurprisingly going to lead to the notion of whether it has already reached its price top this bull cycle.
However, not every market participant agrees with this thought process. According to technical analysis from crypto analyst Kevin (@Kev_Capital_TA), the Dogecoin price is currently nowhere near its top this cycle.
Where Is Dogecoin Price Top This Cycle?
The Dogecoin price rally has slowed down since it reached a three-year high of $0.4265 on November 13. However, with the aid of an intriguing technical indicator, Kevin highlighted that the Dogecoin price still has a lot of room to run. His analysis suggests that DOGE’s price top for this cycle could reach $3.9, a level that would effectively quadruple its current all-time highs.
Kevin’s forecast relies heavily on a unique application of the Pi Cycle tops indicator, a tool traditionally used for Bitcoin but, as he notes, has proven surprisingly accurate in tracking the Dogecoin price behavior every cycle. He explains that the indicator, which combines two moving averages with the Monthly Relative Strength Index (RSI), has accurately predicted the Dogecoin price tops and bottoms over the years. Particularly, the weekly candlestick Dogecoin price chart that accompanied this outlook shows that the Pi Cycle accurately predicted Dogecoin’s cycle tops and bottoms in 2018 and 2021.
The analyst observed that although the moving averages in Dogecoin’s Pi Cycle tops indicator are heading in the same direction, they are still far from crossing. This suggests that Dogecoin has substantial room for upward movement before reaching the anticipated peak.
Source: X
Dogecoin Price Top At $3.9: What It Means
Kevin’s predicted price top of $3.9 is derived from the 1.618 Fibonacci extension level when projected from this cycle’s Pi Cycle low. This approach mirrors historical Dogecoin price performance, where previous cycle tops in 2018 and 2021 coincided with the same Fibonacci extension level from their respective Pi Cycle lows. The analyst further highlighted intermediate price ranges to monitor, including $0.9 to $1.3 and $2.3 to $2.7, as milestones on the way to the predicted cycle peak.
A $3.9 Dogecoin price would put its market cap around $572 billion, considering its current total circulating supply of 146.86 billion DOGE tokens. Such a huge market cap would see Dogecoin overtaking even Ethereum in market cap rankings, suggesting the latter price doesn’t grow at the same pace as the former.
At the time of writing, Dogecoin is trading at $0.389, up by 3.5% in a 24-hour timeframe and down by 5.2% in a seven-day timeframe. Attaining the $3.9 Dogecoin price target would represent a 902% increase from the current price.
SEED releases a video daily where users can learn about blockchain and cryptocurrency while earning rewards. Each day, a new YouTube video contains a hidden code. By identifying and entering this code in the SEED app, users can claim reward points.
Today’s SEED Video Code For November 20, 2024
The video released today is titled “#14 SEED NFT Introduction”, and the code for this video is MARKETMAKER.
Users can watch the video in the “Academy” section of the SEED app or on SEED’s YouTube channel. Entering the code allows users to earn reward points that are added to their SEED balance.
Recent SEED YouTube Video Codes
If you have missed previous codes, here is a list of all recent video codes that you can use to earn SEED points:
Learn Blockchain in 3 Minutes – Code: Blockchain
Crypto vs Blockchain – Code: Cryptocurrency
Hot vs Cold Wallet – Code: Wallet
What is Airdrop? – Code: Airdrop
Coin vs Token – Code: Tokens
What is TON? – Code: Ton
News Affecting the BTC Price (November 5) – Code: BTCTOTHEMOON
On-chain vs Off-chain #8 (November 6) – Code: TRANSACTION
Bullish and Bearish #10 (November 12) – Code: BULLRUN
In addition to the YouTube video codes, SEED offers several other opportunities for earning rewards:
Daily Login Bonus: Users receive rewards for logging into the SEED app regularly.
Engaging with Social Media: Subscribing to SEED’s Telegram and YouTube channels provides additional earning opportunities while keeping users informed.
Community Participation: Joining blockchain communities like GameFi.org allows users to engage with others and earn rewards.
SEED’s referral program allows users to invite friends and earn rewards. Both the inviter and the friend receive rewards for joining, and the inviter earns a percentage of the friend’s future rewards:
Regular Referral: Both participants earn 2 points, and the inviter receives 10% of the friend’s rewards.
Telegram Premium Referral: Both participants earn 10 points, and the inviter receives 20% of the friend’s rewards.
More than half of the people who go to gyms are women, according to the Health & Fitness Association’s 2023 IHRSA Global Report. Yet despite vast physiological differences between men and women, only 2.5% of sports nutrition products are targeted to female consumers. Opportunity in this space is knocking louder than the Metallica bassline in a Peloton Metal Ride soundtrack.
While a huge uptick has taken place in new products addressing needs at different ages, “There is so much more to women’s health than just the obvious female life stages, and active nutrition is an area where we can do better than just rebranding or redosing products basically designed for men and offering them to women,” Jennifer Cooper, industry expert and director of Leadpoint Solutions, said. “Products that don’t actually formulate specifically for women are missing a tremendous opportunity to validate and address the important physiological differences unique to women.”
“Pink it and shrink it” days are gone. Ola Lessard, managing partner of 9 Muses Marketing — which specializes in reaching female consumers — said brands need to develop “a relationship of trust” to win the loyalty of female consumers. She added that women tend to do more research on their purchases than their male counterparts.
Pointing to a concerning stat from Yankelovich Monitor and Greenfield Online, Lessard continued, “91% of women believe advertisers don’t understand them.”
Research also shows that active women have a higher level of awareness of health-beneficial ingredients as compared to women who are less active.
Savvy brands who can tell their science and benefit stories to women in a way that resonates with them may have enormous opportunity. But how to do it?
“Marketing to women is pretty much like setting up a good online dating profile,” Lessard suggested. “Don ’t be pushy. Don’t be creepy. Don’t talk about yourself all the time. Let us see that you understand our lives, our fears, our burdens, ours stresses, our joys — and earn our trust.”
GBP/USD trades slightly above 1.2700 in the European morning on Wednesday.
October inflation figures from the UK came in above market expectations.
The technical outlook points to a bullish tilt in the near term.
GBP/USD trades in positive territory slightly above 1.2700 early Wednesday as markets assess latest inflation readings from the UK. The pair’s near-term technical picture highlights a buildup of recovery momentum.
British Pound PRICE Today
The table below shows the percentage change of British Pound (GBP) against listed major currencies today. British Pound was the strongest against the Japanese Yen.
USD
EUR
GBP
JPY
CAD
AUD
NZD
CHF
USD
0.12%
-0.20%
0.59%
0.00%
0.16%
0.26%
0.24%
EUR
-0.12%
-0.32%
0.48%
-0.12%
0.03%
0.13%
0.11%
GBP
0.20%
0.32%
0.77%
0.20%
0.35%
0.45%
0.44%
JPY
-0.59%
-0.48%
-0.77%
-0.60%
-0.45%
-0.36%
-0.37%
CAD
-0.00%
0.12%
-0.20%
0.60%
0.16%
0.26%
0.24%
AUD
-0.16%
-0.03%
-0.35%
0.45%
-0.16%
0.10%
0.08%
NZD
-0.26%
-0.13%
-0.45%
0.36%
-0.26%
-0.10%
-0.02%
CHF
-0.24%
-0.11%
-0.44%
0.37%
-0.24%
-0.08%
0.02%
The heat map shows percentage changes of major currencies against each other. The base currency is picked from the left column, while the quote currency is picked from the top row. For example, if you pick the British Pound from the left column and move along the horizontal line to the US Dollar, the percentage change displayed in the box will represent GBP (base)/USD (quote).
The UK’s Office for National Statistics reported that annual inflation in the UK, as measured by the change in the Consumer Price Index (CPI), climbed to 2.3% in October from 1.7% in September, surpassing the market expectation of 2.2%. Additionally, the Core CPI, which excludes volatile food and energy prices, rose 3.3% in the same period, up from 3.2% in September. On a monthly basis, the CPI increased 0.6% after staying unchanged in September.
According to Reuters, UK rate futures point to 59 basis points (bps) of Bank of England (BoE) rate cuts by the end of 2025, vs 64 bps before stronger-than-forecast UK inflation data.
In the second half of the day, BoE Deputy Governor Sarah Breeden and Deputy Governor Dave Ramsden will be delivering speeches. While testifying before the UK Treasury Select Committee on Tuesday, BoE Governor Andrew Bailey noted that a gradual approach to removing monetary policy restraint will help them observe risks to the inflation outlook. In case BoE officials adopt a cautious tone regarding further policy easing, citing latest inflation readings, GBP/USD could continue to stretch higher.
The US economic calendar will not offer any high-impact macroeconomic data releases on Wednesday. Meanwhile, investors will keep a close eye on headlines surrounding the Russia-Ukraine conflict. A further escalation of geopolitical tensions could help the US Dollar (USD) stay resilient against its rivals and limit GBP/USD’s upside.
GBP/USD Technical Analysis
The Relative Strength Index (RSI) indicator on the 4-hour chart climbed above 50 early Wednesday, highlighting an increasing buyer interest. GBP/USD was last seen trading slightly above 1.2700, where the Fibonacci 23.6% retracement level of the latest downtrend is located. In case the pair confirms this level as support, it could face next resistance at 1.2740-1.2750 (50-period Simple Moving Average (SMA), Fibonacci 38.2% retracement) before 1.2800 (Fibonacci 50% retracement).
If GBP/USD fails to stabilize above 1.2700 and retreats below this level, the 20-period SMA at 1.2650 could be seen as next support ahead of 1.2600 (static level).
Inflation FAQs
Inflation measures the rise in the price of a representative basket of goods and services. Headline inflation is usually expressed as a percentage change on a month-on-month (MoM) and year-on-year (YoY) basis. Core inflation excludes more volatile elements such as food and fuel which can fluctuate because of geopolitical and seasonal factors. Core inflation is the figure economists focus on and is the level targeted by central banks, which are mandated to keep inflation at a manageable level, usually around 2%.
The Consumer Price Index (CPI) measures the change in prices of a basket of goods and services over a period of time. It is usually expressed as a percentage change on a month-on-month (MoM) and year-on-year (YoY) basis. Core CPI is the figure targeted by central banks as it excludes volatile food and fuel inputs. When Core CPI rises above 2% it usually results in higher interest rates and vice versa when it falls below 2%. Since higher interest rates are positive for a currency, higher inflation usually results in a stronger currency. The opposite is true when inflation falls.
Although it may seem counter-intuitive, high inflation in a country pushes up the value of its currency and vice versa for lower inflation. This is because the central bank will normally raise interest rates to combat the higher inflation, which attract more global capital inflows from investors looking for a lucrative place to park their money.
Formerly, Gold was the asset investors turned to in times of high inflation because it preserved its value, and whilst investors will often still buy Gold for its safe-haven properties in times of extreme market turmoil, this is not the case most of the time. This is because when inflation is high, central banks will put up interest rates to combat it. Higher interest rates are negative for Gold because they increase the opportunity-cost of holding Gold vis-a-vis an interest-bearing asset or placing the money in a cash deposit account. On the flipside, lower inflation tends to be positive for Gold as it brings interest rates down, making the bright metal a more viable investment alternative.
Cardano is once again grabbing central attention as the cryptocurrency seems to be moving toward claiming a new high. ADA is up 5% in the last 24 hours, trading at $0.78, a new price high as Bitcoin breached a new price spot of $94K. Will ADA continue to establish robust price levels along these lines? Let’s find out.
Cardano is once again rising high on the radar. The token currently sits at $0.78, a few points away from claiming the ambitious $1. Investor sentiment towards the token has also accelerated, with investors building anticipation of whether the token can truly claim the coveted $1 price mark in the current bull season.
Cardano’s current price high is the result of the market’s overall bullish momentum. The token has claimed a new high as Bitcoin broke another milestone by surpassing the $93K mark to sit at $94K briefly.
Similarly, CryptoRus, a leading financial platform on X, shared another striking analysis, claiming how Cardano can soon hit a $6 mark if the token continues to leverage the current price momentum and attention.
The platform put up an ADA price chart earlier shared by noteworthy analyst Ali, claiming that if ADA follows a similar pattern that it followed in the last bull cycle, the token can breach the $6 milestone, a truly ambitious trajectory for the token to claim and conquer.
The portal also shared a timeline for ADA to claim the $6 price mark. If ADA continues to leverage the current market momentum, it may claim the aforementioned price level by July–September 2025.
“This chart suggests that if $ADA follows a similar pattern to last cycle, we could see $6 ADA by July-September 2025. This could be a conservative prediction considering Cardano may be working closely with @DOGE soon 👀 Chart: ali_charts.”
This chart suggest that if $ADA follows a similar pattern to last cycle, we could see $6 ADA by July-September 2025
This could be a conservative prediction considering Cardano may be working closely with @DOGE soon 👀
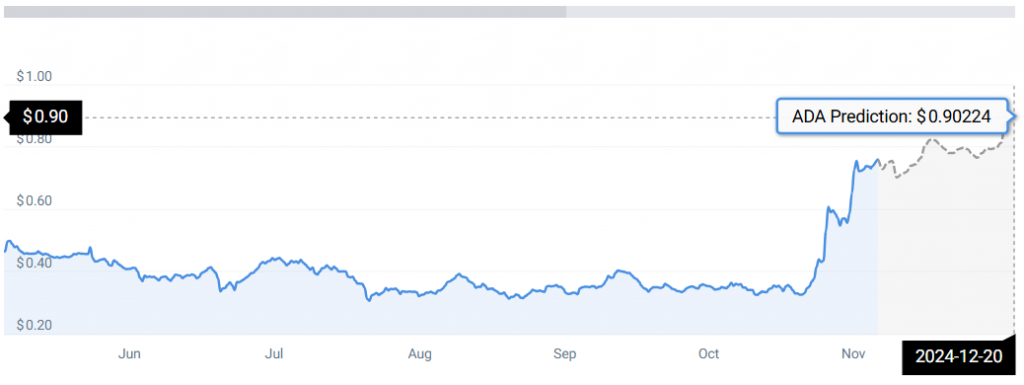
Per CoinCodex, ADA is consistently rising high on the radar and may continue to follow the same path this month. Per CC, ADA may sit at $0.90 by the end of this month, rising 18% in the process.
Image: CoinCodex
“According to our current Cardano price prediction, the price of Cardano is predicted to rise by 18.21% and reach $0.90224 by December 20, 2024. Per our technical indicators, the current sentiment is bullish while the Fear & Greed Index is showing 90 (extreme greed). Cardano recorded 19/30 (63%) green days with 32.10% price volatility over the last 30 days. Based on the Cardano forecast, it’s now a good time to buy Cardano.”
Gold price trades in the green for the third straight day on Wednesday, nears $2,650.
Gold price gains on geopolitical risks and steady US Dollar even as Treasury bond yields recover.
Gold price closes on 50-day SMA resistance at $2,660 amid bearish daily RSI.
Gold price stays on the front foot early Wednesday, looking to regain the $2,650 barrier as the road to recovery extends for the third straight day. Traders now await the upcoming speeches from US Federal Reserve (Fed) policymakers and Nvidia’s earnings report amid lingering geopolitical concerns between Russia and Ukraine.
Gold price looks to geopolitics and Fedspeak for fresh directives
The US Dollar (USD) seems to find fresh demand in Asian trading on Wednesday, tracking the uptick in the US Treasury bond yields as broader market sentiment improves on China’s stimulus hopes.
Markets were cautious earlier following the People’s Bank of China’s (PBOC) inaction on the Loan Prime Rates (LPR). However, expectations that China will roll out more stimulus to prop up the economy are lifting the market mood.
Further, worries over a further geopolitical escalation between Russia and Ukraine seem to fade, lifting risk appetite.
However, Gold buyers refuse to give up so far, anticipating a shift in risk sentiment if the American AI giant Nvidia Inc.’s earnings report disappoints and triggers a wave of risk aversion across the financial markets.
Also, the developments surrounding Russia and Ukraine will be closely eyed, keeping the demand for the traditional safe-haven Gold price underpinned.
On Tuesday, Russia’s Defence Ministry said that Ukraine fired six US-made Army Tactical Missile Systems (ATACMS) missiles at Bryansk region, just days after US President Joe Biden allowed the Ukrainian use of American-made weapons to strike inside Russia.
The Kremlin confirmed Tuesday that they lowered the threshold for a possible nuclear strike in response to non-nuclear attacks on Russia.
Besides, the Fedspeak will help gauge the US central bank’s path forward on interest rates, with markets now pricing in a 60% chance that the Fed will cut rates by 25 basis points (bps) in December.
Gold price technical analysis: Daily chart
The short-term technical outlook for Gold price remains the same, with traders likely to adopt a ‘sell on bounce’ trade strategy as the 14-day Relative Strength Index (RSI) remains below the 50 level. The indicator is currently trading near 47.
An impending Bear Cross adds credence to the downside potential. The 21-day Simple Moving Average (SMA) is looking to cross the 50-day SMA above. If that happens on a daily closing basis, it will validate the bearish crossover.
That said, failure to find acceptance above the 50-day SMA at $2,660 on a daily closing basis could reinforce sellers toward the $2,600 threshold.
The previous day’s low of $2,610 will be tested ahead of that.
On the flip side, the immediate resistance is seen at the 50-day SMA, above which the 21-day SMA at $2,682 will come into play.
Additional recovery could face stiff resistance at the $2,700 threshold.
Gold FAQs
Gold has played a key role in human’s history as it has been widely used as a store of value and medium of exchange. Currently, apart from its shine and usage for jewelry, the precious metal is widely seen as a safe-haven asset, meaning that it is considered a good investment during turbulent times. Gold is also widely seen as a hedge against inflation and against depreciating currencies as it doesn’t rely on any specific issuer or government.
Central banks are the biggest Gold holders. In their aim to support their currencies in turbulent times, central banks tend to diversify their reserves and buy Gold to improve the perceived strength of the economy and the currency. High Gold reserves can be a source of trust for a country’s solvency. Central banks added 1,136 tonnes of Gold worth around $70 billion to their reserves in 2022, according to data from the World Gold Council. This is the highest yearly purchase since records began. Central banks from emerging economies such as China, India and Turkey are quickly increasing their Gold reserves.
Gold has an inverse correlation with the US Dollar and US Treasuries, which are both major reserve and safe-haven assets. When the Dollar depreciates, Gold tends to rise, enabling investors and central banks to diversify their assets in turbulent times. Gold is also inversely correlated with risk assets. A rally in the stock market tends to weaken Gold price, while sell-offs in riskier markets tend to favor the precious metal.
The price can move due to a wide range of factors. Geopolitical instability or fears of a deep recession can quickly make Gold price escalate due to its safe-haven status. As a yield-less asset, Gold tends to rise with lower interest rates, while higher cost of money usually weighs down on the yellow metal. Still, most moves depend on how the US Dollar (USD) behaves as the asset is priced in dollars (XAU/USD). A strong Dollar tends to keep the price of Gold controlled, whereas a weaker Dollar is likely to push Gold prices up.
Boba tea is a popular drink mostly made of tea, tapioca pearls, and milk. One of its popular flavour is matcha. Know if there are any matcha boba tea benefits.
You may have not yet tried it, but you must have definitely heard about boba tea or bubble tea or pearl milk tea. It comes in a variety of flavours like black milk tea, mango tea and, strawberry milk tea. Another popular one is matcha boba tea, which is made from matcha, a type of powdered green tea, along with milk, sugar, and tapioca pearls. Apart from the vibrant green colour, the tapioca pearls that bounce around at the bottom of the glass make this drink very appealing. The good news is that there are matcha boba tea benefits that makes it a good addition to your diet.
What is matcha boba tea?
Boba tea or bubble tea is a drink that has roots in Taiwan, but is now widely consumed across the world. Many young people drink at least a cup of boba tea per day or three cups in a week, according to research published in the Frontiers In Psychiatry journal in 2022. It has a tea base, usually black, green or white, and is mixed with milk and tapioca pearls, which have a chewy and slippery texture.
Boba tea is also called bubble tea. Image courtesy: Shutterstock
“One of the most popular flavours is matcha boba tea, which has a slightly bitter taste due to matcha,” says nutritionist Diksha Dayal. The pearls are made of tapioca starch or flour, water and brown sugar, which adds sweetness to the drink. A unique textural dimension to the drink is given by the chewy tapioca pearls. Milk, usually whole milk or plant-based milk such as almond or soy, is also added to this drink. Sugar or sweetener balances out the bitterness of matcha.
What are the matcha boba tea benefits?
There is no study to support that there are matcha boba tea benefits. But matcha is one of the important ingredients of this drink, so it may offer some benefits:
1. Rich in nutrients
Matcha is a green-coloured powder made of green tea leaves from the Camellia sinensis plant. It consists of tea catechins, lutein and vitamin K, which are beneficial to health, as per research published in the Nutrients journal in 2020. It also consists of vitamin C, protein, and carbohydrates. “These nutrients offer matcha boba tea benefits by supporting overall health and well-being,” says the expert.
2. Contains antioxidants
“Matcha has high levels of antioxidants, which help protect cells from damage caused by free radicals and oxidative stress,” says Dayal. The antioxidant properties of matcha tea are potentially increased by the large number of polyphenols, caffeine, and amino acids in it, as per research published in the Foods journal in 2020.
3. Boosts immunity
Boosting immunity is a potential matcha boba benefit. Matcha consists of vitamin C, which is a powerful antioxidant. It can strengthen the immune defence of the body, according to research published in the Molecules journal in 2020. “The antioxidants in matcha, particularly Epigallocatechin gallate, may also enhance immune function by combating oxidative stress and supporting immune cells,” says the expert.
You may also like
4. May improve mental focus
Improved mental focus one of the matcha boba tea benefits. Matcha contains L-theanine, an amino acid that may promote relaxation and mental clarity. “When combined with caffeine, also found in matcha, it can help improve concentration and focus without the jittery effects often associated with high caffeine intake,” says the expert.
Matcha is an important ingredient of matcha boba tea. Image courtesy: Shutterstock
5. May provide relief from constipation
Guar gum is an additive used in making pearls for boba tea. During a 2014 study published in the Digestive Diseases and Sciences journal, it was found that partially hydrolysed guar gum consumption may help relieve constipation. It was associated with improvements in bowel movement frequency, and the texture of stools. But don’t have it in excess, as consuming it with less water may affect your bowel movement in a negative way.
6. May help with weight loss
If you are trying to lose weight then have this variety of tea. Just like green tea, weight management is also one of the health benefits of matcha tea. During a 2022 study published in the Frontiers In Nutrition, researchers found that matcha green tea helped to alleviate obesity induced by a high-fat diet.
7. May help to fight breast cancer
Matcha tea, which is also consumed as a dietary supplement, may have significant anti-cancer properties. A 2018 study published in the Aging journal indicated that matcha tea was sufficient to inhibit the propagation of breast cancer stem cells.
8. May be good for bones
Drinking tea, especially different types of green tea, including matcha, may help to get stronger bones, and reduce your risk of bone fracture. During a study published in the Nutrition Research journal in 2009, green tea seemed to be more beneficial in increasing bone mineral density than other kinds of tea. This may be due to its higher levels of plant compounds that helped to increase antioxidant capacity.
What are the side effects of matcha boba tea?
Along with matcha boba tea benefits, know about its possible side effects:
If there are too many tapioca pearls, it may lead to digestive issues.
High dosages of caffeine may result in shivering, anxiety, and sleepless nights.
Boba tea has a high sugar content, which may lead to obesity.
Tapioca pearls are made from cassava plant, so it lead to itching if you are allergic to root vegetables.
“To avoid these side effects and enjoy matcha boba tea benefits, consume it in moderation due to the presence of sugar and caffeine in it,” suggests the expert.
Matcha boba tea benefits: Tip to make it healthier
Sweeteners are often used to add flavour to this drink. Look for lower-sugar alternatives such as honey, and pure maple syrup. You can also add fruits like strawberry for the sweetness.
Put less tapioca pearls, which are high in sugar content.
Whole milk may be your first choice, but go for alternatives like unsweetened almond, and soy milk since they have relatively less calories.
Matcha boba tea benefits may have more to do with the finely ground powder of green tea leaves. You can enjoy it once a while, but don’t make it a habit, as it can lead to weight gain, and digestive issues.
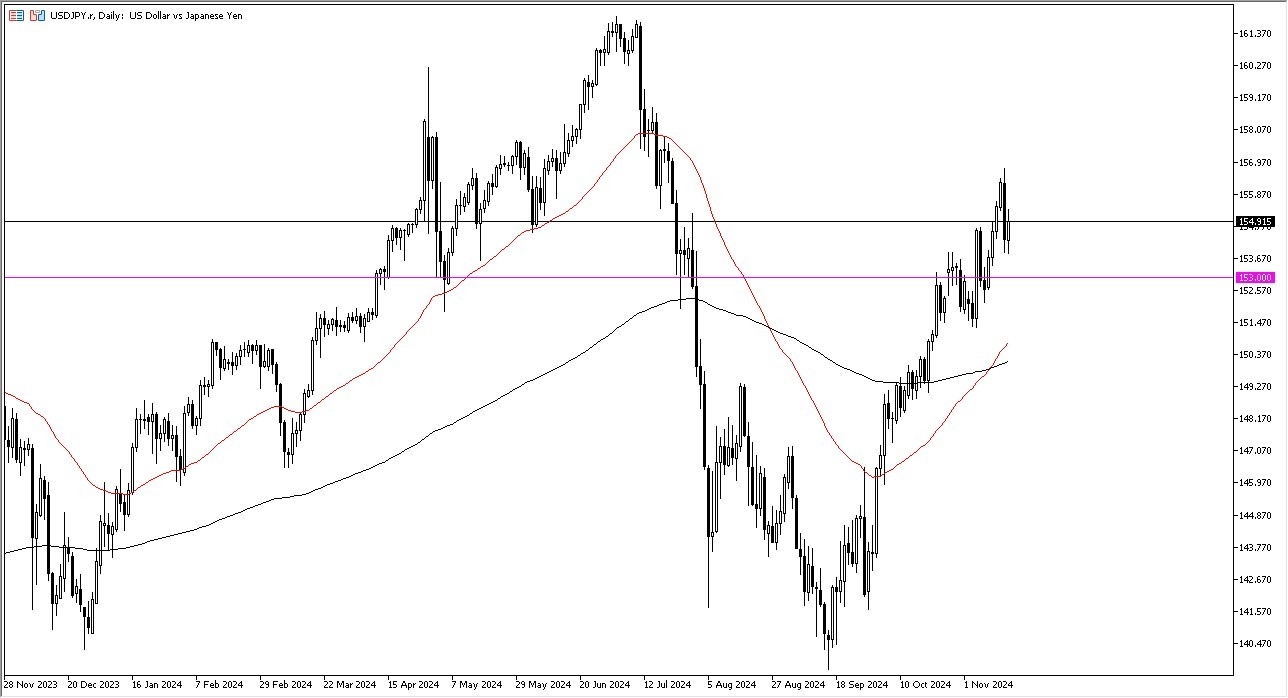
During my daily analysis of the USD/JPY pair, the first thing I notice is that we did recover about half of the losses from the previous session, which of course is a very bullish turn of events.
Furthermore, it’s probably worth noting that a lot of people were worried about the idea of the Governor of the Bank of Japan suggesting that the interest rate policy in Japan was about to get tighter.
He chose not to say anything about this, and therefore it makes a lot of sense that we have seen things turn right back around.
Carry Trade
Do not forget the carry trade. This of course has a major influence on what happens next, and it’s probably worth noting that most traders are very well aware of the fact that they get paid at the end of every day when they hold this pair. In fact, I think that will continue to be the story here, despite the fact that the Federal Reserve has tried to do everything it can to bring down the rates. Quite frankly, traders in the bond market don’t want to hear about it, and it has made interest rates rise. If that’s going to be the case, then the US dollar will be much more preferable than the Japanese yen going forward, which of course is settled by extraordinarily loose monetary policy.
Further bolstering the carry trade will be the technical analysis, which of course is very bullish. The 50 Day EMA has recently broken above the 200 Day EMA, kicking off the so-called “golden cross.” Furthermore, I think that the ¥153 level is an area that people will be paying close attention to, as it is a large, round, psychologically significant figure. This area should offer support, and I think that if we were to drop below it, it could change a lot of things but right now it just doesn’t look very likely to happen. Yes, we did get a massive bearish engulfing candlestick for the Friday session, but I think in the big scheme of things it won’t really matter.
On Sunday, November 17, Ripple’s (XRP) price hit $1 for the first in three years. This landmark also saw XRP volume rise to $24 billion, but as of this writing, that value has since dropped.
This decline indicates that interest in the altcoin is no longer as high as it was earlier. But how will this affect XRP’s price?
Market Attention to Ripple Drops
According to Santiment, XRP’s volume recently peaked at $24.40 billion but has since dropped significantly to $7 billion, marking a $17 billion decrease in buying and selling activity.
From a technical perspective, a rising price coupled with increasing volume typically signals a strong and sustainable uptrend. However, when the price rises while volume declines, it suggests weakening momentum and a potential reversal.
This appears to align with XRP’s current situation, where the volume drop indicates diminished market participation. If this trend persists, XRP’s price could struggle to maintain its upward trajectory and risk falling below the $1 mark in the short term.
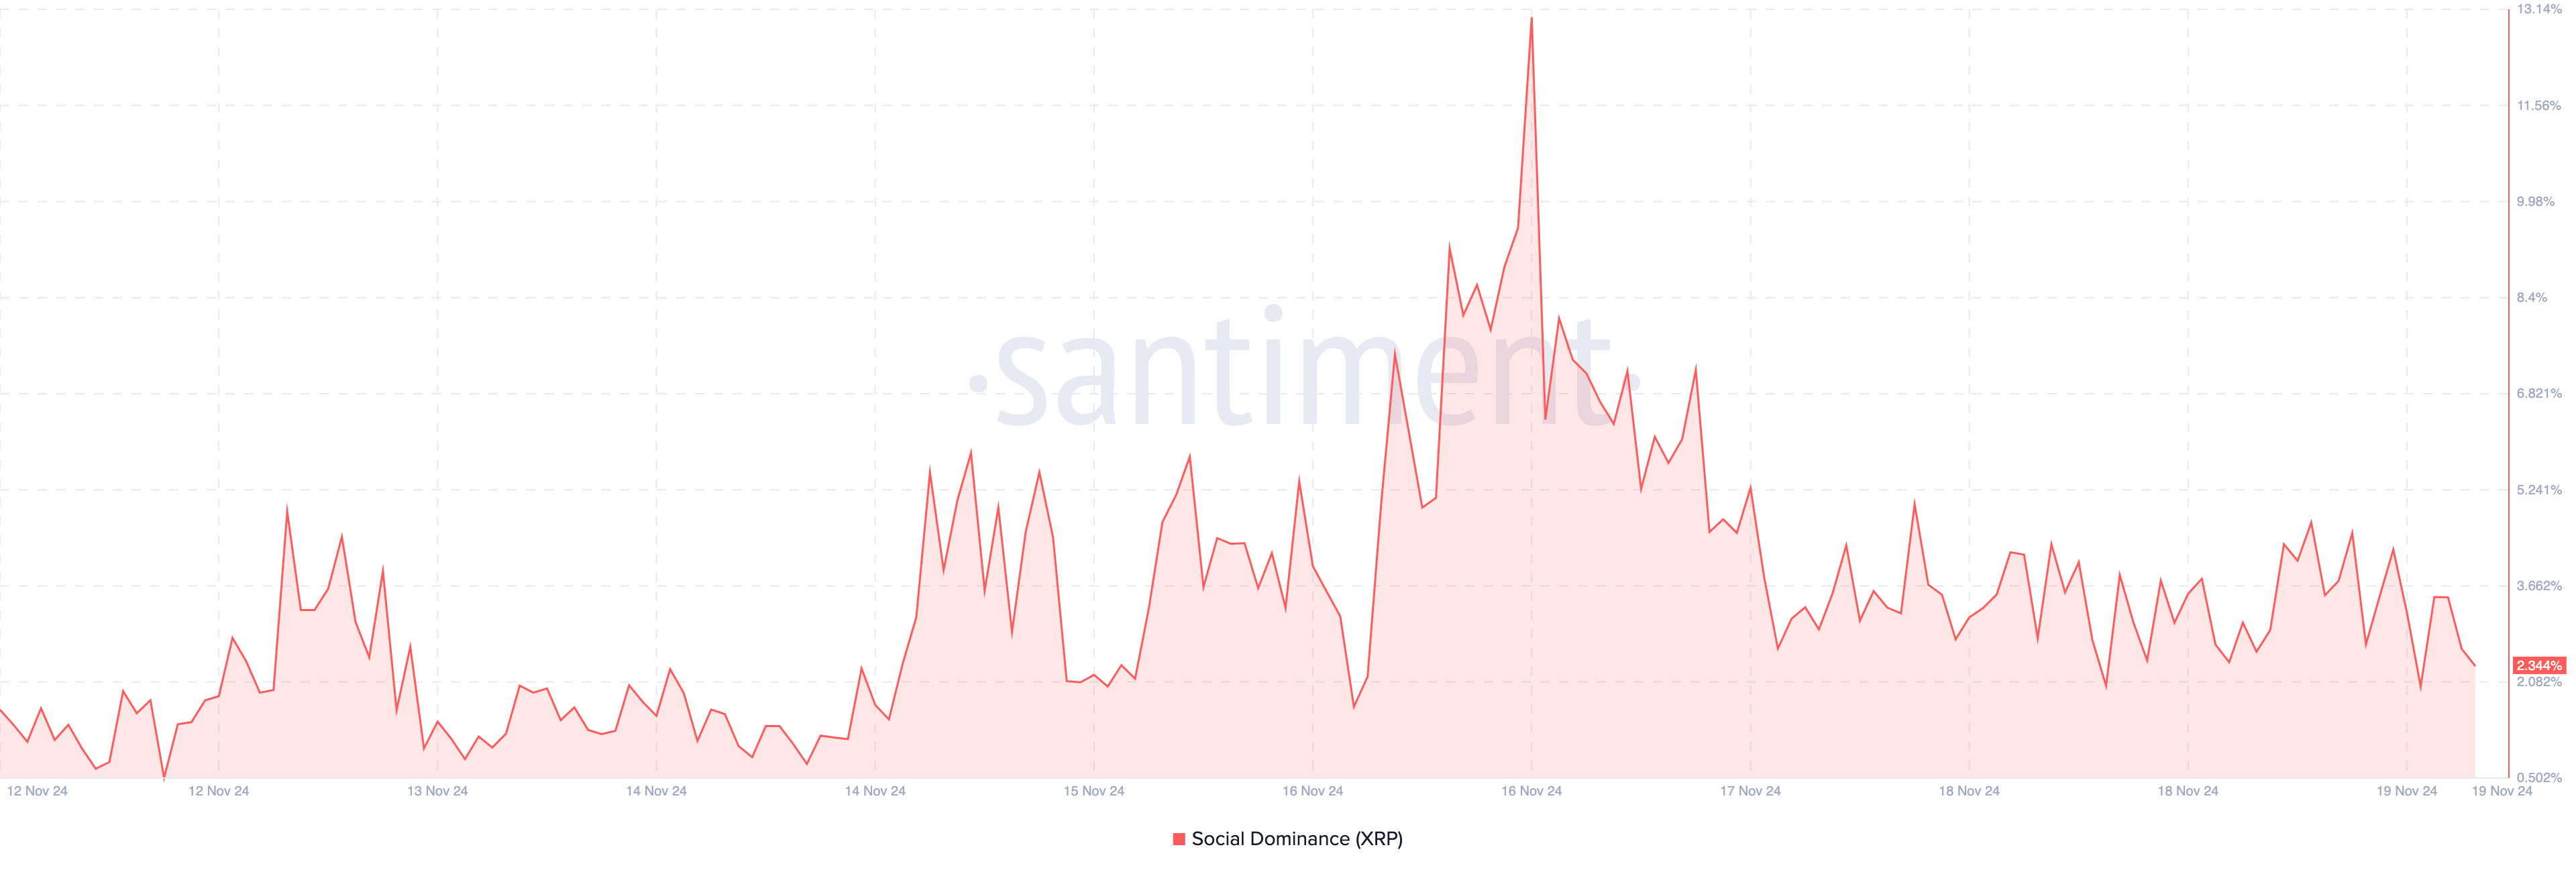
Furthermore, a look at social dominance shows that the reading has dropped. Social dominance is measured by analyzing the percentage of discussions focused on a specific cryptocurrency compared to the total discussions happening across various crypto-related platforms. This metric highlights how much attention an asset is garnering within the broader crypto community.
When social dominance increases, it often indicates heightened interest or hype around the asset. Conversely, a decrease in social dominance may suggest that the asset is losing visibility or relevance in the market.
A few days ago, XRP’s social dominance was almost 13%. As of this writing, it has dropped to 2.34%, indicating that interest in the token has waned. Should this remain the case alongside the drop in XRP volume, the price might drop.
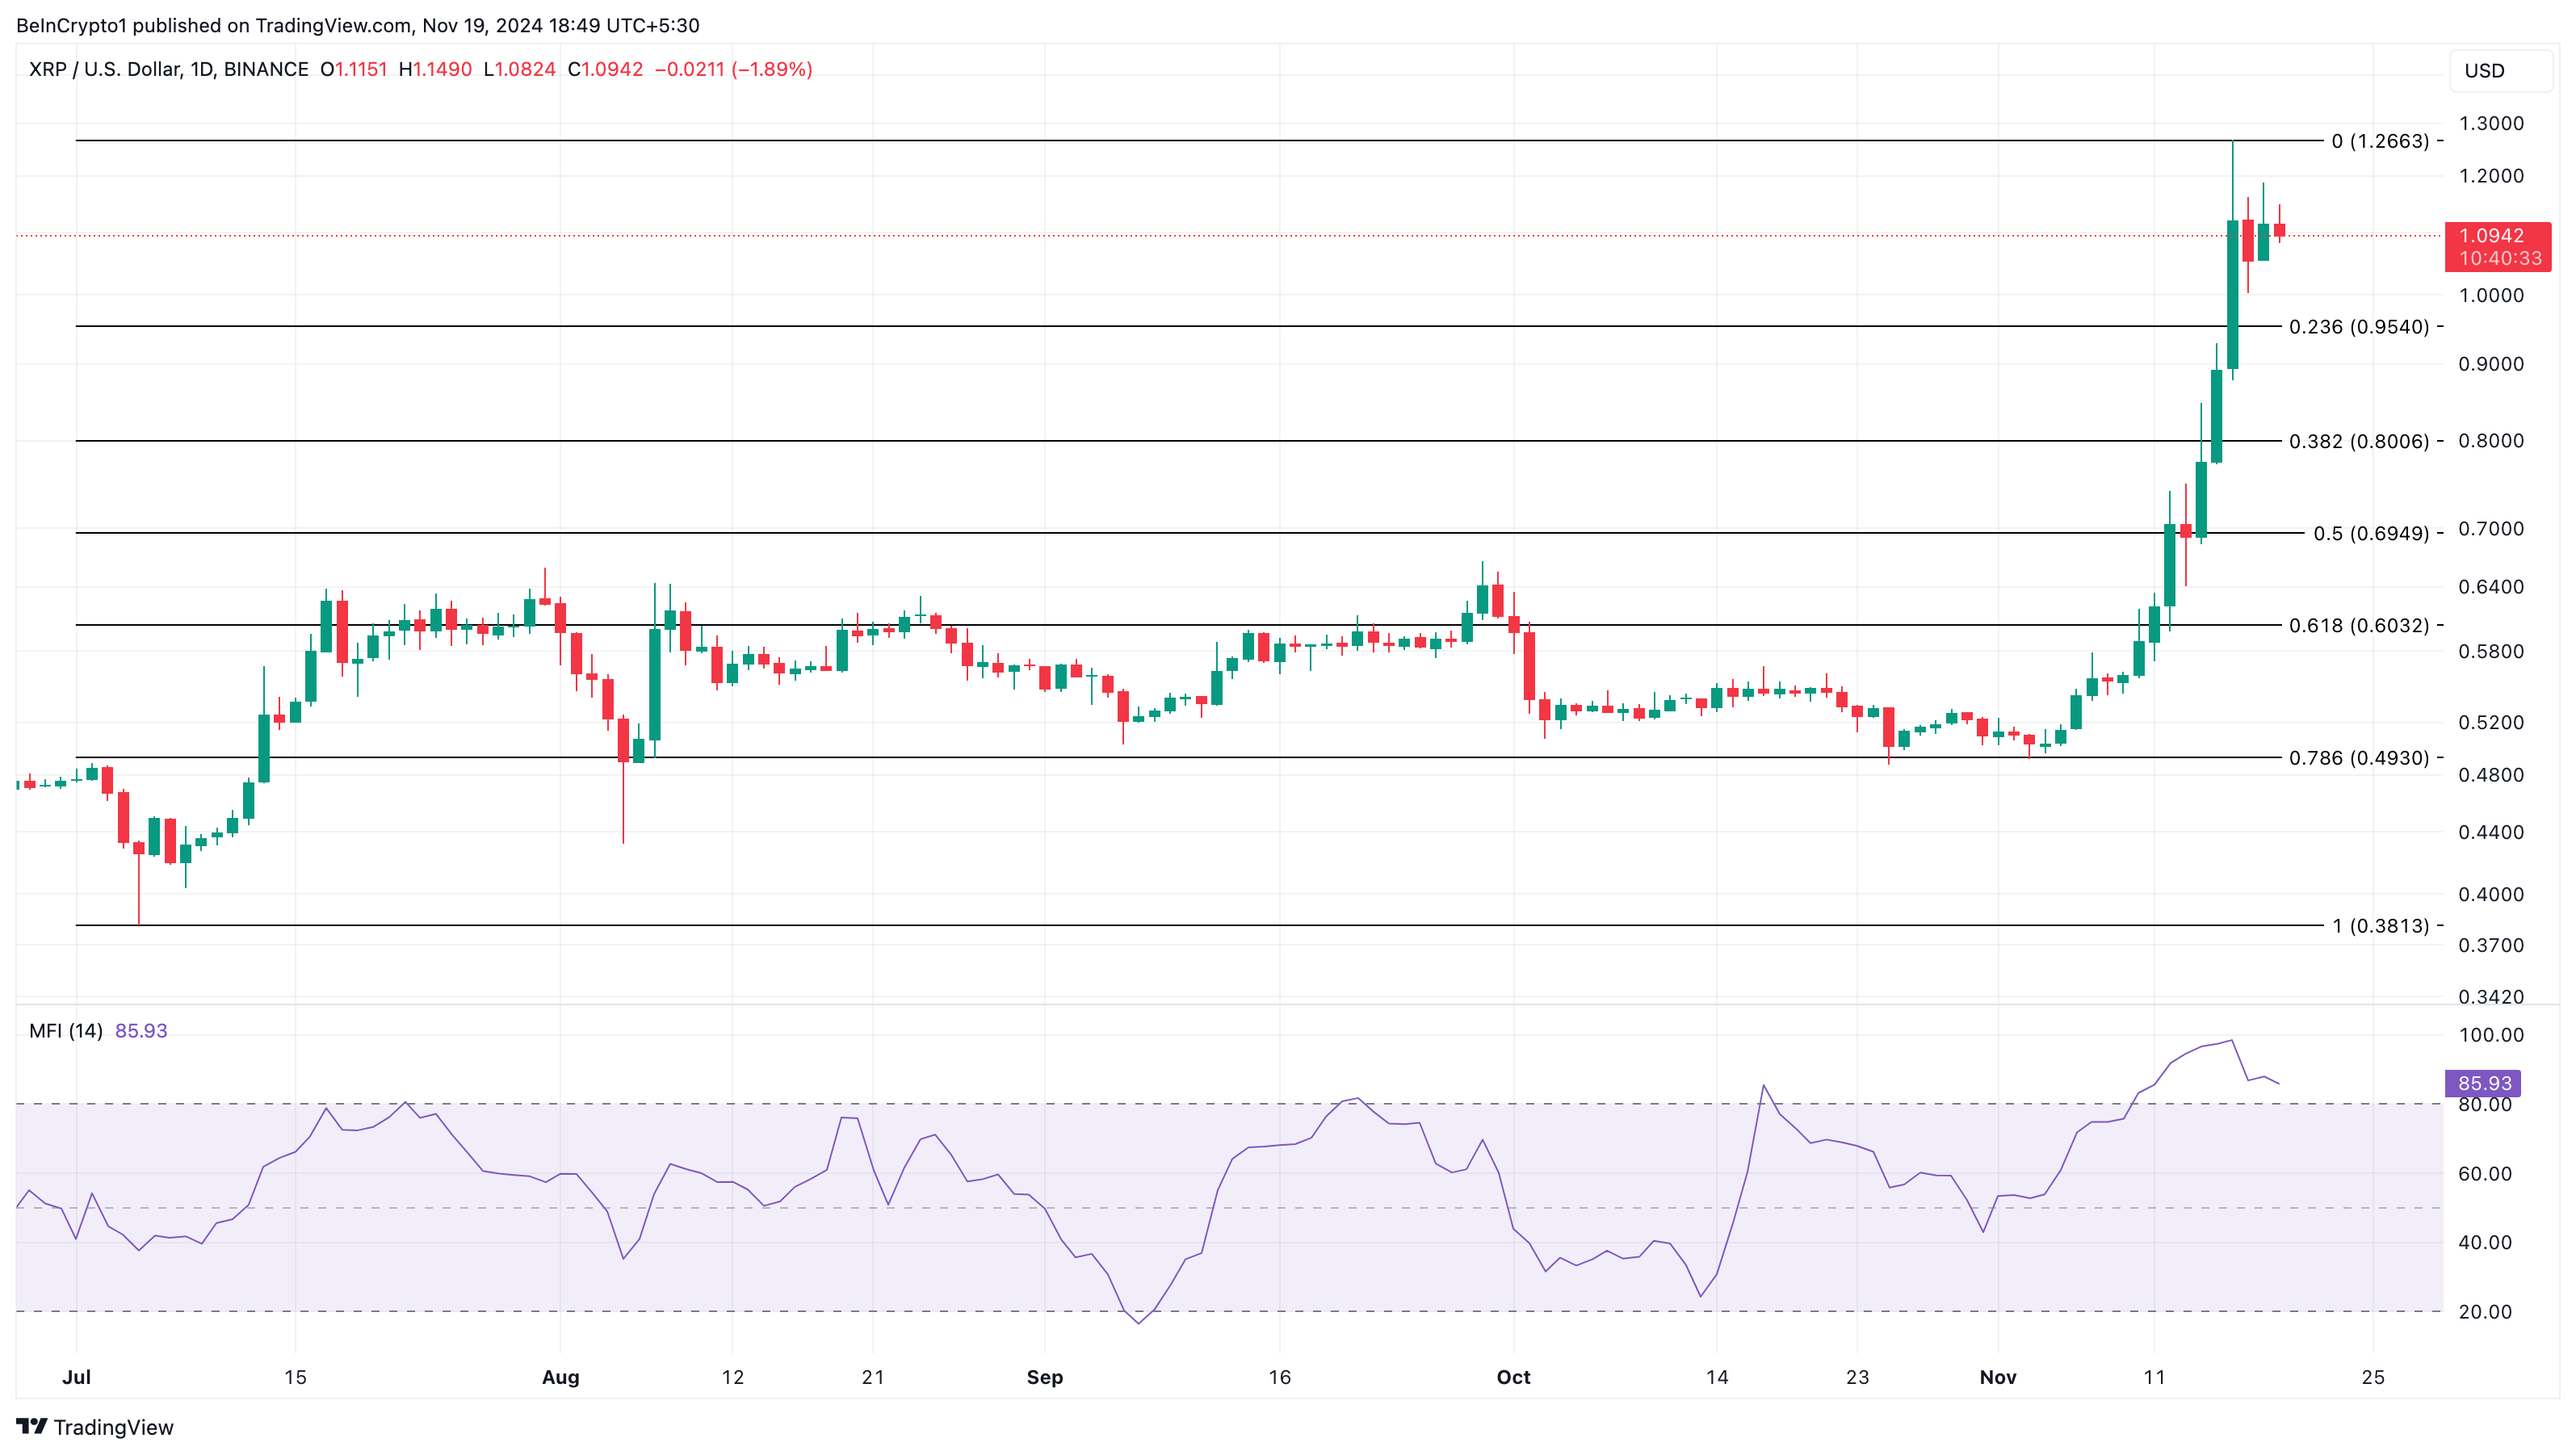
Based on the daily chart, XRP experienced a surge in buying pressure earlier. This was indicated by the Money Flow Index (MFI), an indicator that measures the level of capital injected into a cryptocurrency.
But as of this writing, the MFI reading has dropped from that peak. This decline indicates that buying pressure is no longer as high as it was some days back. Therefore, if this reading continues to decrease, then XRP’s price could drop to $0.80.
However, if XRP volume climbs to the double-digits region again, this trend might change. Should that happen, the cryptocurrency’s value could rise to $1.26.
Disclaimer
In line with the Trust Project guidelines, this price analysis article is for informational purposes only and should not be considered financial or investment advice. BeInCrypto is committed to accurate, unbiased reporting, but market conditions are subject to change without notice. Always conduct your own research and consult with a professional before making any financial decisions. Please note that our Terms and Conditions, Privacy Policy, and Disclaimers have been updated.