Gold price loses momentum to around $2,735 in Monday’s early Asian session.
Geopolitical risks and uncertainty around US presidential elections boost the yellow metal.
Bets for a smaller Fed rate cut weigh on the USD-denominated Gold price.
Gold price (XAU/USD) edges lower to near $2,735, snapping the two-day losing streak during the early Asian session on Monday. However, the downside of the precious metal might be limited amid the ongoing geopolitical tensions and uncertainties surrounding the US presidential election.
Israeli Prime Minister Benjamin Netanyahu said that Saturday’s attack on Iran severely damaged Tehran’s defenses. Meanwhile, Iranian officials vowed an “appropriate response” Sunday, while saying they do not seek a wider war, per CNN. The geopolitical risks and uncertainty around the upcoming US presidential election could provide some support to traditional safe-haven assets like Gold.
The purchases of Gold reserves among central banks and increasing demand from investors have lifted the price of yellow metal. The World Gold Council suggested that the central banks worldwide purchased more than 1,000 tonnes of gold during each of the last two years, and China ranks atop the list of nations seeking to bolster their gold reserves.
On the other hand, a slower pace of rate reductions from the US Federal Reserve (Fed) amid the stronger US economic data undermines the yellow metal. According to the CME FedWatch tool, traders are now pricing in nearly 97.7% that the Fed will cut rates by 25 basis points (bps) in November.
Gold FAQs
Gold has played a key role in human’s history as it has been widely used as a store of value and medium of exchange. Currently, apart from its shine and usage for jewelry, the precious metal is widely seen as a safe-haven asset, meaning that it is considered a good investment during turbulent times. Gold is also widely seen as a hedge against inflation and against depreciating currencies as it doesn’t rely on any specific issuer or government.
Central banks are the biggest Gold holders. In their aim to support their currencies in turbulent times, central banks tend to diversify their reserves and buy Gold to improve the perceived strength of the economy and the currency. High Gold reserves can be a source of trust for a country’s solvency. Central banks added 1,136 tonnes of Gold worth around $70 billion to their reserves in 2022, according to data from the World Gold Council. This is the highest yearly purchase since records began. Central banks from emerging economies such as China, India and Turkey are quickly increasing their Gold reserves.
Gold has an inverse correlation with the US Dollar and US Treasuries, which are both major reserve and safe-haven assets. When the Dollar depreciates, Gold tends to rise, enabling investors and central banks to diversify their assets in turbulent times. Gold is also inversely correlated with risk assets. A rally in the stock market tends to weaken Gold price, while sell-offs in riskier markets tend to favor the precious metal.
The price can move due to a wide range of factors. Geopolitical instability or fears of a deep recession can quickly make Gold price escalate due to its safe-haven status. As a yield-less asset, Gold tends to rise with lower interest rates, while higher cost of money usually weighs down on the yellow metal. Still, most moves depend on how the US Dollar (USD) behaves as the asset is priced in dollars (XAU/USD). A strong Dollar tends to keep the price of Gold controlled, whereas a weaker Dollar is likely to push Gold prices up.
Danske Bank forecasts that the Pound to Euro (GBP/EUR) exchange rate will strengthen to 1.2350 on a 6-month view as UK yields remain attractive.
In contrast, ING expects that GBP/EUR will weaken to 1.1630 by the second quarter of 2025.
During the week, the Pound to Euro (GBP/EUR) exchange rate strengthened to 1.2050 before settling just below 1.2000 as the Euro attempted to pare wider losses.
UK business confidence data was weaker than expected, but markets have tended to focus more on fiscal policy at this stage.
There are strong expectations that Chancellor Reeves will tighten fiscal policy in this week’s budget, but the fiscal rules will be adjusted to allow a substantial increase in borrowing to fund medium-term investment. There are tensions over the debt outlook and UK yields have moved higher.
ING commented; “Gilts underperformed other developed market bonds after the fiscal rule announcement, and there seems to be a consensus view that UK yields have extra room to rise on budget news.”
It added; “From an FX market perspective, what matters is whether any gilt underperformance turns into uncontrolled volatility. Given the pound is pricing in no risk premium, the downside risks for the currency would be very large.”
Advertisement
Monetary policy will remain a key medium-term element.
Although markets remain confident over a November interest rate cut, the chances dipped to just below 90% following the fiscal reports.
Danske expects the Bank of England will maintain a cautious stance in the near term. It commented; “While recent data has come in softer than anticipated by the BoE across the board, warranting a November cut, we think they will remain cautious and pause in December.”
In this context, Danske added; “GBP continues to benefit from a cautiously hawkish tone from the BoE signalling a more gradual cutting cycle relative to peers and UK growth outperformance relative to the Eurozone. We think these forces will continue to weigh on the cross also in the coming months.”
Goldman Sachs maintains a positive Pound stance; “Persistence in the trend of more positive growth news from the UK relative to the Euro area, as well as asymmetrically negative risks for EUR versus GBP from current geopolitical and upcoming US election risks are key factors behind our open recommendation to be short EUR/GBP.”
HSBC is less positive on the Pound due to the policy mix; “On the monetary policy front, we expect the dovish momentum around the BoE to continue, aided by the downturn in headline UK inflation. The 30 October budget will add a fiscal headwind to growth. Loose monetary and tight fiscal policy is rarely a currency positive.”
Danske did point to potential pound vulnerability if risk appetite deteriorates; “The UK runs a large current-account deficit, which makes GBP vulnerable when capital inflows fade; this keeps GBP at risk vs EUR in the wake of souring global risk appetite.”
Like this piece? Please share with your friends and colleagues:
International Money Transfer? Ask our resident FX expert a money transfer question or try John’s new, free, no-obligation personal service! ,where he helps every step of the way,
ensuring you get the best exchange rates on your currency requirements.
Disclosure: This article does not represent investment advice. The content and materials featured on this page are for educational purposes only.
With Solana facing potential bearish trends, investors are shifting to Cutoshi and Pepe Unchained for better prospects.
Solana (SOL) investors are currently facing a high level of doubt as SOL price has reached the top and might reverse downwards in the coming days as we approach the beginning of a new month.
Historically, November is a bearish month for top cryptocurrencies like SOL. Investors are cashing out to prepare for festivities or stack up smaller altcoins with higher potential in the coming bull cycle.
Among these altcoins, Pepe Unchained and Cutoshi are very promising. Cutoshi, in particular, is a meme coin that doubles as a DeFi ecosystem, presenting a solid front to investors as a potential gem in the coming bull cycle and beyond.
SOL Price Prediction Puts Investors On Edge
Solana is the third largest blockchain by TVL, and SOL, is the fifth largest coin in the crypto market. Despite its large market cap of $81B, investors fear that it will soon succumb to a large price dip in the coming month.
Notably, in the SOL price analysis below, Solana experienced a choppy price rally throughout October. Despite its slow movement, it achieved an 18% increase in the last 30 days and is now at the channel’s upper trendline. This level signifies a potential sell zone, which sellers may likely take advantage of and drive prices significantly downward.
Solana was among the most discussed altcoins in Q2 2024 as it hit the $200 all-time high. Its DeFi activity skyrocketed due to thousands of meme coins launching on the blockchain daily. However, if the current Solana price prediction holds, SOL holders might experience a significant dip in their portfolio soon.
Pepe Unchained Presale Achieves New Milestone
Riding off on the popularity of Pepe coin, Pepe Unchained is a new meme coin that has garnered the attention of investors from the Pepe community. Pepe Unchained is building a layer-2 blockchain for meme coins to rival other layer-2 projects in the market.
In a new twist for its presale, Pepe Unchained has reached a $20 million investment milestone, showing the strength of meme coins fused with utility.
Cutoshi Leads The Way For A New Narrative In Crypto
Just like Pepe Unchained, Cutoshi is quickly becoming viral in the crypto market due to its latest innovation.
Cutoshi is the first Ethereum-based meme coin, themed after the famous Chinese Lucky Cat. It is designed to bring luck, fun, and utility to its investors. Unlike most meme coins in the crypto space, Cutoshi is building a DeFi ecosystem from the get-go. Its star product is a decentralized exchange (DEX) that will allow its users to perform cross-chain transactions at a fee of only 0.25%. With Cutoshi’s DEX, users will be able to swap, trade, and stake their cryptocurrencies with extreme ease.
Moreover, the Cutoshi team is investing heavily in building a farming platform for its users to earn free CUTO tokens by engaging within the community. And if you are a newbie in crypto, Cutoshi is also building an academy to help new users get accustomed to cryptocurrencies.
With all these developments underway, Cutoshi is driving green sentiments and the massive attention of investors from all narratives in the crypto space. It has successfully listed on CoinMarketCap and is at the second stage of its presale, at $0.022, with over $550,000 raised.
Cutoshi And Pepe Unchained Have The Potential To Rally Soon
Cutoshi and Pepe Unchained, with their meme-defi approach, have the potential to become the most sought-after cryptos in the coming months. For a long time, investors have searched for a way to have long-lasting meme coin bags, and now they do with Cutoshi and Pepe Unchained.
Disclosure: This content is provided by a third party. crypto.news does not endorse any product mentioned on this page. Users must do their own research before taking any actions related to the company.
HSBC expects the Pound to Dollar (GBP/USD) exchange rate will weaken to at least 1.25 over the next few months.
The bank is broadly bearish on the Pound and net dollar gains to drive Cable lower.
Danske Bank considers that GBP/USD can hold above 1.30 on a 6-month view.
GBP/USD dipped to 10-week lows near 1.2900 before a recovery to 1.2980.
According to ING, GBP/USD will remain vulnerable on a near-term view; “For now, we reiterate a bearish bias on GBP/USD, which can suffer from defensive positioning ahead of the combined UK budget and US election risks. Our view remains that 1.28 can be reached in the near term.”
HSBC commented on UK fiscal policy; “Our economists expect government measures to reduce the budget deficit from an estimated 3.7% of GDP in fiscal year 2024/25, to 3.1% of GDP in 2025/26, and further falls thereafter to 1.5% in 2028/29.”
It added; “This represents a tightening of fiscal policy that looks unlikely to happen in the US whoever wins the White House. It would also likely require looser monetary policy to compensate.”
Advertisement
Markets remain confident that the Federal Reserve and Bank of England will both cut interest rates by 25 basis points at the November meetings, but the overall markets environment could be radically different, especially given a binary US election outcome.
HSBC added; “our economists expect a deeper rate cutting cycle, with 225bp of cuts by the end of 2025 once persistent inflation eases, taking the Bank rate to 2.75%.”
The US election could be pivotal for the Pound.
ING commented on near-term dynamics; “Markets and betting odds are leaning increasingly in favour of Trump. This may be due to greater hedging demand for a Trump presidency, which is seen as a more impactful macro/market event due to protectionism, tax cuts, strict migration policies and risks to the Fed independence. We see both dollar upside risks and wider implied-historical volatility spread into Election Day.”
According to HSBC; “We view three of the four election outcomes as USD bullish for the weeks after the election. Only a Harris Presidency with a divided Congress would be clearly USD negative, in our opinion. Even that scenario might ultimately prove USD bullish. We also view a disputed or delayed election outcome as potentially USD bullish.”
TD Securities commented on the election; “A “Red Wave” (Republican sweep) would prompt a substantial USD rally, reminiscent of US Exceptionalism driven by tariffs, tax cuts, and deregulation.”
It added; “Conversely, a “Blue Wave” (Democratic sweep) would be detrimental for the USD. It could lead to unwinding of pro-Trump trades and hedges, causing initial volatility. Additionally, higher taxes and increased regulation could make US equities less attractive, prompting a shift towards Asian currencies and alternatives.”
Like this piece? Please share with your friends and colleagues:
International Money Transfer? Ask our resident FX expert a money transfer question or try John’s new, free, no-obligation personal service! ,where he helps every step of the way,
ensuring you get the best exchange rates on your currency requirements.
Disclaimer: The opinions expressed by our writers are their own and do not represent the views of U.Today. The financial and market information provided on U.Today is intended for informational purposes only. U.Today is not liable for any financial losses incurred while trading cryptocurrencies. Conduct your own research by contacting financial experts before making any investment decisions. We believe that all content is accurate as of the date of publication, but certain offers mentioned may no longer be available.
Most of the coins have returned to the green zone on the last day of the week, according to CoinStats.
On the hourly chart, one should pay attention to the bar closure in terms of the resistance level of $0.1387. If the candle closes far from it and with no long wick, the growth may continue to the $0.1420 mark.
From the midterm point of view, neither bulls nor bears are dominating. In this case, any sharp moves are unlikely to happen soon. All in all, sideways trading in the area of $0.1350-$0.15 is the more likely scenario.
Kalpetta: With tea prices registering a sudden jump since September this year and the majority of production units fixing prices more than Rs 22 per kg for green leaf for the South Indian tea, the tea farmers of major tea baskets of South India, including Wayanad and adjacent Nilgiri district of Tamil Nadu, are in a jubilant mood.
Earlier, due to the price dip of green tea leaves, farmers had been struggling to make ends meet. During the Covid-19 days, the green leaf prices crossed the Rs 20 mark, owing to the shutdown of most of the tea plantations in the tea belts of Assam and the complete ban on importing tea from other countries. Since then the price for green leaf was hovering between Rs 12 to Rs 15 per kg for the last four years which made it tough for the farmers to survive.
The price fixed by the Tea Board of India for the September month green leaf in the Nilgiri-Wayanad region was Rs 23.45, whereas the price of Greenleaf received by farmers in earlier months was less than Rs 15 per kg. The cooperative entity under the Tamil Nadu state government, the Tamil Nadu Small Tea Growers Industrial Cooperative Tea Factories Federation, popularly known as INDCOSERVE, which has 16 tea factories run by small tea growers under it, also has fixed the price for green tea at Rs 22.50 for the month.
The tea farmers of the region were up in arms against the state and central governments, demanding a just price for tea leaves, claiming that the price for the green leaf had been at the lowest for the last two decades while the input costs skyrocketed. “The prices are up now, at a time when the farmers were busy uprooting the tea plants to replace them for coffee and cardamom,” said Joy A O, who had reduced his tea garden from 4 acres to less than 1 acre now.
“I was planning to uproot the remaining bit of the farm when the prices shot up unexpectedly. While travelling through the hinterlands, one could see massive uprooting of tree plants. I hope the jump in prices would force the farmers to postpone their plans to uproot the tea plants, at least for the time being,” said Rajeev M, secretary of Kayyunni Small Tea Growers’ Association.
In 2020-21, during August (Rs 23), September (Rs 27), October (Rs 24), and November (Rs 26), tea farmers received a good price as the Kerala state government directed its agencies to purchase tea dust directly from INDCOSERVE, the Tea Co-operative under the Tamil Nadu government. “Earlier in the 2017-2018 fiscal, the highest price received by the farmers was Rs 15 per kilogram while the lowest price was Rs 9.50,” he said.
The price rise came at a time when the farmers’ bodies demanded a support price for tea leaves as multiple reports from various bodies including the Tea Board India and various agencies said that the production cost of the green tea leaf is Rs 24 and above. The heat wave that hit the tea belts last summer, the massive conversion of tea plantations for coffee and cardamom are cited as the key reasons for the total dip in production.
Nilgiri-Wayanad Bought Leaf Factories Association president C M Joseph said that the extreme summer this year, which lasted till mid-May followed by continuous rains, had resulted in a sharp dip in production. “The Indian tea industry has a cumulative loss of more than 85 million kilos this financial year up to September,” he said.
“The dip in production was so sharp that the prices of green leaves jumped up to Rs 45 per kg for the Assam-West Bengal tea belt,” said J John Edoor of Grassroots Tea, an umbrella initiative of Small Tea Producers in Assam.
The euro has plunged during most of the week, but we are starting to see a little bit of support near the 1.08 level.
At this point in time, the market looks as if it is trying to bounce but there is still a lot of negativity out there, and I believe any rally at this point in time will probably continue to attract short sellers and it comes to this pair, mainly due to the fact that interest rate spiking in the United States will be a major driver of the US dollar.
I have no interest in buying this pair in the short term, unless of course something changes from a fundamental point of view.
USD/CHF
The US dollar has rallied again during the course of the week, but it does look like we are struggling a little bit with a certain amount of resistance.
If we can break above the present area, then we could go looking to the 0.8750 level, an area that previously has been important due to both support and resistance, and it’s likely that we could go looking to that area.
I also believe that area would be very difficult to get above. Pulling back from this area could open up the possibility of a move to the 0.8550 level, which is a little bit of a floor. We are in the middle of 2 major areas, so expect choppiness.
NZD/USD
The New Zealand dollar has fallen pretty significantly during the course of the week, as we are testing the 0.60 level. Breaking down below the bottom of the candlestick for the previous week opens up the possibility of a move down to the 0.5850 level.
If we turn around and bounce from there, it’s very likely that the market could go looking to the 0.61 level, but quite frankly I think this is an area that should continue to be a massive resistance, and of course, if the interest rates in America continue to spike and of course we continue to see more “risk off behavior”, it makes sense that we will go negative in this pair.
NASDAQ 100
The NASDAQ 100 has fallen quite a bit during the course of the week to reach the 20,000 level, only to turn around and bounce rather significantly.
In fact, as we are closing out the week it looks like we are trying to do everything we can to continue to go much higher, perhaps reaching the 21,000 level before it is all said and done.
Ultimately, I think that short-term pullbacks could continue to be an issue, but I also recognize that we have a situation where traders are certainly bullish, and I think that it’s almost impossible to start shorting this index anytime soon.
USD/MXN
During the trading week, we have seen the US dollar rally toward the 20 MXN level, but that area continues to be a major resistance barrier.
If we can break above that area, then the market is likely to continue to see plenty of reasons to go higher. After all, the market has a lot of things to worry about right now, and that of course makes the US dollar much more attractive than the Mexican peso which is pretty far out on the risk appetite spectrum, and that of course is the most important thing to pay attention to.
If we can break above the 20 MXN level, that could open up a move to the 20.50 MXN level. As things stand right now, I do believe that this remains a “buy on the dips” market.
Gold
Gold markets have had another bullish week, and it is probably worth noting that we have sold off quite a bit toward the top.
That being said, I also recognize that a short-term pullback would probably be the best thing that could happen for gold. Whether or not we get it remains to be seen, but the one thing that I can take away from this chart is that we are most certainly due for some type of dip so that you can take advantage of it.
If and when it happens, I would be a major buyer, with the $2600 level being a massive support level
WTI Crude Oil
The West Texas Intermediate Crude Oil market has rallied a bit during the course of the week as we continue to see a lot of back and forth.
At this point, I believe that the $65.50 level is a major floor in the market, and the $85 level above is a major ceiling. As we are closer to the bottom than the top, I suspect that range bound traders will continue to look at each one of these dips as a potential trading opportunity.
Having said that, I don’t necessarily think that the market is going to take off and jump straight in the air, but at this point in time I also recognize that a little bit of sideways and back and forth trading makes a lot of sense.
USD/JPY
The US dollar has had a strong week against the Japanese yen, as we continue to see a lot of noisy behavior.
With that being the case, the ¥152 level looks to be a major area of importance, so if we can break above there, then the market could very well find itself looking toward the ¥155 level.
On the other hand, if we get some type of pullback, then I think you’ve got a situation where people will be looking for work value as the interest rate differential continues to favor the greenback.
Experts predict that coffee prices on October 27, 10 in the domestic market may increase sharply due to the impact of the world coffee market.
The main reason is that the demand for coffee in the international market is increasing, pushing up prices. In addition, coffee production in some key growing areas is showing signs of decreasing due to unfavorable weather, limiting supply.
In the international market, the price increase of Robusta and Arabica coffee is expected to continue in the coming time. Futures contracts on the London and New York exchanges both recorded steady increases, indicating positive sentiment among traders and the recovery of the coffee market after a period of slight adjustment.
Coffee price forecast October 27, 10: Will the uptrend continue and how long will it last?
Recorded in the trading session on October 26, 10, domestic coffee prices today decreased by 2024 VND/kg, ranging from 1.200-108.400 VND/kg. Currently, the average purchase price in the Central Highlands provinces is 108.800 VND/kg, the highest purchase price in Dak Nong province is 108.600 VND/kg.
Specifically, the coffee purchase price in Gia Lai province (Chu Prong) is 108.600 VND, down 1.200 VND/kg compared to yesterday, in Pleiku and La Grai the price is 108.500 VND/kg; In Kon Tum province, the price is 108.600 VND/kg, down 1.200 VND/kg compared to yesterday; In Dak Nong province, coffee is purchased at the highest price of 108.800 VND/kg, down 1.200 VND/kg compared to yesterday.
The price of green coffee beans (coffee beans, fresh coffee beans) in Lam Dong province in districts such as Bao Loc, Di Linh, Lam Ha, coffee is purchased at 108.400 VND/kg, down 1.200 VND/kg compared to yesterday.
Coffee prices today (October 26) in Dak Lak province; in Cu M’gar district, coffee was purchased at about 10 VND/kg, down 108.600 VND/kg, while in Ea H’leo district, Buon Ho town, it was purchased at the same price of 1.200 VND/kg.
Updated world coffee prices at 20:00 p.m. on August 26, 10, Vietnam time on the London exchange, the price of Robusta coffee futures contract for delivery in September 2024 on the London floor is at 11 USD/ton, an increase 2024 USD compared to the beginning of the trading session.
Coffee prices today, July 26, 10: Robusta coffee prices on the London floor. (Photo: Screenshot from giacaphe.com
Delivery term in November 1 is 2025 USD/ton, an increase of 4.411 USD; Delivery term in January 74 is 3 USD/ton, up 2025 USD and delivery term in March 4.323 is 57 USD/ton, up 5 USD.
Arabica coffee prices on the New York floor on October 26, 10. (Photo: Screenshot of giacaphe.com)
In particular, the price of Arabica coffee on the New York floor today at 20:00 p.m. on September 26, 10 increased in all terms, fluctuating at 2024 – 243.60 cents/lb.
Specifically, the delivery term in September 12 is 2024 cents/lb; increased 248.40 cents/lb compared to the beginning of the session. December 2.95 delivery is 3 cents/lb, an increase of 2025 cents/lb; The March 247.50 delivery period is 3.05 cents/lb, an increase of 5 cents/lb and the May 2025 delivery period is 246.15 cents/lb, an increase of 3.15 cents/lb.
Brazilian Arabica coffee price on October 26, 10. (Photo: Screenshot of giacaphe.com)
The price of Brazilian Arabica coffee today at 21:00 p.m. on October 26, 10 increased and decreased in opposite directions. Specifically, the delivery period for December 2024 is 12 USD/ton, down 2024%; the delivery period for March 300.10 is 0.22 USD/ton, down 3%; the delivery period for May 2025 is 300.00 USD/ton, up 0.37% and the delivery period for July 5 is 2025 USD/ton, up 301.40%.
Robusta coffee traded on ICE Futures Europe (London floor) opens at 16:00 and closes at 00:30 (the next day), Vietnam time.
Arabica coffee on the ICE Futures US floor (New York floor) opens at 16:15 p.m. and closes at 01:30 a.m. (the next day), Vietnam time.
Weather reports in Brazil continue to be positive across most coffee growing regions, with rainfall providing much-needed moisture after the dry winter months. Forecasters expect more rain next week, which should have a positive impact on flowering and preparation for Brazil’s 2025-2026 crop.
In Vietnam, Tropical Storm Trami is moving toward central Vietnam in the coming days after sweeping across the Philippines. The storm could bring heavy rains to parts of the world’s largest robusta coffee producer. It is too early to predict the impact on coffee growing areas, but heavy rains could disrupt ongoing harvesting activities, I&M Smith said.
The global coffee industry has been and continues to face many difficulties and challenges due to climate change which has greatly affected productivity, output and quality. Drought and heat waves have lasted from the beginning of the season, followed by storms at the end of the season.
In addition, geopolitical instability, war, local embargoes between Russia and Ukraine, Israel and the Gaza Strip, and many other places in the world with prolonged developments continue to impact the difficulties of the global economy in the medium and long term. Up to now, coffee prices have cooled down, but the market situation in the upcoming 2024-2025 crop year is still difficult to predict.
Information for reference only. Prices may vary depending on locality.
Cardano is definitely one of those projects that have incredible potential outside of being an asset that gets traded for profit. Built on peer-reviewed academic research, Cardano has brought together a strong community over the years.
Its technical foundation and the ambitions of its team have made ADA one of the top cryptocurrencies in the world. Let’s take a closer look at what the Cardano cryptocurrency and project are all about and examine our ADA price forecast for the coming years.
Please keep in mind that, as with any other cryptocurrency, it is nearly impossible to make a 100% accurate Cardano price forecast. We mention what minimum price and maximum price ADA can potentially have in one year or the next five years, but those are just our estimations. This article does not constitute investment advice.
Cardano ADA Overview
Cardano Price Change 24h
1.59%
Cardano Price Change 7d
2.81%
Cardano Market cap
$16,598,273,686.65
Cardano All time high
$3.10
Cardano All time low
$0.02
Cardano Price Prediction 7d
$0.431847 +19.81
Cardano Fear-Greed Index
65 Greed
Cardano Green Days
15/30 (50%)
Our real-time ADA to USD price update shows the current Cardano price as $0.360434 USD.
According to our Cardano price prediction, ADA price is expected to have a 0.68% decrease and drop as low as by October 17, 2024.
Our technical indicators signal about the Neutral Bullish 61% market sentiment on Cardano, while the Fear & Greed Index is displaying a score of 65 (Greed).
Over the last 30 days, Cardano has had 15/30 (50%) green days and 5.58% price volatility.
Cardano Profit Calculator
Profit calculation please wait…
Cardano (ADA) Technical Overview
When discussing future trading opportunities of digital assets, it is essential to pay attention to market sentiments.
The bulls are leading – sell and lock in your gains!
On the four-hour chart, Cardano is bearish. The 50-day moving average is falling, suggesting a weakening short-term trend. Meanwhile, the 200-day moving average has been falling since 23/10/2024, indicating a weak longer-term trend.
In the daily chart, Cardano is bullish. The 50-day moving average, currently above the price, is rising, which might resist future price movements. The 200-day moving average has been falling since 28/09/2024, showing long-term weakness.
On the weekly timeframe, Cardano appears bullish. The 50-day moving average is above the price and rising, potentially acting as resistance. The 200-day moving average, rising since 07/04/2024, supports a sustained trend.
Cardano (ADA) Price Prediction For Today, Tomorrow and Next 30 Days
Date
Price
Change
October 16, 2024
$0.368394
2.21%
October 17, 2024
$0.35406
-1.77%
October 18, 2024
$0.362870
0.68%
October 19, 2024
$0.36604
1.56%
October 20, 2024
$0.343388
-4.73%
October 21, 2024
$0.344080
-4.54%
October 22, 2024
$0.348759
-3.24%
Cardano Prediction Table
2024
2025
2026
2027
2028
2029
2030
2031
2032
2033
2040
2050
October
$0.343
$0.356
$0.368
November
$0.344
$0.350
$0.355
December
$0.350
$0.357
$0.364
All Time
$0.346
$0.354
$0.362
January
$0.343
$0.401
$0.372
February
$0.343
$0.433
$0.389
March
$0.344
$0.466
$0.405
April
$0.344
$0.498
$0.421
May
$0.344
$0.531
$0.438
June
$0.344
$0.564
$0.454
July
$0.344
$0.596
$0.470
August
$0.344
$0.629
$0.487
September
$0.345
$0.661
$0.503
October
$0.345
$0.694
$0.519
November
$0.345
$0.726
$0.536
December
$0.345
$0.759
$0.552
All Time
$0.344
$0.580
$0.462
January
$0.379
$0.761
$0.583
February
$0.414
$0.763
$0.615
March
$0.448
$0.766
$0.646
April
$0.483
$0.768
$0.677
May
$0.517
$0.770
$0.709
June
$0.551
$0.772
$0.740
July
$0.586
$0.775
$0.772
August
$0.620
$0.777
$0.803
September
$0.655
$0.779
$0.834
October
$0.689
$0.781
$0.866
November
$0.723
$0.784
$0.897
December
$0.758
$0.786
$0.928
All Time
$0.569
$0.774
$0.756
January
$0.786
$0.815
$0.961
February
$0.815
$0.845
$0.994
March
$0.843
$0.874
$1.03
April
$0.872
$0.904
$1.06
May
$0.900
$0.933
$1.09
June
$0.929
$0.963
$1.12
July
$0.957
$0.992
$1.16
August
$0.986
$1.02
$1.19
September
$1.01
$1.05
$1.22
October
$1.04
$1.08
$1.25
November
$1.07
$1.11
$1.29
December
$1.10
$1.14
$1.32
All Time
$0.943
$0.978
$1.14
January
$1.14
$1.18
$1.37
February
$1.18
$1.22
$1.42
March
$1.21
$1.26
$1.46
April
$1.25
$1.30
$1.51
May
$1.29
$1.34
$1.56
June
$1.33
$1.38
$1.61
July
$1.36
$1.41
$1.65
August
$1.40
$1.45
$1.70
September
$1.44
$1.49
$1.75
October
$1.48
$1.53
$1.80
November
$1.51
$1.57
$1.84
December
$1.55
$1.61
$1.89
All Time
$1.34
$1.39
$1.63
January
$1.62
$1.68
$1.96
February
$1.68
$1.74
$2.03
March
$1.75
$1.81
$2.10
April
$1.81
$1.88
$2.17
May
$1.88
$1.94
$2.24
June
$1.94
$2.01
$2.32
July
$2.01
$2.08
$2.39
August
$2.07
$2.14
$2.46
September
$2.14
$2.21
$2.53
October
$2.20
$2.28
$2.60
November
$2.27
$2.34
$2.67
December
$2.33
$2.41
$2.74
All Time
$1.97
$2.04
$2.35
January
$2.42
$2.50
$2.86
February
$2.51
$2.60
$2.98
March
$2.60
$2.69
$3.09
April
$2.69
$2.79
$3.21
May
$2.78
$2.88
$3.33
June
$2.88
$2.98
$3.45
July
$2.97
$3.07
$3.56
August
$3.06
$3.16
$3.68
September
$3.15
$3.26
$3.80
October
$3.24
$3.35
$3.92
November
$3.33
$3.45
$4.03
December
$3.42
$3.54
$4.15
All Time
$2.92
$3.02
$3.50
January
$3.55
$3.67
$4.30
February
$3.68
$3.81
$4.46
March
$3.81
$3.94
$4.61
April
$3.93
$4.07
$4.77
May
$4.06
$4.21
$4.92
June
$4.19
$4.34
$5.08
July
$4.32
$4.47
$5.23
August
$4.45
$4.61
$5.38
September
$4.58
$4.74
$5.54
October
$4.70
$4.87
$5.69
November
$4.83
$5.01
$5.85
December
$4.96
$5.14
$6
All Time
$4.25
$4.41
$5.15
January
$5.18
$5.37
$6.23
February
$5.41
$5.59
$6.46
March
$5.63
$5.82
$6.69
April
$5.85
$6.04
$6.92
May
$6.07
$6.27
$7.15
June
$6.30
$6.49
$7.38
July
$6.52
$6.72
$7.60
August
$6.74
$6.94
$7.83
September
$6.96
$7.17
$8.06
October
$7.19
$7.39
$8.29
November
$7.41
$7.62
$8.52
December
$7.63
$7.84
$8.75
All Time
$6.41
$6.60
$7.49
January
$7.92
$8.15
$9.12
February
$8.21
$8.45
$9.50
March
$8.50
$8.76
$9.87
April
$8.79
$9.06
$10.24
May
$9.08
$9.37
$10.62
June
$9.37
$9.67
$10.99
July
$9.66
$9.98
$11.36
August
$9.95
$10.28
$11.74
September
$10.24
$10.59
$12.11
October
$10.53
$10.89
$12.48
November
$10.82
$11.20
$12.86
December
$11.11
$11.50
$13.23
All Time
$9.52
$9.82
$11.18
January
$25.11
$26.60
$30.66
February
$39.11
$41.70
$48.08
March
$53.11
$56.80
$65.51
April
$67.11
$71.90
$82.94
May
$81.11
$87
$100.36
June
$95.12
$102.10
$117.79
July
$109.12
$117.19
$135.22
August
$123.12
$132.29
$152.64
September
$137.12
$147.39
$170.07
October
$151.12
$162.49
$187.50
November
$165.12
$177.59
$204.92
December
$179.12
$192.69
$222.35
All Time
$102.12
$109.64
$126.50
January
$188.04
$201.88
$231.33
February
$196.96
$211.07
$240.31
March
$205.88
$220.26
$249.28
April
$214.80
$229.44
$258.26
May
$223.72
$238.63
$267.24
June
$232.64
$247.82
$276.22
July
$241.56
$257.01
$285.19
August
$250.48
$266.20
$294.17
September
$259.40
$275.39
$303.15
October
$268.32
$284.57
$312.13
November
$277.24
$293.76
$321.10
December
$286.16
$302.95
$330.08
All Time
$237.10
$252.41
$280.70
Choose a year
2024
2025
2026
2027
2028
2029
2030
2031
2032
2033
2040
2050
Cardano Historical
According to the latest data gathered, the current price of Cardano is $0.49, and ADA is presently ranked No. 10 in the entire crypto ecosystem. The circulation supply of Cardano is $17,443,552,114.75, with a market cap of 35,680,908,838 ADA.
In the past 24 hours, the crypto has increased by $0.01 in its current value.
For the last 7 days, ADA has been in a good upward trend, thus increasing by 14.22%. Cardano has shown very strong potential lately, and this could be a good opportunity to dig right in and invest.
During the last month, the price of ADA has increased by 4.59%, adding a colossal average amount of $0.02 to its current value. This sudden growth means that the coin can become a solid asset now if it continues to grow.
Cardano Price Prediction 2024
According to the technical analysis of Cardano prices expected in 2024, the minimum cost of Cardano will be $0.343. The maximum level that the ADA price can reach is $0.356. The average trading price is expected around $0.368.
October 2024: Cardano Price Forecast
In the middle of autumn 2024, the Cardano cost will be traded at the average level of $0.356. Crypto analysts expect that in October 2024, the ADA price might fluctuate between $0.343 and $0.368.
ADA Price Forecast for November 2024
Market experts expect that in November 2024, the Cardano value will not drop below a minimum of $0.344. The maximum peak expected this month is $0.355. The estimated average trading value will be at the level of $0.350.
December 2024: Cardano Price Forecast
Cryptocurrency experts have carefully analyzed the range of ADA prices throughout 2024. For December 2024, their forecast is the following: the maximum trading value of Cardano will be around $0.364, with a possibility of dropping to a minimum of $0.350. In December 2024, the average cost will be $0.357.
Cardano Price Prediction 2025
After the analysis of the prices of Cardano in previous years, it is assumed that in 2025, the minimum price of Cardano will be around $0.345. The maximum expected ADA price may be around $0.552. On average, the trading price might be $0.759 in 2025.
Month
Minimum Price
Average Price
Maximum Price
January 2025
$0.343
$0.401
$0.372
February 2025
$0.343
$0.433
$0.389
March 2025
$0.344
$0.466
$0.405
April 2025
$0.344
$0.498
$0.421
May 2025
$0.344
$0.531
$0.438
June 2025
$0.344
$0.564
$0.454
July 2025
$0.344
$0.596
$0.470
August 2025
$0.344
$0.629
$0.487
September 2025
$0.345
$0.661
$0.503
October 2025
$0.345
$0.694
$0.519
November 2025
$0.345
$0.726
$0.536
December 2025
$0.345
$0.759
$0.552
Cardano Price Prediction 2026
Based on the technical analysis by cryptocurrency experts regarding the prices of Cardano, in 2026, ADA is expected to have the following minimum and maximum prices: about $0.7577 and $0.9284, respectively. The average expected trading cost is $0.7859.
Month
Minimum Price
Average Price
Maximum Price
January 2026
$0.379
$0.761
$0.583
February 2026
$0.414
$0.763
$0.615
March 2026
$0.448
$0.766
$0.646
April 2026
$0.483
$0.768
$0.677
May 2026
$0.517
$0.770
$0.709
June 2026
$0.551
$0.772
$0.740
July 2026
$0.586
$0.775
$0.772
August 2026
$0.620
$0.777
$0.803
September 2026
$0.655
$0.779
$0.834
October 2026
$0.689
$0.781
$0.866
November 2026
$0.723
$0.784
$0.897
December 2026
$0.758
$0.786
$0.928
Cardano Price Prediction 2027
The experts in the field of cryptocurrency have analyzed the prices of Cardano and their fluctuations during the previous years. It is assumed that in 2027, the minimum ADA price might drop to $1.10, while its maximum can reach $1.32. On average, the trading cost will be around $1.14.
Month
Minimum Price
Average Price
Maximum Price
January 2027
$0.786
$0.815
$0.961
February 2027
$0.815
$0.845
$0.994
March 2027
$0.843
$0.874
$1.03
April 2027
$0.872
$0.904
$1.06
May 2027
$0.900
$0.933
$1.09
June 2027
$0.929
$0.963
$1.12
July 2027
$0.957
$0.992
$1.16
August 2027
$0.986
$1.02
$1.19
September 2027
$1.01
$1.05
$1.22
October 2027
$1.04
$1.08
$1.25
November 2027
$1.07
$1.11
$1.29
December 2027
$1.10
$1.14
$1.32
Cardano Price Prediction 2028
Based on the analysis of the costs of Cardano by crypto experts, the following maximum and minimum ADA prices are expected in 2028: $1.89 and $1.55. On average, it will be traded at $1.61.
Month
Minimum Price
Average Price
Maximum Price
January 2028
$1.14
$1.18
$1.37
February 2028
$1.18
$1.22
$1.42
March 2028
$1.21
$1.26
$1.46
April 2028
$1.25
$1.30
$1.51
May 2028
$1.29
$1.34
$1.56
June 2028
$1.33
$1.38
$1.61
July 2028
$1.36
$1.41
$1.65
August 2028
$1.40
$1.45
$1.70
September 2028
$1.44
$1.49
$1.75
October 2028
$1.48
$1.53
$1.80
November 2028
$1.51
$1.57
$1.84
December 2028
$1.55
$1.61
$1.89
Cardano Price Prediction 2029
Crypto experts are constantly analyzing the fluctuations of Cardano. Based on their predictions, the estimated average ADA price will be around $2.41. It might drop to a minimum of $2.33, but it still might reach $2.74 throughout 2029.
Month
Minimum Price
Average Price
Maximum Price
January 2029
$1.62
$1.68
$1.96
February 2029
$1.68
$1.74
$2.03
March 2029
$1.75
$1.81
$2.10
April 2029
$1.81
$1.88
$2.17
May 2029
$1.88
$1.94
$2.24
June 2029
$1.94
$2.01
$2.32
July 2029
$2.01
$2.08
$2.39
August 2029
$2.07
$2.14
$2.46
September 2029
$2.14
$2.21
$2.53
October 2029
$2.20
$2.28
$2.60
November 2029
$2.27
$2.34
$2.67
December 2029
$2.33
$2.41
$2.74
Cardano Price Prediction 2030
Every year, cryptocurrency experts prepare forecasts for the price of Cardano. It is estimated that ADA will be traded between $3.42 and $4.15 in 2030. Its average cost is expected at around $3.54 during the year.
Month
Minimum Price
Average Price
Maximum Price
January 2030
$2.42
$2.50
$2.86
February 2030
$2.51
$2.60
$2.98
March 2030
$2.60
$2.69
$3.09
April 2030
$2.69
$2.79
$3.21
May 2030
$2.78
$2.88
$3.33
June 2030
$2.88
$2.98
$3.45
July 2030
$2.97
$3.07
$3.56
August 2030
$3.06
$3.16
$3.68
September 2030
$3.15
$3.26
$3.80
October 2030
$3.24
$3.35
$3.92
November 2030
$3.33
$3.45
$4.03
December 2030
$3.42
$3.54
$4.15
Cardano Price Prediction 2031
Cryptocurrency analysts are ready to announce their estimations of the Cardano’s price. The year 2031 will be determined by the maximum ADA price of $6.00. However, its rate might drop to around $4.96. So, the expected average trading price is $5.14.
Month
Minimum Price
Average Price
Maximum Price
January 2031
$3.55
$3.67
$4.30
February 2031
$3.68
$3.81
$4.46
March 2031
$3.81
$3.94
$4.61
April 2031
$3.93
$4.07
$4.77
May 2031
$4.06
$4.21
$4.92
June 2031
$4.19
$4.34
$5.08
July 2031
$4.32
$4.47
$5.23
August 2031
$4.45
$4.61
$5.38
September 2031
$4.58
$4.74
$5.54
October 2031
$4.70
$4.87
$5.69
November 2031
$4.83
$5.01
$5.85
December 2031
$4.96
$5.14
$6
Cardano Price Prediction 2032
After years of analysis of the Cardano price, crypto experts are ready to provide their ADA cost estimation for 2032. It will be traded for at least $7.63, with the possible maximum peaks at $8.75. Therefore, on average, you can expect the ADA price to be around $7.84 in 2032.
Month
Minimum Price
Average Price
Maximum Price
January 2032
$5.18
$5.37
$6.23
February 2032
$5.41
$5.59
$6.46
March 2032
$5.63
$5.82
$6.69
April 2032
$5.85
$6.04
$6.92
May 2032
$6.07
$6.27
$7.15
June 2032
$6.30
$6.49
$7.38
July 2032
$6.52
$6.72
$7.60
August 2032
$6.74
$6.94
$7.83
September 2032
$6.96
$7.17
$8.06
October 2032
$7.19
$7.39
$8.29
November 2032
$7.41
$7.62
$8.52
December 2032
$7.63
$7.84
$8.75
Cardano Price Prediction 2033
Cryptocurrency analysts are ready to announce their estimations of the Cardano’s price. The year 2033 will be determined by the maximum ADA price of $13.23. However, its rate might drop to around $11.11. So, the expected average trading price is $11.50.
Month
Minimum Price
Average Price
Maximum Price
January 2033
$7.92
$8.15
$9.12
February 2033
$8.21
$8.45
$9.50
March 2033
$8.50
$8.76
$9.87
April 2033
$8.79
$9.06
$10.24
May 2033
$9.08
$9.37
$10.62
June 2033
$9.37
$9.67
$10.99
July 2033
$9.66
$9.98
$11.36
August 2033
$9.95
$10.28
$11.74
September 2033
$10.24
$10.59
$12.11
October 2033
$10.53
$10.89
$12.48
November 2033
$10.82
$11.20
$12.86
December 2033
$11.11
$11.50
$13.23
Cardano Price Prediction 2040
Cryptocurrency analysts are ready to announce their estimations of the Cardano’s price. The year 2040 will be determined by the maximum ADA price of $222.35. However, its rate might drop to around $179.12. So, the expected average trading price is $192.69.
Month
Minimum Price
Average Price
Maximum Price
January 2040
$25.11
$26.60
$30.66
February 2040
$39.11
$41.70
$48.08
March 2040
$53.11
$56.80
$65.51
April 2040
$67.11
$71.90
$82.94
May 2040
$81.11
$87
$100.36
June 2040
$95.12
$102.10
$117.79
July 2040
$109.12
$117.19
$135.22
August 2040
$123.12
$132.29
$152.64
September 2040
$137.12
$147.39
$170.07
October 2040
$151.12
$162.49
$187.50
November 2040
$165.12
$177.59
$204.92
December 2040
$179.12
$192.69
$222.35
Cardano Price Prediction 2050
Cryptocurrency analysts are ready to announce their estimations of the Cardano’s price. The year 2050 will be determined by the maximum ADA price of $330.08. However, its rate might drop to around $286.16. So, the expected average trading price is $302.95.
Month
Minimum Price
Average Price
Maximum Price
January 2050
$188.04
$201.88
$231.33
February 2050
$196.96
$211.07
$240.31
March 2050
$205.88
$220.26
$249.28
April 2050
$214.80
$229.44
$258.26
May 2050
$223.72
$238.63
$267.24
June 2050
$232.64
$247.82
$276.22
July 2050
$241.56
$257.01
$285.19
August 2050
$250.48
$266.20
$294.17
September 2050
$259.40
$275.39
$303.15
October 2050
$268.32
$284.57
$312.13
November 2050
$277.24
$293.76
$321.10
December 2050
$286.16
$302.95
$330.08
What Is Cardano (ADA)?
Cardano (ADA) is the native token of a proof-of-stake blockchain that goes by the same name. The Cardano network was founded in 2015 by Ethereum co-founder Charles Hoskinson.
Cardano Foundation states that its ultimate goal is to give innovators and visionaries a platform that will help them make the world a better place. To accomplish this, the Cardano team is building an interoperable and scalable multi-asset ledger with a platform for verifiable smart contracts.
The Cardano blockchain was designed to be a more efficient alternative to proof-of-work networks like Bitcoin. It has higher interoperability and scalability potential and is also faster, cheaper, and more sustainable than PoW blockchains.
The Cardano ecosystem runs on Ouroboros, the proof-of-stake (PoS) consensus protocol that is secure and, above all, is supported by academic research. Each change to the Cardano roadmap is peer-reviewed and anchored by a research-based framework.
If you’d like to learn more about this innovative cryptocurrency and the way Cardano operates, read this article or head over to the official Cardano website.
What Is Cardano Used for?
Cardano was built to empower the development of various decentralized applications, DeFi tools, tokens, and more in a sustainable and scalable way.
Here are some of the things you can use Cardano for, in no particular order:
Create, send, and receive native tokens and NFTs (non-fungible tokens).
Add metadata to transactions to give them identity and background.
Use transaction metadata to validate and verify any data, digital files, or even physical objects.
Set up and manage your own staking pool on Cardano.
Integrate the Cardano technology into your existing platforms and websites.
Create your own smart contracts.
And here’s what you can do with your ADA tokens — besides trading them, of course:
Use your ADA to vote on governance proposals, particularly those that distribute treasury funds.
The Cardano (ADA) network experienced a major upgrade in September 2021 when it introduced smart contract functionality. This enhancement allowed the blockchain not only to scale more effectively but also to operate at a faster pace.
Smart contracts on Cardano are self-executing agreements with the terms directly written into code. Quite change-resistant, they streamline processes by automating contractual obligations and eliminating the need for intermediaries or third parties. This development has been crucial in boosting the efficiency and reliability of transactions on the Cardano network.
Despite a bearish phase in the crypto market in 2022, Cardano’s network showed resilience. The platform’s Plutus Scripts — used for Cardano-based smart contracts — saw significant growth, surpassing 4,000 smart contracts following the Vasil hard fork in September. Recent data from Cardano Blockchain Insights indicates a further increase in both V1 and V2 Plutus smart contracts, reaching a remarkable total of 24,050 by January 24. This represents a 67% increase from the beginning of the year — a substantial expansion.
This growth in smart contracts is indicative of Cardano’s continuous development and commitment to innovation throughout 2023. Nearly 10,000 contracts were added during last year, which reflects the platform’s dedication to evolving its capabilities.
Dan Gambardello, founder of Crypto Capital Venture, has commented on the significant improvements within the Cardano network since the last bull run. He specifically pointed to the enhanced smart contract functionality as a key area of development. These advancements, according to Gambardello, are one of the reasons he believes ADA has the potential to reach $11 in the next bull run.
Want to stay updated on Cardano price movements? Sign up to Changelly’s email list and get the latest news delivered right to your email box!
Become the smartest crypto enthusiast in the room
Get the top 50 crypto definitions you need to know in the industry for free
Cardano Supply
Cardano has a fixed monetary policy (fixed supply), which means that only 45 billion coins will ever be created. No more ADA will ever be produced after that number has been reached.
The coin’s initial offering saw the sale of 25,927,070,538 ADA, with the remaining around 19 billion ADA scheduled for release as a reward for mining blocks on the blockchain.
A deflationary approach alone will not ensure a profit. Always conduct your own research on the cryptocurrency and only invest if you believe that the project behind it has potential.
Cardano remains an incredibly popular cryptocurrency despite having a lot of competition. At the time of writing, it is still one of the top 10 cryptocurrencies in the world by market cap.
Most Cardano price predictions are bullish on this coin. After all, it has all the hallmarks of a successful crypto project: a great team, a supportive community, and a solid technical foundation.
There are also some investors who became disappointed in this coin as they think it was unable to deliver on its promises. However, they seem to be a minority, and most hodlers believe that the future price of ADA will overtake its previous ATH.
ADA Price Prediction by Experts
Various experts have weighed in with their predictions for Cardano’s (ADA) future price, offering a range of perspectives:
TradingBeasts
TradingBeasts displays a cautiously optimistic outlook for ADA. They predict a gradual increase in Cardano’s price, forecasting an average price of $0.6163693 by January 2025. The maximum price for 2025 is projected to be around $0.7704616, with a minimum of $0.5239139.
Digital Coin Price
Digital Coin Price shows a very bullish stance on ADA. Their analysis suggests that ADA’s average price might reach $1.02 in 2024, nearly doubling its current value. They also see a potential for ADA to surpass the $1.37 mark by the end of 2025. Looking further ahead, they anticipate a 210.89% increase in Cardano’s value, meaning it could reach $1.92 by the end of 2026.
Gov Capital
Gov Capital is traditionally bullish on ADA. For January 2025, they forecast an ADA price of $1.2254175424488. Extending their prediction to a 5-year horizon, they anticipate that ADA could climb to $5.592.
WalletInvestor
In contrast, WalletInvestor takes a bearish view on Cardano, predicting a downward trend for ADA’s future price. They suggest that ADA may not be a good investment for the next year, with a forecasted price of around $0.454.
The diverse range of expert predictions sheds light on the potential future price of ADA. Notably, none of these predictions suggest an immediate downturn for Cardano. However, the platform does face significant challenges, such as staying abreast of rapid advancements in blockchain technology and maintaining competitiveness against established giants like Ethereum. Ultimately, the trajectory of Cardano’s success hinges on its ability to continually innovate and carve out a substantial niche for itself in the increasingly competitive market. This necessity to adapt and evolve will be a critical factor in determining Cardano’s future position and value in the crypto space.
It’s important to conduct thorough research before investing in ADA (Cardano) or any other cryptocurrency. Always consider the latest news, market trends, technical and fundamental analyses, and professional advice. Remember, investing in cryptocurrencies involves a high level of risk and it is possible to lose your investment. Past performance is not indicative of future results.
How to Buy Cardano?
To exchange ADA crypto, you need 3 things: a trusted crypto exchange, a good Cardano wallet, and funds to purchase it with.
Buying Cardano is made easily by Changelly! Our platform offers a wide variety of perks, and those include: best rates, transparent low fees, instant transactions, a range of payment options, 24/7 customer support, and more. Give Changelly a chance – try it yourself now!
Can’t load widget
Cardano Price Prediction: FAQ
When looking for an ADA coin price prediction, it’s critical to remember that the cryptocurrency market is incredibly volatile. Because of this, making an accurate long-term forecast for a coin is challenging. Even prognoses for the next few hours are no mean feat! As a result, forecasts made by analysts and algorithm-based forecasters are prone to error.
What could Cardano be worth in 5 years?
While it’s impossible to predict with certainty, combining neutral expert analyses and average predictions from forecasting platforms suggests that ADA’s price could reach around $4.07 by 2029.
What is ADA’s all-time high?
ADA reached its peak price of $3.10 in early September 2021, marking its highest value to date.
What will Cardano be worth in 2025?
Market analysts have varying opinions, but there is a consensus that ADA might achieve a value of approximately $0.9 by 2025.
What will ADA be worth in 2030?
Predicting the exact value of Cardano by 2030 is challenging. However, considering the increasing popularity of cryptocurrencies, ADA could continue its upward trajectory. It is assumed that ADA could reach a value of around $6 by 2030, although this is speculative.
Can ADA reach $100?
As of now, a price of $100 per ADA appears to be a distant prospect for Cardano.
Can ADA reach $10,000 dollars?
A value of $10,000 per ADA is highly unlikely in the foreseeable future.
Disclaimer: Please note that the contents of this article are not financial or investing advice. The information provided in this article is the author’s opinion only and should not be considered as offering trading or investing recommendations. We do not make any warranties about the completeness, reliability and accuracy of this information. The cryptocurrency market suffers from high volatility and occasional arbitrary movements. Any investor, trader, or regular crypto users should research multiple viewpoints and be familiar with all local regulations before committing to an investment.
US jobless claims fell more than expected, indicating solid demand for labor.
US PMI data showed growth in the manufacturing and services sectors.
Tokyo CPI numbers showed inflation easing below the central bank’s 2% target.
The USD/JPY weekly forecast supports further upside as markets anticipate a gradual Fed rate-cutting cycle and a less hawkish BoJ.
Ups and downs of USD/JPY
The USD/JPY pair had a bullish week as market participants focused on the US economy’s resilience. At the same time, inflation figures in Japan eased, lowering expectations for BoJ rate hikes.
US data during the week showed that jobless claims fell more than expected, indicating solid demand for labor. Meanwhile, PMI data showed growth in the manufacturing and services sectors. Consequently, there is less pressure on the Fed to lower borrowing costs.
In Japan, Tokyo CPI numbers showed inflation easing below the central bank’s 2% target, complicating the outlook for BoJ rate hikes and weighing on the yen.
Next week’s key events for USD/JPY
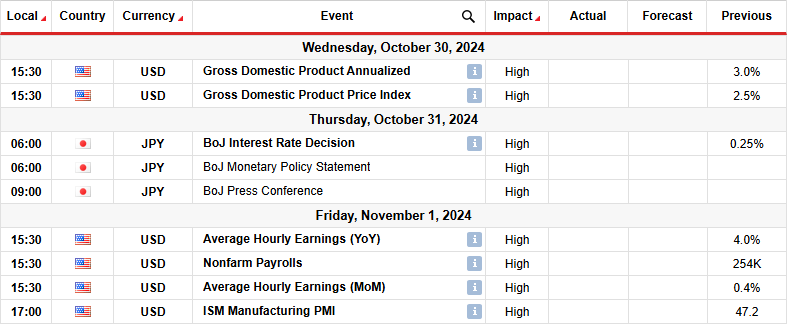
Next week, the Bank of Japan will hold its policy meeting and likely keep rates unchanged. Meanwhile, the US will release data on GDP, monthly employment and manufacturing PMI. The outlook for rate hikes in Japan has shifted with the new Prime Minister and incoming economic data. Ishiba noted that the economy was not ready for more rate hikes. Meanwhile, inflation data has shown weak consumption, further challenging the outlook.
On the other hand, the US economy has remained resilient with robust demand. Therefore, there is a high chance the NFP report will show strong job growth, reducing bets for a November Fed rate cut.
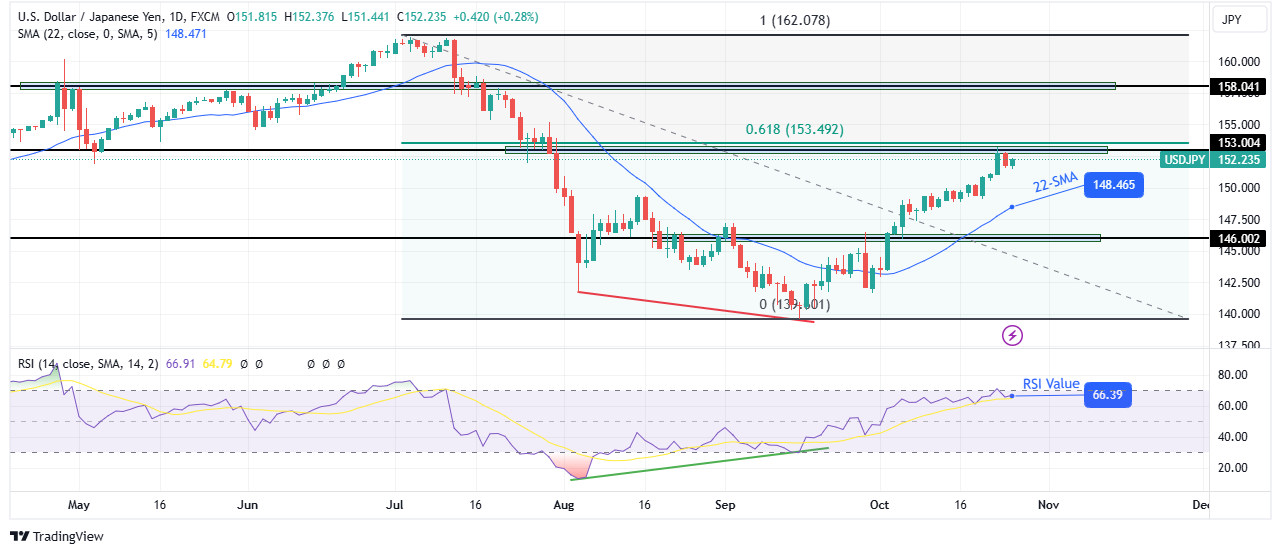
On the technical side, the USD/JPY price has started a new bullish trend that has paused near the 153.00 resistance level. The bullish bias is strong since the price has traded well above the 22-SMA since bulls took control. At the same time, the RSI has stayed near the overbought region, suggesting solid bullish momentum.
–Are you interested to learn more about forex signals? Check our detailed guide-
However, the new bullish trend is facing a solid resistance zone comprising the 0.618 Fib retracement level and the 153.00 psychological level. Therefore, the price might pause at this level before either breaking above or pulling back to retest the SMA support. Nevertheless, as long as USD/JPY stays above the SMA, it will eventually break the resistance zone and retest the 158.04 resistance level.
Looking to trade forex now? Invest at eToro!
68% of retail investor accounts lose money when trading CFDs with this provider. You should consider whether you can afford to take the high risk of losing your money