About Editorial team of BIPNs

Main team of content of bipns.com. Any type of content should be approved by us.
23 10, 2024

what’s next for ADA as Bitcoin struggles? — TradingView News

By |2024-10-23T16:50:15+03:00October 23, 2024|Crypto News, News|0 Comments

Cardano is among the altcoins to pare recent gains as Bitcoin’s hope of getting to $70,000 suffers downside pressure.

With BTC slipping to under $67,000 on Wednesday, major altcoins gave up key gains to trade near support levels.

ADA price showed this outlook on Oct. 23, helping to push the global crypto market capitalization down by 2% to $2.4 trillion.

Bitcoin sees negative action

As the US election nears, one of the key market trends in focus is the crypto performance of major coins.

BTC showed this glimpse with a surge to above $69k this past week. However, the flagship cryptocurrency slipped from highs of $69,230 on Oct. 21 to touch lows of $66,180 two days later.

The downturn wiped the gains seen over the past week, pushing Bitcoin price negative over the weekly time frame.

In this case, continuation could allow bears to target lows seen in mid-October when prices came close to hitting the $65k level.

A negative flow for US spot Bitcoin ETFs, which recorded net outflows for the first time after a seven-day streak of net inflows suggests a flip in investor sentiment.

Stablecoin volumes not spiking as expected also add to the slowdown, with potential profit-taking deals likely to impact altcoins to recently outpace peers in the market.

However, traders are looking at the dips as buy opportunities as the market remains overall bullish. Crypto analyst Cold Blooded Shiller summed up his outlook on this via the chart below shared on X.

Cold Blooded Shiller@ColdBloodShill·Followhttps://twitter.com/ColdBloodShill/status/1849037414871847159

GM $BTC stopping just shy of the $66k sweep but taking out the lows of the last couple of days. Very healthy and very productive price action for bulls through here. Realistically this chart remains bullish regardless of where we trade from here, the only plan I’d like to see…

Image

1:37 pm · 23 Oct 2024https://help.twitter.com/en/twitter-for-websites-ads-info-and-privacy216ReplyCopy linkRead 37 replies

Cardano price outlook

The futures open interest for Cardano (ADA) is up 2.4% in the past 24 hours.

With over $249 million in OI for the 12th-ranked cryptocurrency by market cap, key developments including partnerships could be crucial upward catalysts.

According to Coinglass data, futures open interest in ADA has risen from $152 million in mid-August, which is when Cardano’s price hit the local bottom of $0.28.

Notably, an uptick in OI shows interest in Cardano from traders.

A double-top pattern in July saw ADA crash from $0.43 to $0.28 as the crypto market bled in early August.

In the past three months, bears have also stopped bulls above $0.41 twice.

However, the past month’s action suggests an ascending triangle pattern formation. If market conditions align for a breakout, ADA could reclaim recent supply zones as key support areas.

Nonetheless, the Relative Strength Index (RSI) line is at the 50 mark suggesting potential bearish continuation. Also noteworthy is the Moving Average Convergence Divergence (MACD) indicator.

While signaling a potential bullish strengthening with the crossover, the buy-side pressure is lacking.

Flipping this will be key to bulls. Otherwise, Cardano’s price could retest support near $0.31.

ADA traded around $0.35 at the time of writing.



Source link

23 10, 2024

This Bitcoin and Cardano Model Might Change DeFi Forever

By |2024-10-23T16:41:14+03:00October 23, 2024|News, NFT News|0 Comments


Cover image via www.freepik.com

Disclaimer: The opinions expressed by our writers are their own and do not represent the views of U.Today. The financial and market information provided on U.Today is intended for informational purposes only. U.Today is not liable for any financial losses incurred while trading cryptocurrencies. Conduct your own research by contacting financial experts before making any investment decisions. We believe that all content is accurate as of the date of publication, but certain offers mentioned may no longer be available.

Over the past few years, many community members have advocated for a linkup between Bitcoin (BTC) and Cardano (ADA). Drawing on the positive notion of interoperability, a new research paper spotlighted by Cardano’s validator “Stake With Pride” has teased how both chains can work together.

Bitcoin and Cardano in DeFi

According to the paper’s authors, to properly harness Bitcoin’s hashpower, a proof-of-stake (PoS) linkup is necessary. The authors proposed Babylon, a protocol combining the best proof of work (PoW) and proof of stake (PoS). Beneficial as this is, BTC can finally operate with more energy efficiency, while validation networks can enhance their security systems with this alignment.

Related

What's Wrong With Cardano? ADA Community Debates

Through Babylon, it is feasible for investors to HODL Bitcoin and earn Cardano staking rewards, as teased by Stake With Pride. While staking and yield farming are familiar, the link between Bitcoin and Cardano is as follows:

Cardano has always been touted as a highly technological blockchain. However, its ecosystem is touted as closed, considering it has little or no link with rival chains. This trend is gradually changing as Charles Hoskinson, and the growing number of developers within the ecosystem, are pushing to enhance its interoperability.

If Web3 innovators harness the Babylon framework, it might change the entire course of decentralized finance (DeFi).

Cardano making history

Beyond the prospect of interoperating with Bitcoin, Cardano has also recently made some positive ecosystem milestones. 

One of the most important is the Chang Hard Fork upgrade launch, which ushered in decentralized governance. With this, community members with ADA holdings can have a say in the chain’s future direction. 

Related

Cardano Will Surpass Bitcoin and Ethereum, Charles Hoskinson Hints Timeline

The entire layer-1 ecosystem is moving quickly, and there is strong competition for dominance. While Cardano is focused on decentralization, Ethereum’s cofounder hinges on plans for The Verge, which will further decentralize the chain.

Per his proposition, the goal remains to improve the Ethereum validation system so that it can run on mobile devices, making it feasible for everyone.


Source link

23 10, 2024

Crude Oil Forecast Today – 23/10: WTI Rallies (Chart)

By |2024-10-23T16:33:17+03:00October 23, 2024|Forex News, News|0 Comments


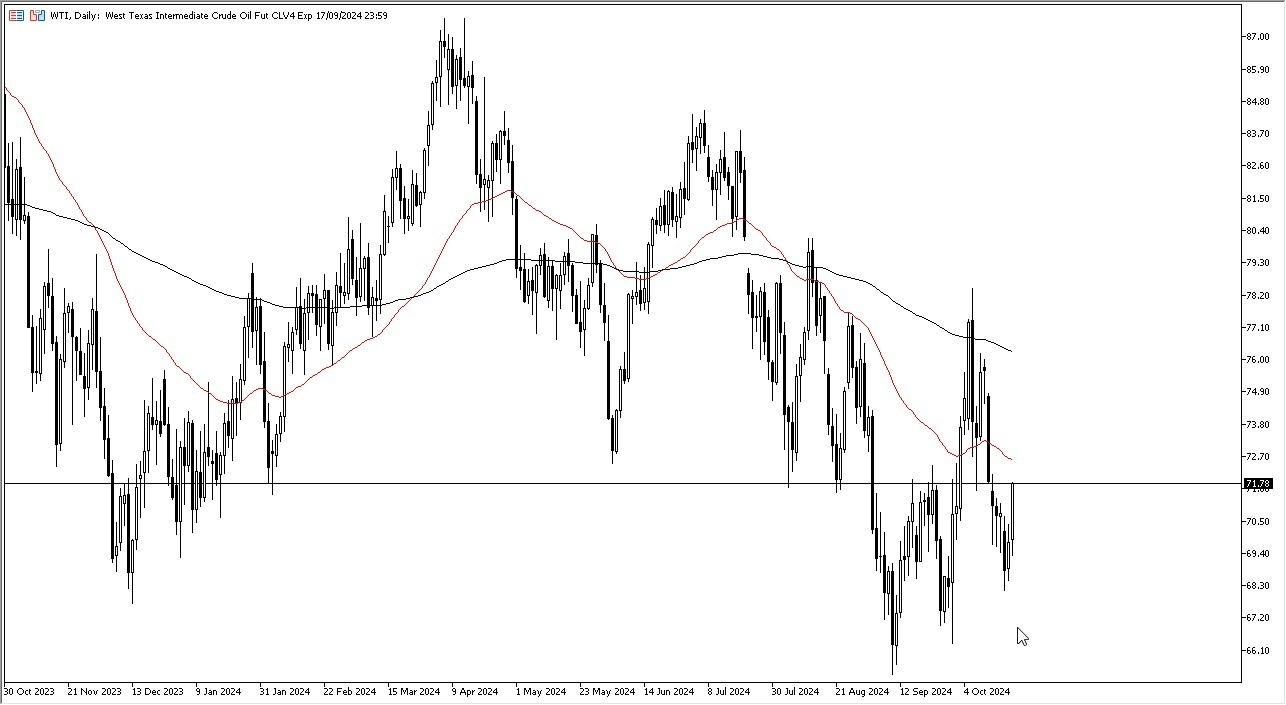
  • During my daily analysis of the West Texas Intermediate Crude Oil market, it’s obvious that we have seen a lot of buying pressure on Tuesday.
  • At this point in time, the market is likely to continue to see a little bit of momentum based on the size of the candlestick, and it is probably worth noting as well, that most of the headlines and pundits around the world believe that this is based on the idea of renewed Chinese demand, or at least the optimism surrounding the possibility of it.

Furthermore, we also have geopolitical escalations out there that continue to be a major issue. Quite frankly, the Middle East isn’t calming down, and one would have to think that sooner or later it would have an influence on the oil market. I don’t necessarily think that the market is paying close attention to it right now, because quite frankly it’s been rather lackluster as of late. All things being equal, I think most of this comes down to the idea of demand, as traders are assuming that the conflict involving Israel and several factions in the Middle East probably won’t spread.

It was an extraordinarily bullish day on Tuesday, but we also have to pay attention to the fact that the 50 Day EMA sits right around the $72.70 level and is dropping. I would anticipate that the 50 Day EMA could offer a little bit of a ceiling in the market, as it is so widely followed. If we were to break above there, then I think it’s likely that we will continue to see oil go much higher, perhaps reaching the 200 Day EMA which is sitting just above the $76 level.

On the downside, there seems to be a significant amount of support at multiple levels, not the least of which would be the $66 level, which is the bottom of the range for the last 2 years. I think we are just simply bouncing from the lows, and that if you are a buyer of this market, you are essentially doing it for a short-term trade more than anything else. I would expect plenty of volatility in this general region.

Ready to trade oil price analysis and predictions? Here are the best Oil trading brokers to choose from.


Source link

23 10, 2024

Effect of antenatal use of high energy nutritional supplements on cardio metabolic risk markers in underweight primi gravidas; a randomized controlled trial | BMC Pregnancy and Childbirth

By |2024-10-23T15:18:25+03:00October 23, 2024|Dietary Supplements News, News|0 Comments


The Advanced Study and Research Board (ASRB) authorized (ASRB000669/EH/IBMS) and the Ethical Committee of Khyber Medical University approved this study under (DIR/KMU-EB/EH/000453) and permission was taken from the respective tertiary care hospitals. This trial is also registered in ISRCTN registry under (ISRCTN 10088578) dated 27/03/2018. Our study adheres to CONSORT guidelines. After obtaining the approval, recruitment was started from the province of Khyber Pakhtunkhwa tertiary care facilities and clinical trial room set up in those respective hospitals for the convenience of the participants. Simple random sampling was done and Open Epi software was used to calculate sample size. This sample size was calculated based on the difference in the main outcomes of this study (Insulin) from studies conducted by Stratton et al. 2008 and Fatima et al. 2015, considering 85% power and CI of 95%, 24 participants are required to conduct this study [18, 19]. Keeping in mind 20% dropout rate, Thirty six Primi underweight participants were selected from the OPDs of the concerned gynecology and obstetrics departments.

It was a single blinded randomized controlled trial in which participants are randomly assigned to either the intervention group (receiving the supplement) or the control group (receiving a placebo) using Computor randomizer(version3). Only the participants are unaware of which group they have been assigned to, while the researchers administering the treatment knew which participants are in the intervention or control groups.

Inclusion criteria

Underweight primigravidas having a BMI < 18.5 kg/m2.

Exclusion criteria

underweight primigravida having any major illness like hypertension, gestational diabetes mellitus, thyroid or liver disorders. Also those primigravidas already on long term supplementation or other medication or having allergy to supplements were excluded from this study.

The recruitment of the participants is shown in Fig. 1. The participants were informed about the objectives of this study and informed consent was asked for at the start of the study.Participant were requested to make three visits, one at baseline, second between 16 and 20 weeks gestation and a post natal visit. Nutritional counseling was given to the participants in addition to prenatal care.

Fig. 1

recruitment of participants for this study

A high-energy nutritional supplement called “MAAMTA” with 400 kcal/75 gm of energy that was made with peanut butter was given to the HENS group, while the placebo consisted of 75 gm of wheat flakes, 40 ml of skimmed milk, and two tablets of artificial sweetener (Canderal). Per 75 grammes, it contains 137.8 calories (Fig. 2). The participants were asked not to discard the sachet s of their supplements/placebo, which were collected by the main researcher at the end of each week. Any leftovers in the sachet were measured and deducted from 75gms to make sure the exact amount taken by the participants.In addition to their regular diet and prenatal care, participants of both groups were instructed to take the HENS/placebo throughout the duration of their pregnancy as well as one week after giving birth.

For baseline visit the participants were invited to attend a trial in the trial room in a fasted state. After they were acclimatized to the environment, anthropometric measurements were taken and 5 ml blood was taken from them in a 5 ml BD syringe, then the plunger was removed (to avoid hemolysis) and 2 ml of this blood was put into an EDTA vacutainer TM tube, 2 ml in gel tube and 1 ml in an Eppendorf tube containing 200 µl of aprotonin (a bovine origin pancreatic inhibitor).The sample with EDTA and aprotonin were put in the refrigerator while the sample in gel tube was placed in a stand for serum to get separated. Afterwards were served with juice and light breakfast. They were given incentive of Rs.1000 and were also given nutritional counseling. The date for their next visit was calculated and written on their prescription from their antenatal visit. They were reminded of the second visit two days before the visit telephonically. The same procedure was repeated as on the first visit. Similarly, they were asked to make a post natal visit, after their condition was stabilized. Fasting blood samples and anthropometric measurements were taken.

The anthropometric measurements that were taken included, height using a seca Leicester 214 (portable standiometer) and weight, body fat, hydration and bone was calculated using bioelectrical impedance scale by (Beurer GmbH, Soflinger str.218 89077 Ulm, Germany Art._Nr.748.13, TypeBF220). The mid upper arm circumference (MUAC) was determined using a strip used was a validated World Food Programme strip. The same strip was used throughout the study.

Metabolic Syndrome Criteria (NCEP ATP III, IDF, WHO) [20] was used to assess cardiometabolic risk factors. Metabolic syndrome is a significant indicator of cardiometabolic risk. The criteria vary slightly between different guidelines, but typically include:

  • Waist circumference (Central Obesity)

  • NCEP ATP III: ≥102 cm (40 inches) for men, ≥ 88 cm (35 inches) for women.

  • IDF: ≥94 cm for men, ≥ 80 cm for women (values may differ by ethnicity).

Having three or more of these factors typically indicates metabolic syndrome.

Data analysis

Biochemical parameters like Insulin was analysed by the electro chemi luminescent immunoassay “ECLIA”technique. Fasting blood glucose and lipid profile by enzymatic colorimetric method using cobas501 analyzer.

Insulin resistance

The HOMA model by Matthews et al.,1985 has shown to be a valid clinical and epidemiological technique for assessing insulin resistance. HOMA uses a basic nonlinear equations to describe glucose insulin homeostasis [21].

HOMAIR index is calculated according to the formula.

HOMAIR; fasting glucose in m mol/l × fasting insulin in mU/ml/22.5

$$eqalign{& {bf{HOM}}{{bf{A}}_{{bf{IR}};}},, {bf{fasting}},, {bf{glucose}},, {bf{in}},, {bf{m}},, {bf{mol}}/{bf{l}} cr & ,,,,,,,,,,,,,,,,,,,,,,,,, times {bf{fasting}},, {bf{insulin}},, {bf{in}},, {bf{mU}}/{bf{ml}}/{bf{22}}.{bf{5}} cr}$$

Statistical analysis

Statistical analysis was performed using version 20 of IBM SPSS ®. Weight, height, age, and BMI were taken as mean ± standard deviation. Normality of the data was checked using Shapiro-Wilk test while the primary & secondary outcomes was analysed using repeated measure ANOVA. Mauchly sphericity test was employed for P value reporting, in case of sphericity was not significant then we used Greenhouse-Geisser test. Insulin resistance was calculated by HOMAR model.

Fig. 2
figure 2

Nutritional value of 75gms of MAAMTA and Placebo


Source link

23 10, 2024

EUR/USD Analysis Today – 23/10: Downward Trend (Chart)

By |2024-10-23T14:56:22+03:00October 23, 2024|Forex News, News|0 Comments

  • Reducing expectations for further US rate cuts continues to drag on EUR/USD, with losses extending below the psychological support level of 1.0800 to the support level of 1.0792.
  • Furthermore, the currency pair is at the lowest level in more than two and a half months.
  • Amid this performance the US dollar index rose above 104.1 on Wednesday, recording its highest levels since early August as investors continued to reduce bets on aggressive interest rate cuts by the Federal Reserve, while preparing for the upcoming US presidential elections.

Also, the US dollar is tracking the rise in Treasury yields, with the benchmark 10-year Treasury note reaching 4.22% for the first time since late July amid strong economic data and concerns about the deficit. Now, markets are pricing in a 90% probability that the Fed will opt for a more modest 25-basis point interest rate cut in November after a hefty 50-basis point cut in September. Concurrently, Investors are looking to the Federal Reserve’s Beige Book for updates on the central bank’s economic outlook.

According to forex trading, the US dollar is hovering at multi-month highs against other major currencies, with buying activity most pronounced against the yen.

In general, financial markets have increased their expectations for further rate cuts by the European Central Bank. The ECB cut interest rates for the third time this year, citing improved inflation control but a deteriorating economic outlook for the euro zone. ECB President Christine Lagarde’s comments were interpreted as a signal of a downward revision of economic forecasts, prompting markets to expect a 25bp cut at each meeting until mid-2025.

Investors are closely watching upcoming economic data, including PMI figures, which are expected to confirm the sluggish regional performance and potentially support further ECB action. A 25bp rate cut in December is widely expected, with a 30% chance of a larger 50bp cut. Meanwhile, strong US economic data has dampened expectations of a more aggressive rate cut by the Fed.

EUR/USD Technical analysis and forecast:

No change in my technical view on EUR/USD forecast as the overall trend remains bearish and breaking the 1.0800 psychological support strengthens the bears’ control over the trend and heralds a deeper downside move. Next up will be 1.0745 and 1.0600, respectively. These are enough to push all technical indicators towards strong oversold levels. On the other hand, and on the same time frame, the daily chart will not break the bearish outlook without the currency pair first moving above the psychological resistance of 1.1000. Aslo, the euro price will be affected today by new statements from the Governor of the European Central Bank, Lagarde.

Ready to trade our EUR/USD daily forecast? We’ve shortlisted the best forex broker list for you to check out. 

Source link

23 10, 2024

XRP Price Prediction: Institutional Interest Expected To Drive XRP To New ATHs This Bull Market

By |2024-10-23T14:49:35+03:00October 23, 2024|Crypto News, News|0 Comments

Analysts are predicting a positive surge in the value of XRP price to a new all time high in this bull market as well as WallitIQ (WLTQ) which is set to surge massively.

With 2024 coming to an end, the remaining couple of months is set to be filled with predictions of new ATHs and a general market frenzy that analysts believe will result in a bull market. One of the top performing assets in the year is Ripple (XRP), and observers are projecting new ATHa in XRP price before the end of the year. However, Ripple (XRP) is not the only asset showing strong potential this year, another token to watch out for in the bull market is WallitiQ (WLTQ).

WallitIQ (WLTQ) – A New Frontier for Artificial Intelligence in Crypto Trading 

Traders and Investors looking to make the best of use of the bull market are always on the lookout for assets with low risk and a high yield, and that’s exactly what WallitIQ (WLTQ) provides. It is one of the most promising utility tokens poised to soar to new ATHs in the bull market by up to 2,000%. This prediction is due to the offerings of the WallitIQ (WLTQ) ecosystem.

Holders and users of the WallitIQ (WLTQ) platform and its native token get to interact with an intelligent chatbot that can provide guidance and timely information on market trends and the latest trading techniques. The AI system will also help in predictive and behavioral analysis for trading assets in crypto markets. This would especially come in handy when trading in the coming Bull market.

For traders who are concerned about the security of their assets and suspicious activity on the accounts. WallitIQ (WLTQ) through its AI system employs Escrow Connect Technology that helps to continuously monitor wallet activity and detects any suspicious or unusual behavior. This single feature helps to assure investors of the safety of their assets and account when they use WallitIQ (WLTQ).

To help facilitate a smooth trading experience, WallitIQ offers an intuitive interface that will contain users’ preference such as trend tables, real-time portfolio summary and customizable notifications. Meaning users can be on par with the latest happenings in the market and get notified quickly of changes in price or a market frenzy especially in a bull market.

As amazing as the features of the WalliIQ (WLTQ) platform, the utility for token holders are even more impressive. The most important utility is that token holders get to be actively involved in the governance and development of the token. Also token holders can get up to 180% APY when they stake the token. Staking not only gives holders an opportunity to earn passive income but also promotes the stability and engagement with the WallitIQ ecosystem.

Holders of the token also get to enjoy competitively low transaction costs when using their WallitIQ (WLTQ) wallet. So, users will not need to convert their assets into other cryptocurrencies and incur unnecessary gas fees. WallitIQ (WLTQ) provides an all-encompassing solution-oriented experience for users. With its recent debut on Coinmarketcap, the token is poised to list on major crypto exchanges like Binnace, Coinbase, and the like.

XRP price tipped for a rise ahead of projected Bull Market.

XRP price has continued to maintain a relatively stable value in the course of the year. With a market cap of over 30 billion dollars, the XRP price is no doubt one of the highest in 2024, and still set to potentially hit new ATHs.

It is even more impressive that investments by institutional interests have risen by over 266%, given the fact that XRP price has been affected by scrutiny of the US SEC. Experts believe these investments are driven by the utility of the Ripple Network and its token XRP. The XRP price has passed the 50 cent mark and projections are that it will soar to new ATHs especially as a bull market approaches.

Experts also maintain confidence in the rise in value of WallitIQ (WLTQ) based on a similar sentiment of the XRP price. Driven by its ongoing presale success, market analysts project new ATHs for the WLTQ token ahead of the bull run.

Conclusion

WallitIQ (WLTQ) is in its first stage of presale and the price is pegged at $0.0171 at this stage. Indicators point to a steady rise in price to new ARHs in the later presale stages. Early adopters will be looking to be making a return in the range of 2,000% when the asset increases in value in the coming bull run as XRP price potential rise to new ATHs may not bring as many returns as the WLTQ token.

Join the WallitIQ (WLTQ) presale and community: 

Join WallitIQ (WLTQ) Presale
Join the WallitIQ (WLTQ) Community


This is a sponsored article. Opinions expressed are solely those of the sponsor and readers should conduct their own due diligence before taking any action based on information presented in this article.

Source link

23 10, 2024

XAU/USD Analysis Today – 23/10: Gold Hits Peak (Chart)

By |2024-10-23T14:32:21+03:00October 23, 2024|Forex News, News|0 Comments


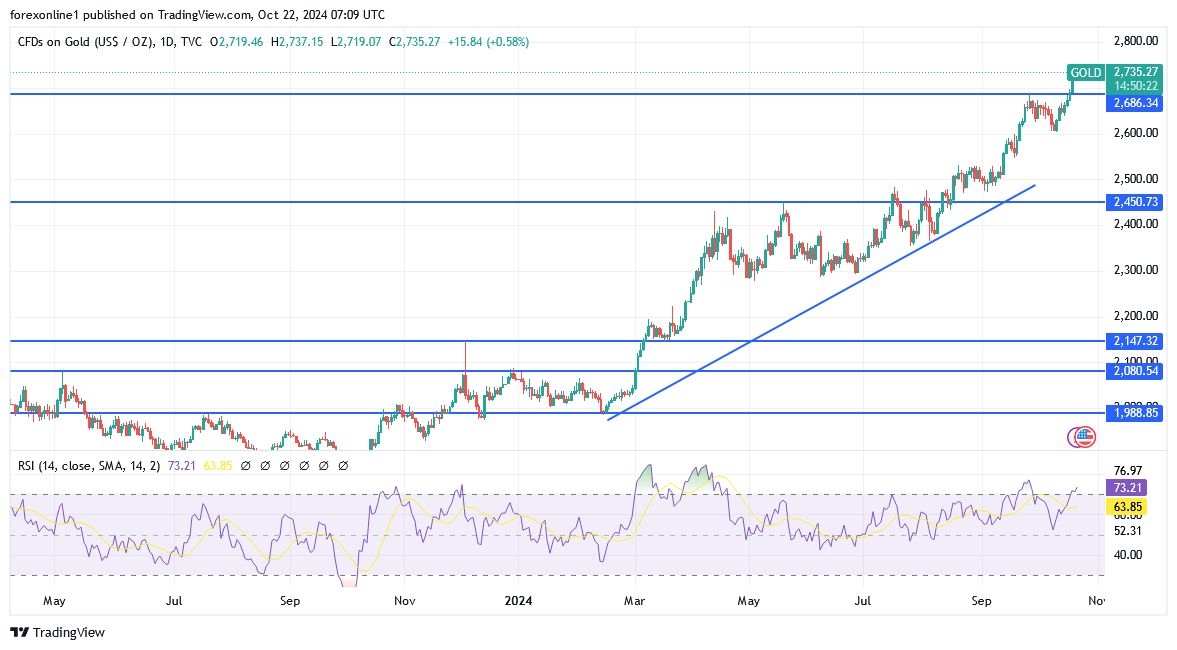
  • Despite the strong gains of the US dollar, the price of gold rose to around $2753 per ounce, trading at record levels, the highest in the history of the gold market.
  • Its successive gains were supported by its status as a safe-haven asset.
  • Reports indicated that tensions in the Middle East and broader global uncertainties have raised concerns about conflict escalation, further boosting demand for gold as a secure investment option.

In addition, the narrow US presidential election, which is only a few weeks away, is increasing demand for safe havens. At the same time, monetary easing from major global central banks is supporting the upward momentum of gold, as the People’s Bank of China and the European Central Bank recently cut key lending rates. At the same time, traders are assessing different views from Federal Reserve officials on the future path of US monetary policy.

In this regard, Kansas City Federal Reserve President Jeffrey Schmid is calling for a slower pace of interest rate cuts, while San Francisco Federal Reserve President Mary Daly stresses the need for further cuts to protect the Labor market.

According to gold trading platforms, gold prices are rising due to an imbalance between supply and demand. Gold prices had risen to an all-time high of $2,753 per ounce as investors sought safe-haven assets amid rising geopolitical tensions. Consequently, this means that the price of the yellow metal has risen by 38 percent this year 2024. The rise in gold bullion prices came as the conflict between Lebanon and Israel intensified, with concerns growing about a broader regional escalation. At the same time, uncertainty about the outcome of the US elections, with particular concerns about the improvement in Donald Trump’s chances in betting markets, has also pushed investors towards safe-haven assets.

Gold Price Analysis and forecast Today:

According to analysts, “gold usually attracts the attention of investors when they are looking for a store of value during uncertain times.”

Obviously, Gold is a proven hedge against inflation as investing in it is seen as preserving the real value of assets when other prices rise. It remains resilient when other markets are not. According to gold market analysis experts, “The gold price index tends to rise as interest rates fall due to the decline in the return on cash from banks, or bonds from governments, which pushes investors away from cash or debt towards the metal. And “A Trump victory in the US presidential election would increase the risk of a trade war, and his provocative nature could lead to increased uncertainty in the markets. And owning gold is essentially an insurance policy against the unknown.”

Analysts noted that investors’ appetite for gold has been boosted by “the risk of spillover into a wider conflict in the region” and uncertainty around the upcoming elections, making gold an attractive asset for those seeking to hedge against market volatility. The rising price of gold is a direct reflection of the fear and uncertainty facing investors.”

On the other hand, Chinese stimulus and a strong US economy are also boosting demand for gold. In addition to geopolitical factors, the second factor is the old supply and demand factors that affect the price of gold. Gold demand hit an all-time high in Q2, and we expect this rally to continue into Q3, and in the absence of increased supply, the price of gold will naturally rise.

Gold’s latest achievement comes amid growing concerns over conflicts in the Middle East and a tight US presidential election. Moreover, Gold is widely seen as a safe haven asset and attracts investors during times of geopolitical uncertainty. Furthermore, central banks around the world have been buying bullion in large quantities over the past year.

According to recent trading, the price of gold has risen by about 2.4% over the past week, as violence in the Middle East escalated and opinion polls showed a tight tie in the US presidential election. Furthermore, the gold price index is now up more than 30% this year as interest rates have been cut amid strong buying by central banks. Gold is not the only metal on the rise. Recently, Silver has jumped 5.5% in recent days and is now at its highest level since 2012. Also, Palladium and platinum are also on the rise.

Ready to trade today’s Gold forecast? Here are the best Gold brokers to choose from. 


Source link

23 10, 2024

Brits just realising they have been making tea wrong, says expert

By |2024-10-23T13:17:17+03:00October 23, 2024|Dietary Supplements News, News|0 Comments


As a nation of tea drinkers, you may be surprised to know some people have been making their brew incorrectly.

Brewing the perfect cup of tea is all about finding the sweet spot between time and temperature, says Arthur Gautier of Nio Teas, a brand specialising in Japanese green teas.

He said: “Each type of tea needs to be brewed using its own distinct method to bring out its best flavours.”

To clear up any mistakes you might be making with tea, Arthur has revealed the correct brewing methods for a number of different teas, including black, white, green and oolong.

Follow his advice, and you’ll be a master of tea in no time.

How to make the perfect cup of tea

Black tea

Black tea, with the highest caffeine content of all teas, is a popular choice for a morning cuppa, and although it originates from China, there are now numerous other black teas on the market, including Indian Darjeeling and Assam and Sri Lankan Ceylon.

For the perfect cup, Arthur suggests brewing in water that has reached 200-212°F / 93-100°C, and allowing the tea to steep for three to five minutes.

He added: “For a richer flavour, don’t rush the steep! However, longer steeping adds more caffeine and can turn the tea bitter, so experiment to find your sweet spot.”

Green tea

Green tea has become increasingly popular with people in the UK in recent years. Discussing the range of green teas currently available, Arthur said: “The flavour can range from sweet and floral to slightly grassy or even nutty, with Chinese and Japanese varieties each offering distinct profiles.

“Sencha, Dragonwell, and Matcha are some popular green tea types, with Matcha standing out as a powdered version of the whole leaf.”

For brewing a cup of green tea, Arthur advises that the water should be simmering, not boiling, suggesting 160-180°F / 71-82°C is the perfect temperature and should be left to steep for two to three minutes – any longer, or hotter, and it risks turning bitter.

White tea

The least processed of all teas (and the least caffeinated), white tea originates from China, particularly the Fujian province, where it is known for its subtlety and elegance.

If making a cup of white tea, Arthur suggests letting the water cool for slightly after boiling, until it reaches 160-170°F / 82-93°C and then allowing to steep for four to five minutes.

Oolong tea

Oolong tea is traditionally grown in China and Taiwan and falls somewhere between green and black tea in terms of how it’s processed.

When brewing at home, Arthur advises using water a little cooler than you would for black tea, opting for 180-200°F / 76-82°C, and leaving to steep for three to five minutes. He adds that oolong can even be re-steeped for a deeper, more layered taste.


Source link

23 10, 2024

US Dollar Forecast: ECB Awaits Lagarde’s Speech at BRICS Summit; Gold, GBP/USD and EUR/USD Outlook

By |2024-10-23T12:55:19+03:00October 23, 2024|Forex News, News|0 Comments

Gold – Chart

Gold (XAU/USD) remains bullish at $2,750.21, with support at $2,738.16. Resistance is at $2,754.01, and the 50-day EMA of $2,719.07 strengthens the trend. A break below support could signal sharper declines.

Sterling Awaits Key BOE Speeches Amid IMF Meetings

Sterling (GBP) remains steady as traders anticipate key speeches from MPC member Breeden and BOE Governor Bailey. Both talks are expected to offer insights into future monetary policy, so the pound may experience heightened volatility.

These speeches, alongside ongoing IMF meetings, could provide crucial guidance for the pound’s short-term direction.

Investors will be looking for any signals on interest rate adjustments or economic outlook, which could influence market sentiment and GBP movement.

GBP/USD Technical Analysis

GBP/USD is trading at $1.29688, down 0.11%, staying just below its pivot point of $1.29915. This level is key—if the pair breaks above it, we could see a stronger bullish bias, with immediate resistance at $1.30154 and further levels at $1.30531 and $1.30770.

Source link

23 10, 2024

XAG/USD hovers near $34.50, 12-year highs

By |2024-10-23T12:31:19+03:00October 23, 2024|Forex News, News|0 Comments


  • Silver price holds position near a 12-year high of $34.87, recorded on Tuesday.
  • The demand for safe-haven Silver rises amid escalating tensions in the Middle East.
  • The tight situation in the upcoming US election has further heightened demand for safe-haven assets.

Silver price (XAG/USD) halts its six-day winning streak, trading around $34.87 per troy ounce, the highest level not seen since October 2012, during Asian trading hours on Wednesday. The outlook for Silver is bullish, driven by safe-haven demand amid escalating tensions in the Middle East.

On Tuesday, Israel confirmed the death of Hashem Safieddine, the successor to the late Hezbollah leader Hassan Nasrallah, who was killed in an Israeli operation last month. The Israeli military stated that Safieddine was killed in a strike conducted three weeks ago in the southern suburbs of Beirut, according to Reuters.

Additionally, US Secretary of State Antony Blinken conveyed to Israeli Prime Minister Benjamin Netanyahu on Tuesday that Israel’s efforts to facilitate increased humanitarian aid into Gaza have been inadequate. Blinken urged Israel to take further action to improve the situation.

The upcoming US election has further heightened demand for safe-haven assets like Silver. A recent Reuters/Ipsos poll indicates that Democratic Vice President Kamala Harris holds a narrow lead of 46% to 43% over former Republican President Donald Trump.

This lead, recorded in a six-day poll that closed on Monday, is only slightly up from her 45% to 42% advantage in a poll conducted a week earlier, highlighting the tightness of the race with just two weeks remaining before the November 5 election.

Additionally, demand for non-yielding Silver has been boosted by monetary easing measures from major central banks. The People’s Bank of China (PBoC) and the European Central Bank (ECB) have both recently reduced key lending rates, contributing to increased interest in Silver.

Furthermore, the Bank of Canada (BoC) is expected to announce a significant interest rate cut of 50 basis points during its upcoming monetary policy meeting on Wednesday. In contrast, expectations for aggressive rate cuts by the Federal Reserve have decreased following a series of positive economic data.

Silver FAQs

Silver is a precious metal highly traded among investors. It has been historically used as a store of value and a medium of exchange. Although less popular than Gold, traders may turn to Silver to diversify their investment portfolio, for its intrinsic value or as a potential hedge during high-inflation periods. Investors can buy physical Silver, in coins or in bars, or trade it through vehicles such as Exchange Traded Funds, which track its price on international markets.

Silver prices can move due to a wide range of factors. Geopolitical instability or fears of a deep recession can make Silver price escalate due to its safe-haven status, although to a lesser extent than Gold’s. As a yieldless asset, Silver tends to rise with lower interest rates. Its moves also depend on how the US Dollar (USD) behaves as the asset is priced in dollars (XAG/USD). A strong Dollar tends to keep the price of Silver at bay, whereas a weaker Dollar is likely to propel prices up. Other factors such as investment demand, mining supply – Silver is much more abundant than Gold – and recycling rates can also affect prices.

Silver is widely used in industry, particularly in sectors such as electronics or solar energy, as it has one of the highest electric conductivity of all metals – more than Copper and Gold. A surge in demand can increase prices, while a decline tends to lower them. Dynamics in the US, Chinese and Indian economies can also contribute to price swings: for the US and particularly China, their big industrial sectors use Silver in various processes; in India, consumers’ demand for the precious metal for jewellery also plays a key role in setting prices.

Silver prices tend to follow Gold’s moves. When Gold prices rise, Silver typically follows suit, as their status as safe-haven assets is similar. The Gold/Silver ratio, which shows the number of ounces of Silver needed to equal the value of one ounce of Gold, may help to determine the relative valuation between both metals. Some investors may consider a high ratio as an indicator that Silver is undervalued, or Gold is overvalued. On the contrary, a low ratio might suggest that Gold is undervalued relative to Silver.


Source link

Go to Top