About Editorial team of BIPNs

Main team of content of bipns.com. Any type of content should be approved by us.
1 07, 2025

Solana (SOL) Price Prediction 2025 & Current Trends

By |2025-07-01T19:36:22+03:00July 1, 2025|Crypto News, News|0 Comments

  • Solana (SOL) is currently trading at $149 with a slight dip but increased trading volume.
  • Technical analysis suggests critical support at $138.25 and a bullish breakout trigger at $159.
  • Price forecasts for 2025 vary, with predictions ranging from $155 to over $320 depending on market conditions.

Solana (SOL) is currently trading at $149.05, down a minor 0.7% in recent hours. Despite that minor dip, however, the token’s volume has experienced an unprecedented spike in the last 24 hours to record a 78.7% increase at $5.07 billion. Over the last week, the SOL value experienced relative stability with a minor positive swing of 3.48%, hitting around $149.06.

This recent market trend can be described as a process of consolidation following past volatility, with traders and investors eagerly waiting for imminent triggers of prices and technicals. The strength recorded in trading volumes despite minimal price fall indicates ongoing interest in SOL, which suggests that market dynamics of the coin stand to experience significant events in the short run.

Ascending Trendline Supports SOL’s Upward Momentum

Crypto analyst Sonia S. identifies a bullish pattern in recent SOL price movement. The token has reportedly come out of a downtrend and now consolidates in the area of $148. Notably, the token remains supported by an upward trendline that analysts regard as an important point for continuing upward momentum.

AD 4nXf2Z KzfccEVOnQ fv8zmbx0WhdYFneIqXAq OdAkUjljQQ65
Source: X

Also Read | REX-Osprey to Debut First Staked Solana ETF on Wednesday; SOL gains 5%

Support that was registered has been at $138.25, and a breakdown through $159 could trigger a huge rally. In case SOL breaks through this breakdown trigger with heavy volume strength, the token can seek higher levels of prices in the region of $180 to $210. Unable to hold back the trendline, it can register a retreat to support of $138, pointing to a correction.

Solana Price Predictions for 2025

DigitalCoinPrice estimates that SOL has the potential to cross its previous all-time high and may cross anywhere between $295.67 and $327.74 in 2025. They highlight an important milestone at $289.36 that SOL crossed in early January 2025 but also highlight potential dips below $175.45 levels that have not been seen since early 2021.

Changelly’s technical prediction has a less exuberant forecast for 2025. Their forecast states that SOL will trade with an even smaller margin, with prices of $155.27 to $157.06 and an average of around $158.85. The prediction has a moderate ROI of around 4-5.2%, with prices rising incrementally in mid-2025.

Also Read | Backed Finance Launches 60 Tokenized Stocks on Kraken, Bybit, and Solana DeFi

Source link

1 07, 2025

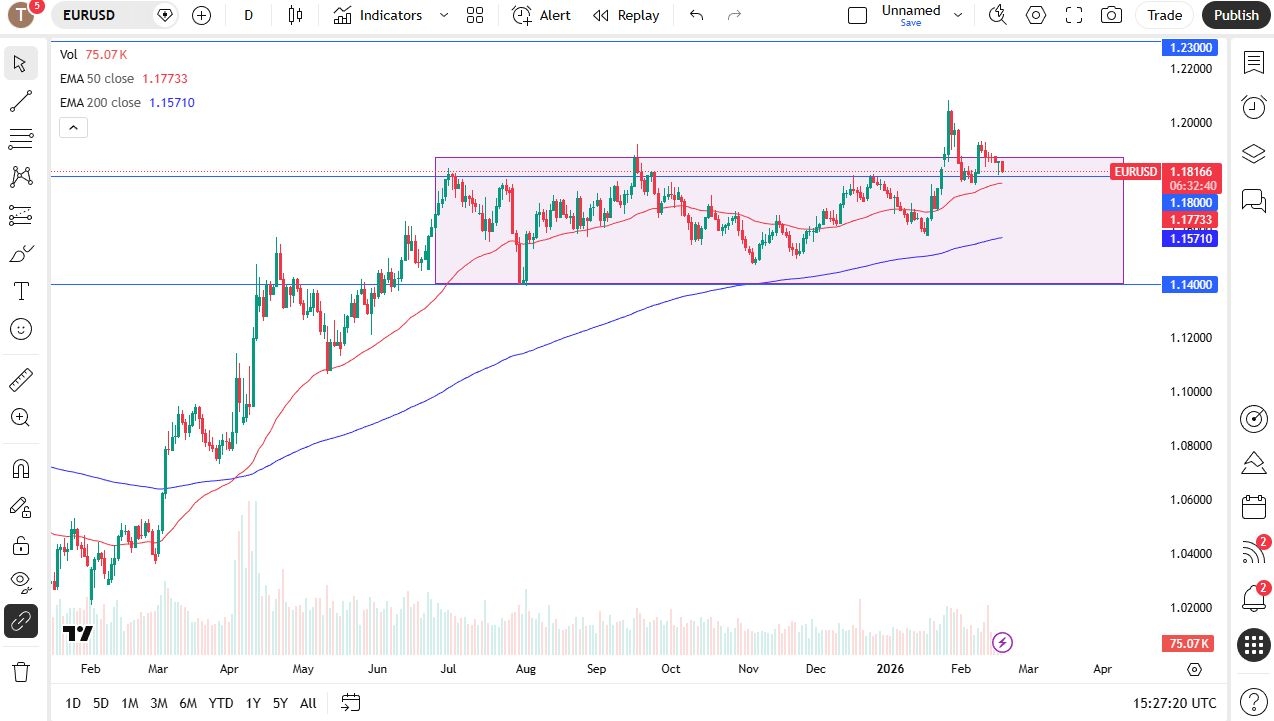
Forecast update for EURUSD -01-07-2025

By |2025-07-01T17:46:40+03:00July 1, 2025|Forex News, News|0 Comments


Natural gas price lost the positive momentum yesterday, affected by stochastic stability below 50 level, forcing it to form bearish waves to settle near the support base at $3.460 level, to form strong and important resistance to detect the main trend in the upcoming trading.


The stability of the current support will reinforce the chances for regaining the bullish bias, to expect its rally towards $3.600, then attempts to reach the extra initial target at $3.830, while the continuation of the negative pressures and its decline below the current support will confirm its move to the bearish track, which forces it to suffer several losses by targeting $3.320 and $3.140 level.


The expected trading range for today is between $3.450 and $3.600


Trend forecast: Bullish


Source link

1 07, 2025

Pound Sterling could face stiff resistance at 1.3830

By |2025-07-01T17:45:28+03:00July 1, 2025|Forex News, News|0 Comments

  • GBP/USD trades at its highest level since October 2021 above 1.3770.
  • Comments from central bankers will be watched closely by market participants.
  • The pair could encounter strong resistance at 1.3830.

GBP/USD gathers bullish momentum following Monday’s choppy action and trades at its highest level since October 2021 above 1.3770. In the second half of the day, macroeconomic data releases from the US and comments from central bankers could drive the pair’s action.

British Pound PRICE This week

The table below shows the percentage change of British Pound (GBP) against listed major currencies this week. British Pound was the strongest against the US Dollar.

USD EUR GBP JPY CAD AUD NZD CHF
USD -0.76% -0.49% -1.03% -0.71% -0.74% -1.03% -1.35%
EUR 0.76% 0.24% -0.24% 0.04% 0.00% -0.26% -0.60%
GBP 0.49% -0.24% -0.69% -0.21% -0.24% -0.52% -0.85%
JPY 1.03% 0.24% 0.69% 0.31% 0.33% 0.04% -0.28%
CAD 0.71% -0.04% 0.21% -0.31% -0.08% -0.32% -0.64%
AUD 0.74% -0.00% 0.24% -0.33% 0.08% -0.28% -0.61%
NZD 1.03% 0.26% 0.52% -0.04% 0.32% 0.28% -0.32%
CHF 1.35% 0.60% 0.85% 0.28% 0.64% 0.61% 0.32%

The heat map shows percentage changes of major currencies against each other. The base currency is picked from the left column, while the quote currency is picked from the top row. For example, if you pick the British Pound from the left column and move along the horizontal line to the US Dollar, the percentage change displayed in the box will represent GBP (base)/USD (quote).

Following the previous week’s sharp decline, the US Dollar (USD) Index stays under bearish pressure early Tuesday, fuelling GBP/USD’s rally.

The risk-positive market atmosphere and increasing political pressure on the Federal Reserve (Fed) continue to weigh on the USD. White House press secretary Karoline Leavitt said late Monday that US President Donald Trump sent a handwritten note to Fed Chairman Jerome Powell, asking him to lower interest rates. She further noted that Trump believes interest rates should be lowered to about 1%.

Meanwhile, Bank of England (BoE) Governor Andrew Bailey reiterated on Tuesday that the path of interest rates will continue to be gradually downwards.

“The increase in uncertainty is coming through in terms of economic activity and growth,” Bailey added. “Businesses tell me they are putting off investment decisions.” Nevertheless, these comments failed to influence Pound Sterling’s valuation.

Later in the day, JOLTS Job Openings data for May and the ISM Manufacturing PMI data for June will be featured in the US economic calendar. The market reaction to these releases is likely to be straightforward and remain short-lived. In case both of these data offer positive surprises, the USD could stage a rebound and trigger a downward correction in GBP/USD.

Moreover, BoE Governor Bailey and Fed Chairman Powell will participate in a policy panel at the ECB Forum on Central Banking in Sintra, Portugal. In case Powell suggests that they are unlikely to consider a rate cut until September and continue to assess the impact of tariffs on inflation, the USD could stay resilient against its peers.

GBP/USD Technical Analysis

The Relative Strength Index (RSI) indicator on the 4-hour chart stays slightly above 70, suggesting that GBP/USD is about to turn technically overbought. On the upside, 1.3830 (upper limit of the ascending channel) aligns as an important resistance level before 1.3900 (static level, round level).

Looking south, the first support could be spotted at 1.3730 (20-period Simple Moving Average) ahead of 1.3700 (static level, round level) and 1.3670 (mid-point of the ascending channel).

Pound Sterling FAQs

The Pound Sterling (GBP) is the oldest currency in the world (886 AD) and the official currency of the United Kingdom. It is the fourth most traded unit for foreign exchange (FX) in the world, accounting for 12% of all transactions, averaging $630 billion a day, according to 2022 data.
Its key trading pairs are GBP/USD, also known as ‘Cable’, which accounts for 11% of FX, GBP/JPY, or the ‘Dragon’ as it is known by traders (3%), and EUR/GBP (2%). The Pound Sterling is issued by the Bank of England (BoE).

The single most important factor influencing the value of the Pound Sterling is monetary policy decided by the Bank of England. The BoE bases its decisions on whether it has achieved its primary goal of “price stability” – a steady inflation rate of around 2%. Its primary tool for achieving this is the adjustment of interest rates.
When inflation is too high, the BoE will try to rein it in by raising interest rates, making it more expensive for people and businesses to access credit. This is generally positive for GBP, as higher interest rates make the UK a more attractive place for global investors to park their money.
When inflation falls too low it is a sign economic growth is slowing. In this scenario, the BoE will consider lowering interest rates to cheapen credit so businesses will borrow more to invest in growth-generating projects.

Data releases gauge the health of the economy and can impact the value of the Pound Sterling. Indicators such as GDP, Manufacturing and Services PMIs, and employment can all influence the direction of the GBP.
A strong economy is good for Sterling. Not only does it attract more foreign investment but it may encourage the BoE to put up interest rates, which will directly strengthen GBP. Otherwise, if economic data is weak, the Pound Sterling is likely to fall.

Another significant data release for the Pound Sterling is the Trade Balance. This indicator measures the difference between what a country earns from its exports and what it spends on imports over a given period.
If a country produces highly sought-after exports, its currency will benefit purely from the extra demand created from foreign buyers seeking to purchase these goods. Therefore, a positive net Trade Balance strengthens a currency and vice versa for a negative balance.

Source link

1 07, 2025

How Much Caffeine Is In An Average Cup Of Matcha

By |2025-07-01T17:42:25+03:00July 1, 2025|Dietary Supplements News, News|0 Comments


Matcha is now a ubiquitous drink in the United States, so popular, in fact, that Japanese production is struggling to keep up. Beyond the beverage, matcha is going through a bit of a culinary craze: matcha popcorn, anyone? But it’s those lovely, vibrant, TikTok-friendly lattes that keep people buzzing. In addition to the high levels of antioxidants, flavonoids, and minerals, matcha is also packed full of caffeine.

You’re looking at anywhere from 38 to 176 milligrams of caffeine in a typical serving of matcha. For comparison, black coffee clocks in around 100 milligrams, and normal green tea has about 20 to 90 milligrams — this is all per 8-ounce cup. Whether you’re making matcha in the traditional Japanese style (whisked with hot water until smooth and frothy) and sipping it straight or pouring that green elixir over milk, it’s still going to pack a caffeine punch. 

Some people argue that matcha’s caffeine is released more slowly in your body, lessening the negative impacts of caffeine when compared to coffee. While the level of caffeine in matcha will vary based on variety, amount of powder used, and brewing method, don’t expect matcha to be your panacea — especially if you’re sensitive to caffeine. Make sure to measure how many grams of matcha you need so your lattes taste great and you get the amount of buzz you’re expecting. 

What to do if the caffeine jitters take hold

Setting aside the delicious, vegetal, umami taste, matcha is still fairly high in caffeine. You can still experience the negative side effects associated with other caffeinated drinks, such as jitteriness, shakiness, irritability, anxiety, heart palpitations, sleep difficulties, and headaches. Consuming too much caffeine is often extremely uncomfortable, and while it is exceptionally rare, it can be fatal. Though we’d like to emphasize dangerous levels of caffeine are hard to attain, as even the Food and Drug Administration says that up to about 400 milligrams a day is perfectly safe. 

The best thing to do when you’re overcaffeinated is to cut off your caffeine intake and wait. Yes, much like being drunk, the best thing to do is wait it out — though if you experience intense symptoms, it’s always best to seek medical attention. If you feel like you’re bursting with energy, it’s sometimes best to just get it out — try going on a walk. Though caffeinated beverages themselves are not dehydrating, drinking some water can help you feel better. 

There’s even a myth — particularly prevalent in the world of baristas — that a banana will help you overcome the caffeine jitters. This is false, though by all means, eat a banana if you want. Matcha is a wonderful drink with a rich history that proves this grassy, bright green potion has staying power — even if it can make you a little jittery.


Source link

1 07, 2025

Bitcoin (BTC) Price Prediction for June 30 — TradingView News

By |2025-07-01T17:35:08+03:00July 1, 2025|Crypto News, News|0 Comments

The crypto market remains bullish, however, some cryptocurrencies are back to the red zone, according to CoinStats.CoinStats”>

BTCUSD

The price of Bitcoin BTCUSD has gone down by 0.76% since yesterday.TradingView”>

On the hourly chart, the rate of BTC has broken the support of $107,500. However, most of the daily ATR has been passed. In this case, there are low chances of seeing sharp moves by the end of the day. 

If bulls cannot seize the initiative, the correction is likely to continue to the $107,000 mark tomorrow.TradingView”>

On the longer time frame, the price of the main crypto has bounced off the resistance of $108,833. If today’s bar closes below $107,200, the accumulated energy might be enough for a test of the $106,000 area soon.TradingView”>

From the midterm point of view, traders should pay attention to the previous bar’s peak. If the weekly candle closes above the $109,000 mark, there is a chance to see a test of the $112,000 resistance.

Bitcoin is trading at $107,332 at press time.

Source link

1 07, 2025

XAU/USD challenges key 50-day SMA resistance ahead of Powell speech

By |2025-07-01T15:45:21+03:00July 1, 2025|Forex News, News|0 Comments


  • Gold price holds recovery from monthly lows near $3,250 early Tuesday.
  • US Dollar attempts a tepid bounce as markets look to reposition ahead of Powell’s Sintra appearance.
  • Gold price tests key 50-day SMA barrier at $3,320 on the road to recovery, daily RSI stays bearish.

Gold price has paused its recovery from monthly lows early Tuesday, as the US Dollar (USD) finds fresh demand while the market mood turns cautious.

Gold price awaits Powell for fresh cues on Fed rate cuts

Traders seem to resort to position adjustments on their USD shorts, bracing for US Federal Reserve’s (Fed) Chairman Jerome Powell’s appearance for fresh cues on the timing of the next interest rate cut.

Fed Chair Powell participates in a policy panel alongside other key central banks’ chiefs at the European Central Bank (ECB) Forum on central banking in Sintra on Tuesday.

Markets continue to price in a 20% chance of the Fed trimming rates this month while predicting a 77% probability of a rate cut in September.

If Powell once again signals prospects of weaker-than-expected inflation, it would ramp up the Fed’s easing bets, triggering a fresh leg down in the US Dollar.

The dovish tone could help the non-yielding Gold price recover further ground.

However, if Powell surprises with some hawkish or prudent remarks, it could double down on the recent Gold price downtrend.

Besides, the focus will be also on the US JOLTS Job Openings data and US trade talks as the July 9 deadline approaches.

The Greenback faced a double-whammy on Monday and hit over three-year lows against its major currency rivals.

Increased concerns over US fiscal health ahead of the Senate’s efforts to pass President Donald Trump’s ‘big, beautiful’ spending bill weighed heavily on the US Dollar.

Meanwhile, investors remained wary over the potential US trade deals with Japan and the European Union (EU), especially after Treasury Secretary Scott Bessent warned that countries could be notified of sharply higher tariffs despite good-faith negotiations.

Furthermore, the record-rally on Wall Street indices also hit the sentiment around the Greenback, allowing Gold price to stage a decent comeback on Monday.

Gold price technical analysis: Daily chart

Gold price tests the 50-day Simple Moving Average (SMA) at $3,320, having found support near the $3,250 psychological level on Monday.

On the road to recovery, Gold price recaptured the 38.2% Fibonacci Retracement (Fibo) level of the April record rally at $3,297 on a daily closing basis.

However, the 14-day Relative Strength Index (RSI) holds below the 50 level, raising doubts about the prospects of a sustained recovery from monthly troughs.

If Gold price settles Tuesday above the 50-day SMA at $3,320, the turnaround could gather strength toward the 21-day SMA at $3,350.

Further north, the 23.6% Fibo level of the same ascent at $3,377 will be challenged again.

On the flip side, acceptance below $3,297, the 38.2% Fibo level will open the door toward the monthly lows of $3,248.

Economic Indicator

Fed’s Chair Powell speech

Jerome H. Powell took office as a member of the Board of Governors of the Federal Reserve System on May 25, 2012, to fill an unexpired term. On November 2, 2017, President Donald Trump nominated Powell to serve as the next Chairman of the Federal Reserve. Powell assumed office as Chair on February 5, 2018.


Read more.

Next release:
Tue Jul 01, 2025 13:30

Frequency:
Irregular

Consensus:

Previous:

Source:

Federal Reserve


Source link

1 07, 2025

USD/JPY Forecast Today 01/07: Stable Near ¥145 (Chart)

By |2025-07-01T15:44:18+03:00July 1, 2025|Forex News, News|0 Comments

  • The US dollar has been stable against the Japanese yen during the trading session on Monday, which in and of itself is not necessarily anything markable, except the fact that we have seen the US dollar struggle against so many other currencies.
  • Because of this, I suspect that there is a problem with the Japanese yen itself.
  • After all, the Japanese yen is parentally weak, as the Bank of Japan is normally very loose with its monetary policy.

The Bank of Japan has a significant issue at the moment, due to the fact that there have been a lack of buyers in the Japanese Government Bond markets. This is a major problem for central banks and will almost always lead to more central bank buying of bonds, or what you probably know as “quantitative easing.” That’s an extreme simplification of what’s going on, but it is a very realistic example. By contrast, we have the Federal Reserve possibly cutting rates by 25 basis points in September, but that would still leave a major interest rate differential between these 2 currencies and make the dollar attractive against the yen itself.

Technical Analysis

The technical analysis at the moment is somewhat flat, as we have been trading in a range for a couple of months. The ¥142 level on the bottom is an area of significant support, while the ¥148 level has been significant resistance. It seems as if the market is very comfortable near the ¥145 level, which is also attracting the 50 Day EMA. As the market has gone into a multi-month consolidation area, this tells me that we could possibly be trying to form some type of bottoming pattern. This could take months though, which would not be unusual for this currency pair.

If we were to break above the ¥148 level, that opens up a move above the 200 Day EMA as well and perhaps should send the USD/JPY pair to the ¥150 level. On the other hand, if we were to break down below the ¥142 level, then I suspect we revisit the ¥140 level relatively quickly.

Want to trade our USD/JPY forex analysis and predictions? Here’s a list of forex brokers in Japan to check out.

Christopher Lewis has been trading Forex and has over 20 years experience in financial markets. Chris has been a regular contributor to Daily Forex since the early days of the site. He writes about Forex for several online publications, including FX Empire, Investing.com, and his own site, aptly named The Trader Guy. Chris favours technical analysis methods to identify his trades and likes to trade equity indices and commodities as well as Forex. He favours a longer-term trading style, and his trades often last for days or weeks.

Source link

1 07, 2025

Blackcurrant extract increases fat burn by up to 200%

By |2025-07-01T15:41:24+03:00July 1, 2025|Dietary Supplements News, News|0 Comments


The supplement increased fat burn rates by up to 200% and enhanced reductions in blood pressure after exercise by up 11%, with the lead researcher suggesting its use as a safe nutritional intervention to rival expensive Type 2 Diabetes drugs.

In the first comparative study of its kind, the berry supplement accelerated fat burning in the group by an average 28%, with the highest male responder reaching 204%, and female responder reaching 216%. The greatest effect was seen in women carrying more body fat.

“The message is clear, we have proof of principle that New Zealand blackcurrant extract is powerful and reliable for increasing fat metabolism and reducing cardiovascular disease risk factors, such as blood pressure,” said lead researcher, Dr Matthew Cook, describing the study as a ‘watershed moment’ in blackcurrant research.

“We’ve shown here that women who carry more fat, have the highest magnitude of change to blackcurrant. The great news is that it works for everyone, and some people respond more highly.

“This a high-impact discovery from a large dataset that had excellent controls.”

The researchers from the University of Worcester concluded one week’s supplementation with the berry supplement led the group to burn, on average, an additional 3.6g of fat in one hour of exercise.

Across a month, if users were to exercise five times a week, this could equate to an average of approximately 72 grams of fat.

Cook said: “If you can increase fat burning during exercise, over a prolonged period of time, that could equate to greater fat loss.

“Applied to a population doing an exercise training program with high polyphenol intake with blackcurrant would have really important health implications.”

The supplement also led to large-to-moderate reductions in blood pressure, showcasing how the berry can amplify the heart-health benefits of exercise to a clinically-significant degree.

Cook suggested the discovery positions the high-anthocyanin berry extract as a compelling alternative to Ozempic when used with a controlled diet and exercise, but without the dangerous side effects or high cost.

“A high anthocyanin blackcurrant supplement is an affordable, fast-acting intervention that is easy to use, doesn’t require a prescription, is very safe and a valuable tool for weight management. Not only that, it improves insulin responses, cardiovascular health and lowers risk factors associated with Type 2 Diabetes and heart disease.”

Study methodology

Twenty-two self-reported physically active participants (11 women) volunteered for the study. To participate, participants had to be not using any dietary supplements, nonsmokers, not obese (BMI ≤ 30), and free from any metabolic health disorders.

The experimental design has previously been described (Shan & Cook, 2023). A double-blind, PLA-controlled, randomized crossover design was used, with four laboratory visits at the same time in the morning.

At visits one and two, body measurements, VO2max and blood pressure were measured. Participants underwent 60 minutes of moderate treadmill exercise during moderate-intensity exercise, during which their energy metabolism (fat and carbohydrate use) were measured. Blood pressure responses were measured at rest in the two hours following the treadmill test.

For six days prior to Visits three and four, participants consumed either NZBC (CurraNZ, Health Currancy Ltd.) or PLA (microcrystalline cellulose M102) from two 300-mg identical size, shape, and color capsules..

Two hours following their final dose, participants underwent the same tests as at visits one and two.

90% of the group displayed improvements, with an average group increase of 28%.

Women with the poorest rates of fat burning exhibited the highest response but fat burning effects were not influenced by an individuals’ fitness status.

Considering the greater effect in women with higher body fat, the researchers suggested the berry’s mechanisms of action may be increasing fat transporters into muscle, where fat is metabolized for energy. Women have a higher number of transporters and are more efficient at metabolizing fat than men.

These values are comparable to what a doctor would seek to achieve

Dr Matthew Cook, lead researcher

Speaking about the post-exercise blood pressure responses, Cook added: “We observed that blackcurrant further decreased resting blood pressure values by up to 11% in the two hours after exercise.

“Blood pressure is the pressure that our blood puts on our arteries. We need a certain amount to keep blood flowing, however, if it is too high it can cause health problems.

“Every 5mmHG reduction in systolic blood pressure is equivalent to lowering the risk of cardiovascular events by 10% in adults over 60, however in the present study we saw reductions of up to 12mmHG – or 11%, in young healthy males and females.

“These values are comparable to what a doctor would seek to achieve through prescribing blood pressure medications to their patients. This is really meaningful after just one week on blackcurrant – a fantastic finding.”

Cook noted it would be worth repeating the study and extending the testing window, because post-exercise hypotension can occur for 12-24 hours before returning to baseline.

“There is no question blackcurrant anthocyanins can deliver meaningful physiological health benefits and should be implemented as a daily dietary strategy for life – particularly for those at risk,” added Cook.

“It’s clear that as a population, we don’t exercise enough, or consume enough fruits and vegetables containing these high-value phytochemicals and nutrients. Consuming a nutritional supplement like blackcurrant extract shows that within a short space of time, high doses of anthocyanin can deliver measurable, repeatable benefits that can modify health outcomes.”

International Journal of Sport Nutrition and Exercise Metabolism, 2025, 35, 150-161; “Effects of New Zealand Black Currant Extract on Exercising Substrate Utilization and Postexercise Blood Pressure in Men and Women.” https://doi.org/10.1123/ijsnem.2024-0108; Authors: Cook, M.D., Shan,Y., and Willems, M.E.T.,


Source link

1 07, 2025

Analyst Says No Reason for Upcoming Dogecoin Rally to Peak Below $1, Targets $1.17

By |2025-07-01T15:33:22+03:00July 1, 2025|Crypto News, News|0 Comments

TradingView analyst says no reason for Dogecoin price rally to stop below the dollar valuation, citing bullish trend from historical price structure.

Dogecoin has experienced a short-term dip in sentiment, with its price action reflecting modest volatility in recent days. Beginning near $0.165 on June 25, the meme coin briefly climbed to just above $0.169 by June 30. However, the upward momentum failed to hold, and the price retreated to $0.162 today.

This movement occurs against a prediction for a higher target identified by TradingView analyst Master Ananda.

Support From 2022 Remains Intact

According to Master Ananda’s chart, Dogecoin continues to be supported by a price structure that started forming in June 2022. At the time, DOGE had fallen significantly from its May 2021 all-time high of about $0.74. Since then, a firm support level emerged, preventing further decline and acting as a launch point for a subsequent rally.

Analyst Says No Reason for Upcoming Dogecoin Rally to Peak Below , Targets .17
Dogecoin Price Prediction

Notably, from the June 2022 bear market low, the analyst reports that Dogecoin surged over 880%, reaching a peak near $0.47 in December 2024. This move aligned with the 0.618 Fibonacci extension level. The Fibonacci-based structure, as interpreted by Ananda, shows future price projections and potential market top formations.

Fibonacci Targets and Resistance Levels Highlighted

Building on this model, Master Ananda outlined the next target of $1.17 based on a Fibonacci level relating to the 2021 bull market and the 2022 bear market. From the current price of $0.1621, a move to $1.17 would reflect approximately 622% upside. When measured from the June 2022 bottom of $0.05, the growth potential to $1.17 reaches around 2240%, equivalent to over 23 times in value.

Despite this long-term projection, Ananda also noted that markets follow cycles, stating that corrections often follow bullish moves. With Dogecoin returning to what the analyst called “baseline levels,” resistance levels that were cleared in late 2024 will likely need to be tested again. These points include $0.59 and $0.74.

Relevant Price Levels If Market Conditions Weaken

If the broader market does not perform well, several lower resistance levels remain relevant, according to the analysis. The $0.35 level sits just below the last major high and could become significant under declining momentum. 

The analyst stated that the $0.70 level should be watched as it was breached in the December 2024 rally. He also identified $1.05 as a potential new all-time high. According to Ananda, there is no reason for the Dogecoin rally in this bull run to stop below $1.

Further Dogecoin Prediction Above $1

Elsewhere, analyst WIZZ shared a projection for Dogecoin to reach $1, citing analysis from top market watcher Chris. In a June 24 tweet, Chris noted that Dogecoin had bounced from a multi-year support trendline after a 13% correction, suggesting the end of the downtrend. 

He predicted a rally beginning in July, potentially pushing DOGE to $1 and even as high as $1.40, while advising holders to take profit at those targets.

DisClamier: This content is informational and should not be considered financial advice. The views expressed in this article may include the author’s personal opinions and do not reflect The Crypto Basic opinion. Readers are encouraged to do thorough research before making any investment decisions. The Crypto Basic is not responsible for any financial losses.

Source link

1 07, 2025

Natural gas price is facing strong resistance– Forecast today – 1-7-2025

By |2025-07-01T13:44:28+03:00July 1, 2025|Forex News, News|0 Comments


Natural gas price lost the positive momentum yesterday, affected by stochastic stability below 50 level, forcing it to form bearish waves to settle near the support base at $3.460 level, to form strong and important resistance to detect the main trend in the upcoming trading.


The stability of the current support will reinforce the chances for regaining the bullish bias, to expect its rally towards $3.600, then attempts to reach the extra initial target at $3.830, while the continuation of the negative pressures and its decline below the current support will confirm its move to the bearish track, which forces it to suffer several losses by targeting $3.320 and $3.140 level.


The expected trading range for today is between $3.450 and $3.600


Trend forecast: Bullish


Source link

Go to Top