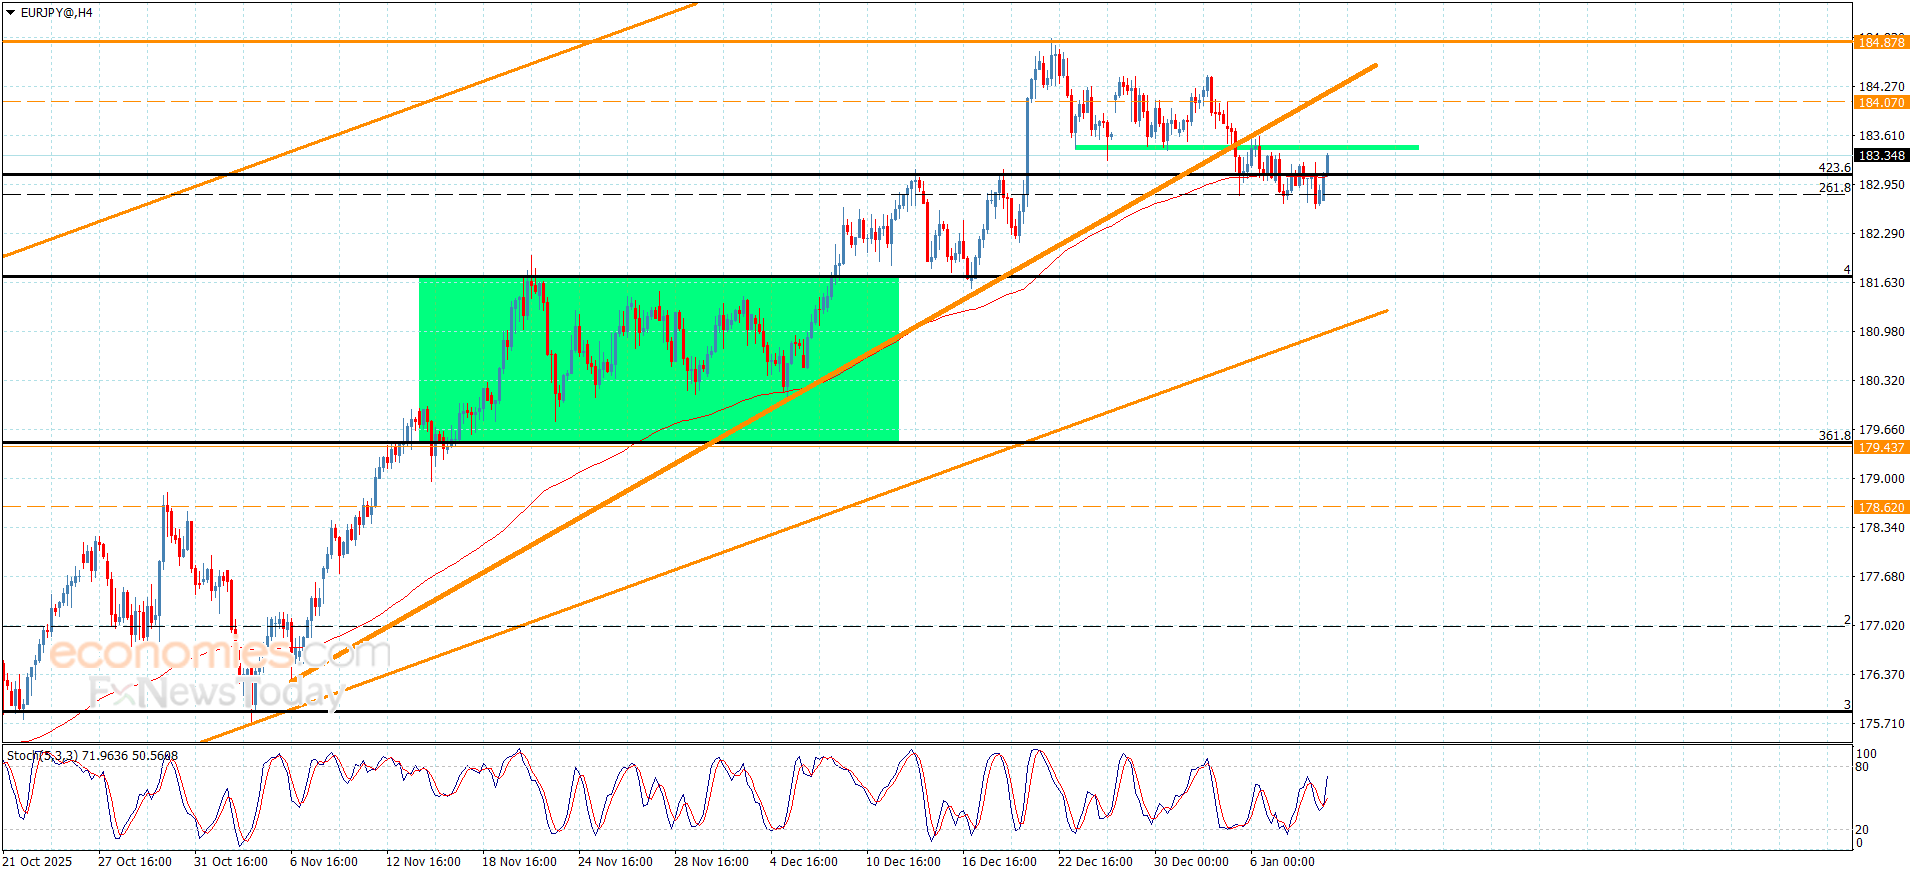
Platinum price kept its stability below $2320.00 level, to confirm the stability of the bearish corrective scenario by hitting the target at $2180.00, to form some mixed waves by its fluctuation near $2260.00.
Note that the continuation of providing negative momentum by stochastic will push the price to renew the corrective attempts, to expect reaching $2180.00. breaking this barrier will extend the trading towards $2130.00, representing the next target of the current trading, while breaching $2320.00 level will cancel the negative scenario, which allows it to form new bullish waves to press again on the historical high at $2460.00 level.
The expected trading range for today is between $2180.00 and $2305.00
Platinum price kept its stability below $2320.00 level, to confirm the stability of the bearish corrective scenario by hitting the target at $2180.00, to form some mixed waves by its fluctuation near $2260.00.
Note that the continuation of providing negative momentum by stochastic will push the price to renew the corrective attempts, to expect reaching $2180.00. breaking this barrier will extend the trading towards $2130.00, representing the next target of the current trading, while breaching $2320.00 level will cancel the negative scenario, which allows it to form new bullish waves to press again on the historical high at $2460.00 level.
The expected trading range for today is between $2180.00 and $2305.00
The market is currently straddling the key short-term support zone at $77.05 to $78.70. We’ve been watching this area all week and believe it is controlling the near-term direction of the market.
A sustained move over the upper level at $78.70 will indicate the presence of buyers. If they can build on this move with strong volume, they should have an easy time taking out the two tops standing in the way of another record high.
Key Downside Levels to Watch
If the lower or 50% level at $77.05 fails, then prices could retreat all the way back to the uptrend line that has been leading the market higher since the main bottom at $48.64 on November 21. The trendline comes in at $74.83 today. It was successfully tested earlier in the week at $73.84.
This technical indicator is important to the intermediate trend. If it is taken out with conviction then prices could retreat all the way back to a pivot at $72.41 and eventually the main bottom at $70.07.
Weak Jobs Data Ignites 6% Intraday Rally
XAGUSD jumped on Friday as investors reacted to weaker-than-expected U.S. jobs growth, tightening global supply, and rising geopolitical uncertainty. Today’s more than 6% gain at the top represented another large single-day gain that has been the norm lately and followed a volatile trading week that saw silver swing from a near-record high to nearly a one-week low.
Fed Rate Cut Expectations Fuel Safe-Haven Demand
The market was trading nearly flat earlier today ahead of a U.S. jobs report and a widely expected ruling from the U.S. Supreme Court. A rebound began after fresh U.S. labor market data showed the economy added only 50,000 nonfarm jobs in December, far below recent monthly averages. The softer hiring numbers strengthened market expectations that the Federal Reserve may accelerate interest-rate cuts in 2026, a move that is likely to weaken the dollar and consequently strengthen demand for dollar-denominated silver.
Friday’s advance followed a minor pullback to test support near the 10-day average, after it was reclaimed on the first day of the year. That low developed into a minor higher swing low as of today. This is bullish behavior that shows the integrity of the trend and the potential to break out above the $4,500 record high if support levels are held. It would help to see some improvement in momentum now that support at the 10-day average was tested and a new high for the upswing hit.
Rising Channel and Fibonacci Support Confirm Strength
Strength of the bull trend was indicated recently with the higher swing low at $4,274, a bounce from the 20-day average, and a confirmation of support at the top of a rising channel that followed an upside breakout. A failed breakout of the channel triggered in October, leading to the recent pullback to $3,886. It is interesting to note that both the October decline and the late-December drop found support near the 38.2% Fibonacci retracement of prior upswings. In Fibonacci analysis, that is minimum anticipated pullback, and a sharp recovery is a sign of strong demand. The consistency indicates the underlying strength remains as gold heads toward a new record high.
Higher Resistance Zones Come Into Focus
Although it would be nice to see some momentum, it will be needed for a sustained rally above the current high. That advance would put the next higher resistance zone in sight, starting from $4,664 and up to $4,766. Both of those price levels are derived from long-term measurements, including a starting point in 2011.
Downside Levels to Monitor
On the downside, Thursday’s low of 4,408 and the 20-day average at $4,392 present potential short-term support levels. If gold stays above the 20-day line, it continues to point towards a new trend high. That is the key dynamic support indicator for the near-term uptrend.
For a look at all of today’s economic events, check out our economic calendar.
The GBP/USD weekly forecast edges lower as the US dollar gains on upbeat economic data.
US services PMI and employment data revealed sufficient resilience to lift the dollar.
The coming week’s US CPI, PPI, and UK GDP are the events to watch.
GBP/USD fell last week as a string of better-than-expected US economic data indicated the dollar was strong and pushed back expectations for Federal Reserve rate cuts in the near future. The pair fell after failing to maintain its early-week gains. US services and labor data, not any UK developments, drove the move.
–Are you interested in learning more about forex tools? Check our detailed guide-
The first pressure arose when the US ISM Services PMI came in higher than expected, indicating that the services sector is still growing despite high interest rates. The new orders and prices paid for parts stayed the same, which supports the idea that inflation risks in the service economy are still high. This helped the dollar and pushed US Treasury yields higher, which in turn pushed the GBP/USD down.
The ADP Employment Report, released mid-week, showed that hiring in the private sector remained stronger than expected. The data made markets less likely to expect aggressive easing and more likely to want the dollar ahead of Friday’s jobs report, even though it isn’t always a good predictor of official payrolls.
Following Friday’s Nonfarm Payrolls report, which showed that job growth remained strong and unemployment was lower than expected, the GBP/USD pair fell even faster. Wage growth also remained strong, which alleviated concerns about a rapid decline in the job market. The data made it less likely that the Fed would cut rates early, which helped the dollar end the week strong and put sterling on the defensive.
The market’s direction next week will hinge on whether the new data on inflation and activity reinforce the notion of a robust US economy or pave the way for earlier policy easing.
GBP/USD Major Events Next Week:
The US CPI inflation report will show whether price pressures are easing or staying the same
US PPI data, which shows how inflation is changing upstream
US retail sales, to gauge consumer demand
Weekly unemployment claims for unemployment benefits in the US provide insight into the job market in the near future.
UK GDP numbers, which could change expectations about the Bank of England’s policy outlook
If US inflation or consumer data worsens, the dollar will likely remain strong, and the GBP/USD will remain under pressure. On the other hand, lower prices or spending, along with weak UK GDP risks, could alter the market’s direction and allow sterling to stabilize or bounce back.
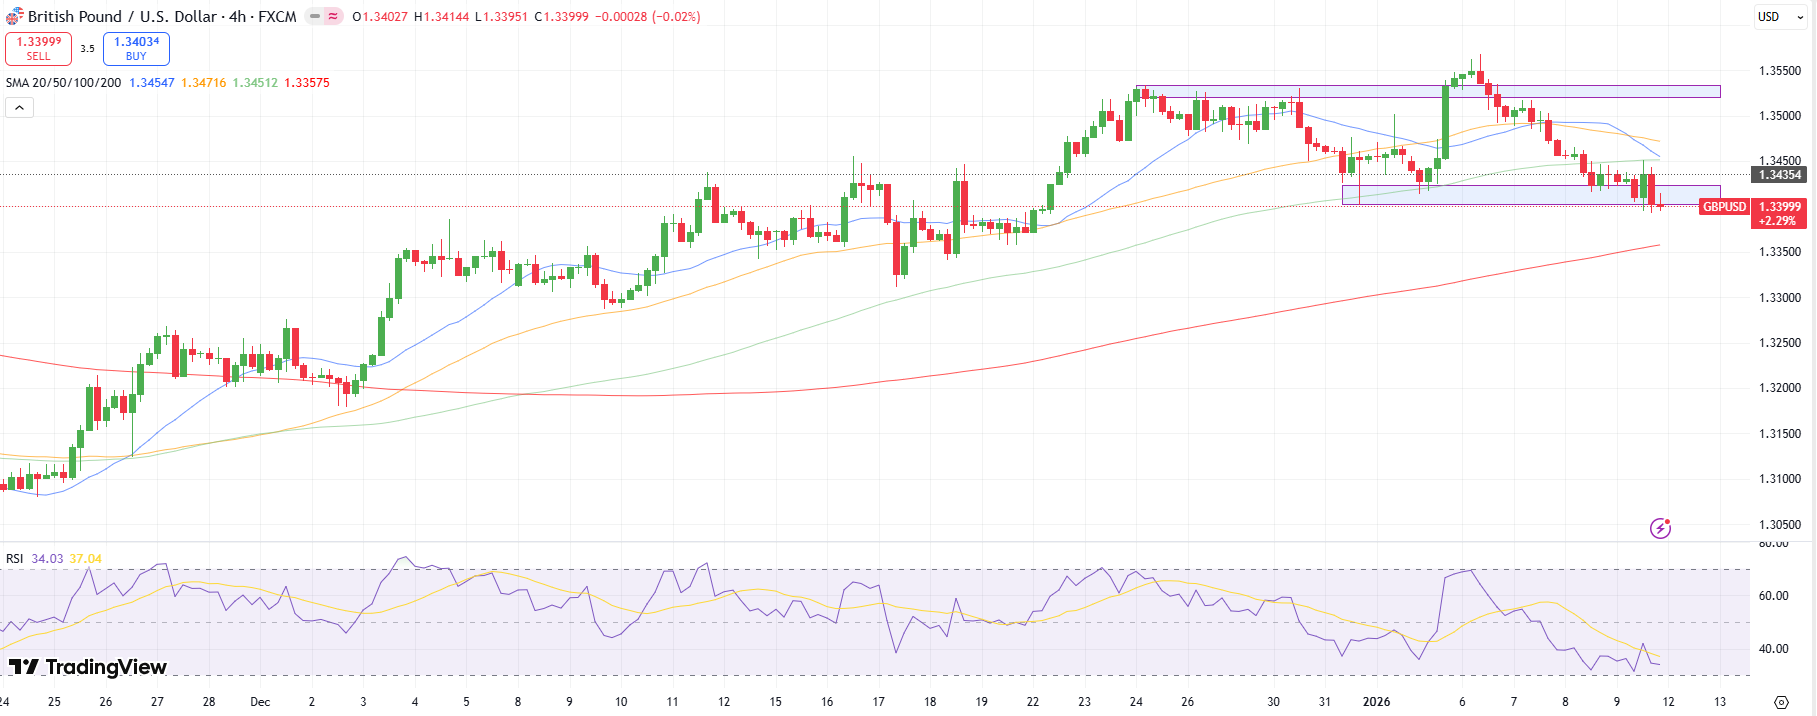
GBP/USD Weekly Technical Forecast: Critical Demand Zone at 1.3400
GBP/USD daily chart
The daily chart for GBP/USD suggests a strong bearish momentum after falling below the 100-day MA with a bearish crossover of 20- and 50-day MAs. However, the price holds near the demand zone at 1.3400, while a breakout could push the price further lower towards the 200-day MA at 1.3350.
–Are you interested in learning more about the best crypto exchange? Check our detailed guide-
Alternatively, finding adequate buying around 1.3400 could push the price higher to test the confluence of 20- and 100-day MAs around 1.3450 ahead of 1.3500.
Looking to trade forex now? Invest at eToro!
68% of retail investor accounts lose money when trading CFDs with this provider. You should consider whether you can afford to take the high risk of losing your money.
Internal Trendline Failure Opens Lower Support Zone
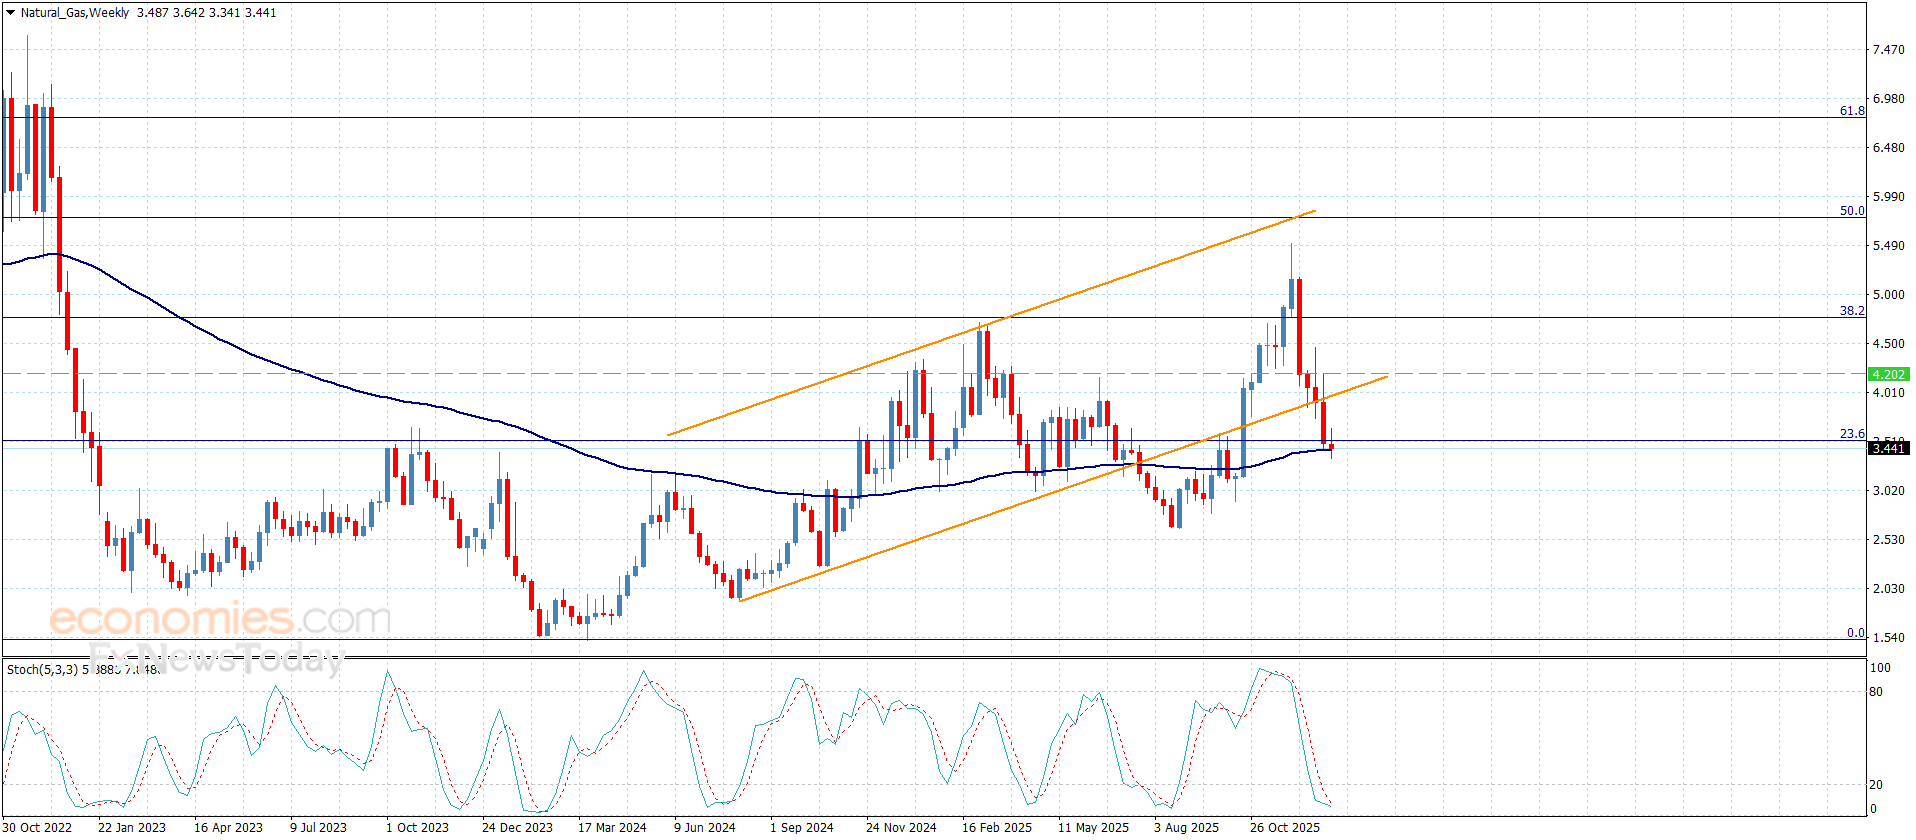
An internal uptrend line, that has been an area of support for the correction, broke today with a drop below the prior corrective low of $3.32. If support fails to stop the descent near the long-term trendline, lower targets become possible. There is another support zone lower from $2.95 to $2.86. It begins with an 88.6% Fibonacci retracement and ends at an interim swing low from April. That April low was followed by a sharp rally. Within the range, there is also a prior interim swing low at $2.89, and a quarterly low, that aligns with a 100% projected target for a falling ABCD pattern, for a combined four levels establishing the price zone.
Quarterly Structure Still Suggests Major Support
Given the long-term nature of the quarterly pattern, support would be expected above $2.89 at a maximum. A quarterly bullish reversal triggered in Q4 2025, establishing a high quarterly high and higher low. Plus, the breakout was confirmed with a 2025 closing above the Q3 high.
200-Day Average Confirms Resistance
This week confirmed the breakdown from the 200-day average on January 5, as it was successfully tested as resistance before Friday’s decline, on both Thursday and Wednesday. It suggests that buyers are staying on the sidelines until perceived value improves. At a minimum, this improves the chance that the rising trendline is eventually tested as support before the correction completes.
Post–Falling Wedge Pullback in Progress
Another perspective is applied when considering the breakout of a large bullish falling wedge in October. The current decline is the first pullback following that breakout. Once a bottom is found another sharp advance could follow given the volatility spike on both the rally and decline after the breakout.
If you’d like to know more about what drives natural gas prices, please visit our educational area.
The carry trade is still a very strong driver at the moment in a lot of the Japanese yen-related pairs, including the USD/JPY market.
The US dollar drifted a bit lower against the Japanese yen to kick off the Thursday session, but we have seen a turnaround show us signs of upward momentum.
The carry trade is still a very strong driver at the moment in a lot of the Japanese yen-related pairs, so despite the fact that the Bank of Japan has recently raised interest rates, the reality is that they are light years away from trying to tighten monetary policy enough to really turn things around.
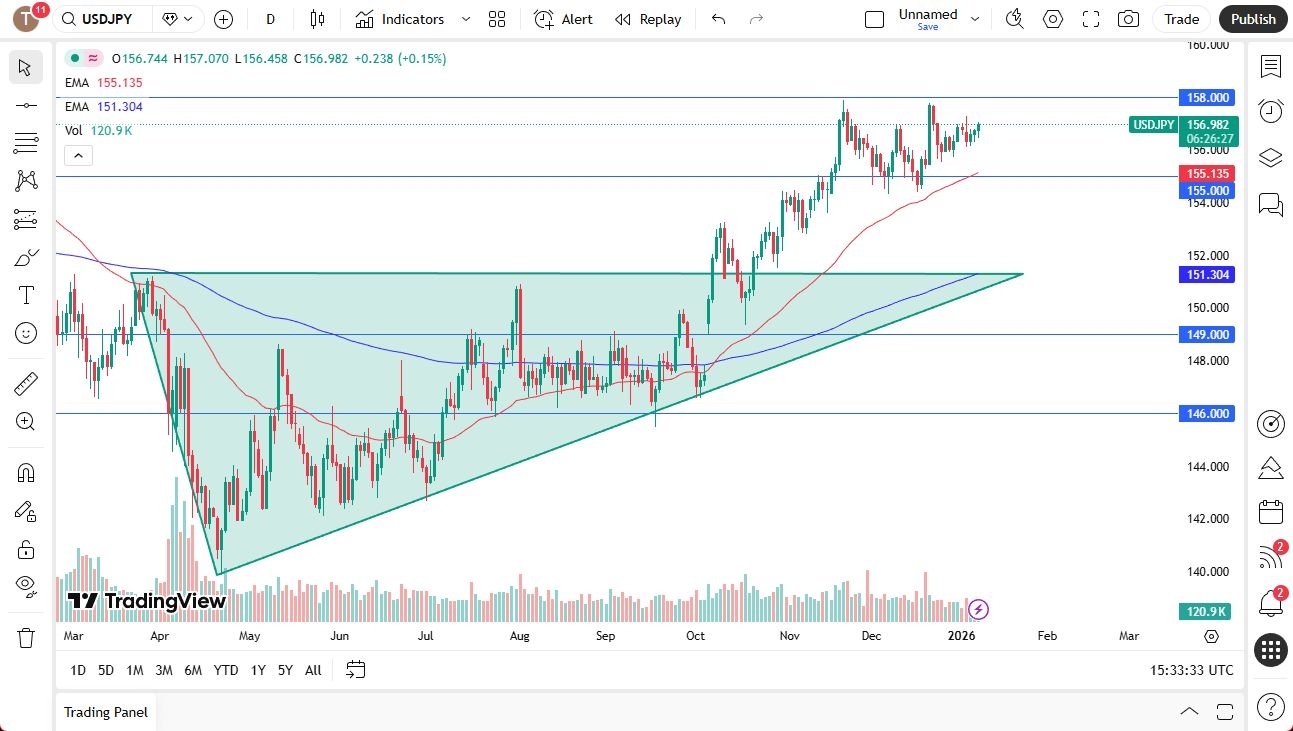
With this being said, the market will, of course, remain a little bit noisy, but if we can break to the upside and finally clear the 158 yen level, we could really take off. At that point, I think we could go looking to the 160 yen level, which is an area where the Bank of Japan intervened ages ago.
Technical Support and Future Targets
Short-term pullbacks will end up being buying opportunities, I believe, and as a result, the support levels that I’m watching include the 50-day EMA and the 155 yen level. These are areas that I think will remain very important, but I think it is difficult to break down below.
If we were to break down below that area, then you could have a lot of problems for the US dollar, and I think you have a situation where if that does in fact happen, the 152 yen level might be your next target.
Ultimately, though, despite the fact that the Bank of Japan has raised interest rates and the Federal Reserve has cut, you still have a pretty wide gap between the two, and therefore, if you’re looking for the carry trade to play out, you are looking for the US dollar to remain somewhat resilient against the Japanese yen. Beyond that, the US dollar itself is fairly resilient, mainly due to the fact that the economic numbers coming out of America are stubbornly strong, so even if the Federal Reserve does cut it can only do so in a limited way.
Christopher Lewis has been trading Forex and has over 20 years experience in financial markets. Chris has been a regular contributor to Daily Forex since the early days of the site. He writes about Forex for several online publications, including FX Empire, Investing.com, and his own site, aptly named The Trader Guy. Chris favours technical analysis methods to identify his trades and likes to trade equity indices and commodities as well as Forex. He favours a longer-term trading style, and his trades often last for days or weeks.
Veracity has launched Metabolic Power Protein, a doctor-developed, plant-based protein formulated to support lean muscle development and long-term metabolic health.
Designed for consumers seeking sustained energy, appetite control and metabolic resilience, the product aims to address growing concerns around protein quality, efficacy and safety within the wellness market.
Metabolic Power Protein is enhanced with MyoVera, a patented, clinically studied ingredient from Nutrition21 that has been shown to significantly increase muscle protein synthesis, improving how efficiently the body utilises protein.
“We are excited to partner with Veracity on the first product launch featuring the MyoVera brand,” said Jordan Miller, VP of Marketing at Nutrition21.
“MyoVera helps users get more from their protein intake, delivering clinically backed benefits regardless of lifestyle or fitness goals.”
According to Veracity, the formulation is designed to support the development of lean, metabolically active muscle — a key driver of energy expenditure and metabolic health.
“By helping the body build active muscle more effectively, we’re strengthening the foundation of metabolism itself,” said Dr Gabrielle Francis, Veracity’s Chief Medical Officer.
Beyond performance, Veracity is positioning the product around safety and transparency.
The company highlights ongoing industry concerns around heavy metal contamination in protein powders, citing independent testing that has identified elevated levels of lead, arsenic and cadmium in many popular products.
Metabolic Power Protein undergoes third-party testing and is formulated to meet California Proposition 65 limits for heavy metals and other contaminants.
The launch builds on Veracity’s broader metabolic health platform, which includes Metabolism Ignite, a clinically studied supplement for healthy weight management.
According to the company, Metabolic Power Protein is intended to act as a foundational nutritional component within a wider, science-backed metabolic system.
As protein continues to play a central role in conversations around weight management, strength and longevity, Veracity says the new product reflects a shift towards cleaner formulations that support metabolic health without compromising safety or quality.
POL breakout above key EMAs signals trend reversal, though overextension hints at a pause
Derivatives and spot flows show cautious re-entry, limiting liquidation risk and upside
Open Money Stack strengthens Polygon payment rails, adding fundamental support to recovery
Polygon’s POL token is drawing renewed attention as price strength, derivatives activity, and infrastructure development converge. Recent chart action shows a decisive recovery phase after weeks of consolidation.
Besides technical momentum, improving spot flows and new ecosystem tools add context to the market’s near-term outlook. Consequently, traders are reassessing risk as POL tests higher levels near the $0.15 zone.
Price Structure Signals a Bullish Shift
POL price action on the four-hour chart reflects a clear upward trend. The market advanced sharply from the $0.118 area toward $0.149. This move followed a prolonged sideways phase, which often precedes stronger directional breaks. Significantly, price now trades above key exponential moving averages across short and long periods.
The EMA alignment shows sustained bullish control. The 20-period average continues to act as dynamic support near $0.131. Hence, dips toward this zone may attract buyers if momentum cools. Fibonacci retracement levels also reinforce this structure. The $0.129 and $0.138 zones remain important buffers during any pullback.
However, the Donchian Channel places price above its upper boundary. That condition often signals near-term exhaustion. Consequently, consolidation or a shallow retracement could emerge before another push higher. Resistance remains concentrated near $0.149, which marks the recent swing high.
Derivatives and Spot Flows Show Cautious Re-Engagement
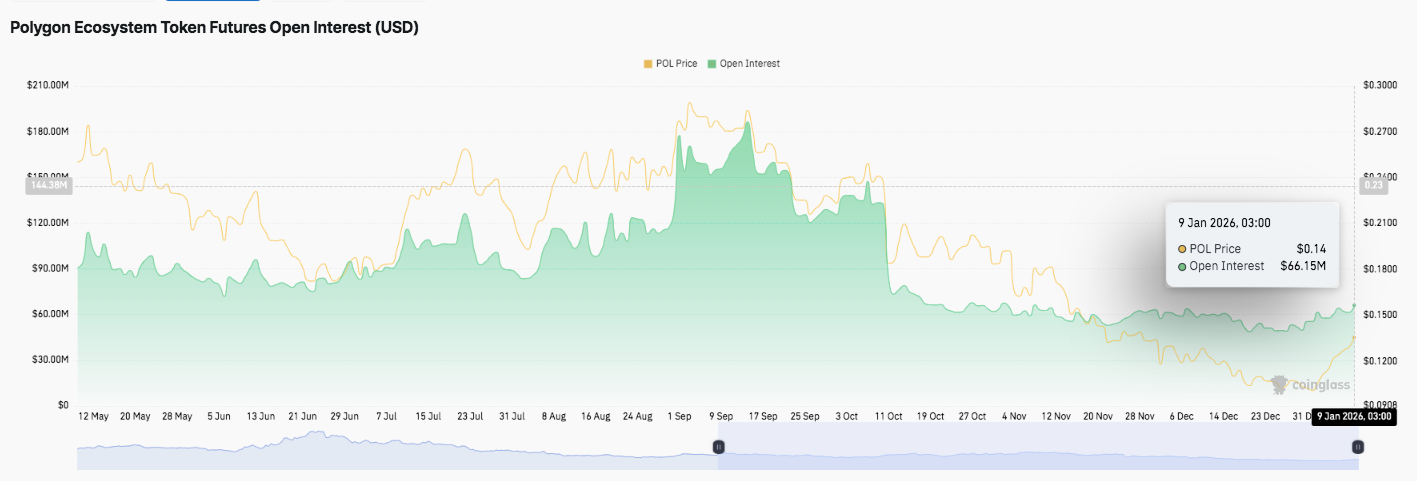
Futures open interest adds another layer to the narrative. Open interest expanded steadily from mid-summer and peaked near $180 million in early autumn. That phase aligned with stronger speculative appetite. However, October saw rapid deleveraging, which pushed open interest sharply lower.
Since then, derivatives activity stabilized between $55 million and $70 million. Moreover, the recent uptick toward $66 million suggests traders are returning cautiously. Leverage remains restrained compared with previous highs. This structure reduces liquidation risk but also limits explosive upside.
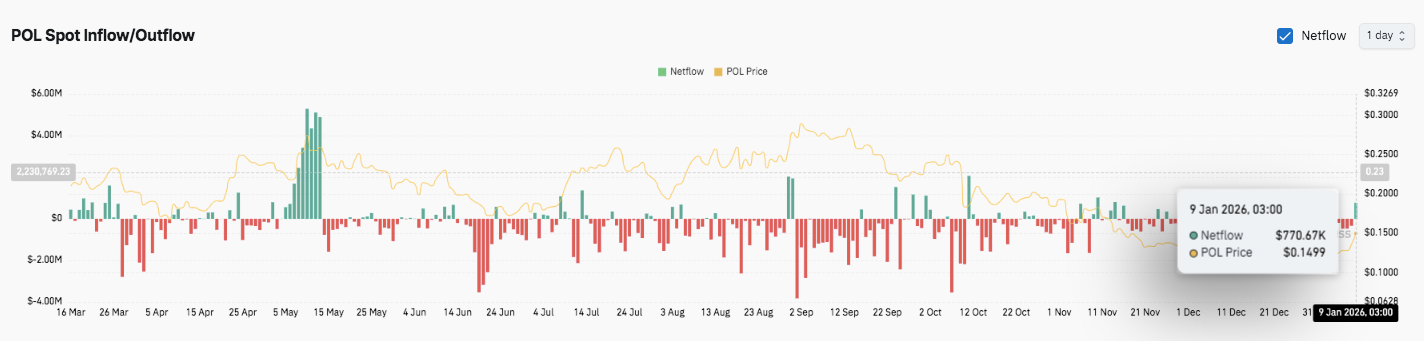
Spot flow data supports this measured shift. Earlier periods showed persistent outflows and sharp sell-side spikes. Additionally, those flows coincided with price weakness. Into late November and December, outflows moderated and netflows moved closer to balance. The latest modest inflow near $770,000 aligns with price stability near $0.15.
Infrastructure Developments Add Fundamental Context
Beyond charts, ecosystem progress continues. Polygon Labs recently introduced the Open Money Stack. The initiative focuses on regulated stablecoin payments and cross-border transfers. It combines compliance, wallets, orchestration, and settlement into a unified framework.
The next three years will define how money moves over the next thirty years.
The Polygon Open Money Stack will change everything. • one vertically integrated stack to move all money onchain • seamless global money movement enabled for anyone, anywhere. • open, interoperable,… https://t.co/O8oCZKSWVh
Moreover, the stack aims to connect onchain and offchain systems without sacrificing interoperability. Developers can onboard users and integrate payment and yield features more efficiently. Several components already operate through partners, with further releases planned.
Technical Outlook for Polygon (POL) Price
Polygon’s POL token continues to trade at a technically sensitive zone, where momentum remains constructive but not yet decisive. Price action on the short-term timeframe shows POL attempting to hold above recent breakout levels near $0.145–$0.149. Consequently, traders are closely monitoring whether buyers can sustain control or if consolidation deepens before the next directional move.
Upside Levels: Immediate resistance sits near $0.149–$0.150, which marks the recent swing high. A clean breakout above this zone could open the door toward $0.158 and $0.165 in the near term. Beyond that, an extension toward $0.180 remains possible if volume expands and momentum accelerates.
Downside Levels: On the downside, initial support rests near $0.138, aligned with the 0.786 Fibonacci retracement. A deeper pullback could test $0.129–$0.130, where buyers previously stepped in. Below that, $0.123–$0.118 forms the broader demand zone that underpins the current structure.
Resistance Ceiling: The $0.150 region, near recent highs and short-term volatility bands, remains the key level to flip for sustained bullish continuation. Holding above this ceiling would strengthen the medium-term trend and reduce the risk of range expansion lower.
From a structural standpoint, POL appears to be compressing after a sharp impulse move. EMAs remain positively stacked, supporting the broader uptrend. However, price trading near the upper Donchian boundary signals short-term exhaustion risk. Hence, consolidation or a shallow retracement would remain healthy for trend continuation.
Will Polygon Move Higher?
Polygon’s short-term outlook depends on whether buyers can defend the $0.138–$0.145 area while pressuring the $0.150 resistance. Technical compression suggests volatility expansion may follow.
If bullish momentum builds alongside improving spot flows, POL could target $0.158 and $0.165 next. However, failure to hold $0.138 risks a reset toward $0.129 or lower. For now, POL trades in a pivotal zone where confirmation will shape the next leg.
Disclaimer: The information presented in this article is for informational and educational purposes only. The article does not constitute financial advice or advice of any kind. Coin Edition is not responsible for any losses incurred as a result of the utilization of content, products, or services mentioned. Readers are advised to exercise caution before taking any action related to the company.