EPA and DHA Omega-3 Ingredient Industry Analysis in the UK 2025 to 2035
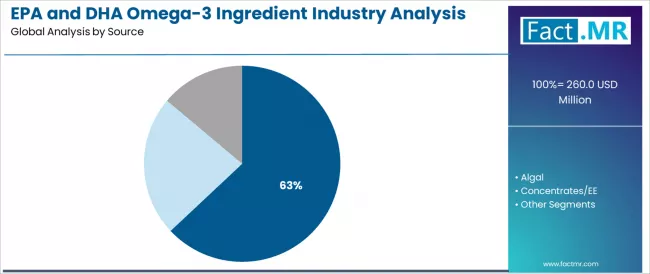
The demand for EPA and DHA omega-3 ingredients in the UK is projected to grow from USD 260.0 million in 2025 to approximately USD 408.0 million by 2035, the market will rise at a CAGR of 4.6% which recording an absolute increase of USD 148.0 million over the forecast period. The Marine Oils segment is projected to account for 63.0% of UK EPA and DHA omega-3 ingredient demand in 2025.
Marine oil sources are fundamental to the UK industry for several overlapping reasons, including their superior EPA and DHA concentration characteristics, established supply chain infrastructure, and proven effectiveness in delivering cardiovascular and cognitive health benefits while maintaining regulatory acceptance and consumer recognition.
Quick Stats for UK EPA and DHA Omega-3 Ingredient Industry
- UK EPA and DHA Omega-3 Ingredient Sales Value (2025): USD 260 million
- UK EPA and DHA Omega-3 Ingredient Forecast Value (2035): USD 408 million
- UK EPA and DHA Omega-3 Ingredient Forecast CAGR: 4.6%
- Leading Source in UK EPA and DHA Omega-3 Ingredient Industry: Marine Oils (63.0%)
- Key Growth Regions in UK EPA and DHA Omega-3 Ingredient Industry: England, Scotland, Wales, and Northern Ireland
- Regional Leadership: England holds the leading position in demand
- Key Players in UK EPA and DHA Omega-3 Ingredient Industry: DSM Firmenich Group, BASF SE, Croda International Plc, Epax AS, GC Rieber AS
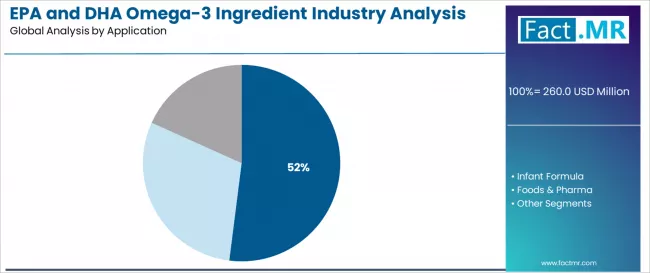
The dietary supplements application segment is expected to represent 52.0% of UK EPA and DHA omega-3 ingredient demand in 2025. Health-conscious consumers are fundamental to the omega-3 ingredient industry because they provide the advanced nutritional requirements, comprehensive wellness opportunities, and standardized efficacy characteristics required for preventive healthcare success and functional nutrition integration.
Between 2025 and 2030, demand for EPA and DHA omega-3 ingredients in the UK is projected to expand from USD 260.0 million to USD 324.5 million, resulting in a value increase of USD 64.5 million, which represents 43.6% of the total forecast growth for the decade. This phase of growth will be shaped by rising health consciousness among aging populations, increasing scientific validation of omega-3 benefits, and growing demand for advanced nutritional ingredients across UK wellness sectors, particularly in regions where cardiovascular disease prevention and cognitive health awareness are accelerating omega-3 adoption. Increasing integration of omega-3 fortification in functional food formulations and growing adoption of preventive healthcare solutions continue to drive demand. Advanced supplement manufacturers and ingredient suppliers are expanding their production capabilities to address the growing complexity of modern health requirements and quality standards, with UK operations leading investments in bioavailability enhancement and purity assurance systems.
From 2030 to 2035, demand is forecast to grow from USD 324.5 million to USD 408.0 million, adding another USD 83.5 million, which constitutes 56.4% of the overall ten-year expansion. This period is expected to be characterized by expansion of algae-based omega-3 production and alternative sourcing methods, development of enhanced bioavailability formulations and targeted delivery systems, and implementation of comprehensive quality programs across different nutritional and pharmaceutical sectors. The growing adoption of personalized nutrition approaches and enhanced efficacy requirements, particularly in cardiovascular and cognitive health applications, will drive demand for more sophisticated omega-3 varieties and validated formulation solutions.
Between 2020 and 2025, EPA and DHA omega-3 ingredient demand in the UK experienced steady expansion, driven by increasing cardiovascular health awareness and growing recognition of omega-3 fatty acids as essential nutrients for enhancing brain function and providing comprehensive wellness solutions across diverse consumer applications. The sector developed as healthcare professionals and supplement manufacturers, especially in major urban centers, recognized the need for proven nutritional ingredients and effective health support systems to achieve wellness objectives while meeting consumer expectations and quality requirements. Omega-3 ingredient suppliers and formulation providers began emphasizing clinical research validation and quality assurance to maintain competitive advantages and commercial viability.
UK EPA and DHA Omega-3 Ingredient Industry Key Takeaways
| Metric |
Value |
| UK EPA and DHA Omega-3 Ingredient Sales Value (2025) |
USD 260 million |
| UK EPA and DHA Omega-3 Ingredient Forecast Value (2035) |
USD 408 million |
| UK EPA and DHA Omega-3 Ingredient Forecast CAGR (2025-2035) |
4.6% |
Why is the UK EPA and DHA Omega-3 Ingredient Demand Growing?
Demand expansion is being supported by the accelerating emphasis on cardiovascular health and preventive healthcare nationwide, with the UK maintaining its position as a leading wellness-focused consumer base, and the corresponding need for scientifically validated nutritional ingredients for heart health, brain function, and inflammatory response applications. Modern supplement manufacturers rely on EPA and DHA omega-3 ingredient technologies to ensure product efficacy, consumer acceptance, and optimal pathway achievement toward health optimization.
Healthcare professionals and supplement companies are increasingly investing in omega-3 ingredient sourcing and integrated formulation solutions to enhance product profiles, access clinical research trends, and demonstrate evidence leadership in competitive wellness environments. Quality standards and regulatory compliance requirements are establishing standardized efficacy pathways that require scientific validation systems and performance assurance, with UK operations often pioneering large-scale implementation of advanced omega-3 ingredient technologies.
Opportunity Pathways – Demand for EPA and DHA Omega-3 Ingredients in the UK
The EPA and DHA omega-3 ingredient demand in the UK is positioned for steady expansion, growing from USD 260.0 million in 2025 to USD 408.0 million by 2035, reflecting a 4.6% CAGR. Rising adoption of functional nutrition systems in supplement formulations, infant nutrition products, and fortified food applications is driving growth as manufacturers seek omega-3 solutions that maximize health benefit characteristics and comply with stringent purity standards. Additionally, demand from cardiovascular health applications and cognitive enhancement implementations strengthens opportunities for both sophisticated ingredient platforms and integrated delivery solutions.
Suppliers focusing on clinical validation, bioavailability enhancement, and advanced purity capabilities stand to gain from evolving health standards and consumer expectations for ingredient effectiveness, and therapeutic optimization.
- Pathway A – Marine Oil Sources and High-Concentration Applications: Supplement manufacturers face increasing demands for advanced marine-derived solutions in modern formulation development. Premium marine oil ingredients enable enhanced EPA and DHA concentrations and comprehensive health benefit capabilities without compromising bioavailability characteristics. Solutions targeting major pharmaceutical companies, supplement brands, and high-potency product segments can achieve strong adoption rates through purity optimization and efficacy improvements. Estimated revenue opportunity: USD 28.0-34.0 million.
- Pathway B – Bioavailability Enhancement and Advanced Delivery Systems: The growth in personalized nutrition initiatives, absorption optimization, and therapeutic effectiveness creates robust demand for high-performance ingredient forms ensuring precision in health outcome delivery. Suppliers offering enhanced bioavailability solutions for cardiovascular applications can build relationships with pharmaceutical companies and research partners. Estimated revenue opportunity: USD 22.0-28.0 million.
- Pathway C – Algal Sources and Plant-Based Alternative Applications: Health companies are increasingly adopting algae-derived ingredients for consistent quality and vegetarian-friendly formulations. Collaborations with biotechnology providers for integrated production solutions can unlock significant contracts and long-term partnerships in environmentally conscious and vegan nutrition applications. Estimated revenue opportunity: USD 18.0-24.0 million.
- Pathway D – Infant Nutrition Systems and Early Development Applications: Healthcare requirements and developmental health demands are driving preference for specialized platforms with superior DHA concentration capabilities. Suppliers offering comprehensive infant formula solutions with exceptional purity characteristics can differentiate offerings and attract major nutrition companies. Estimated revenue opportunity: USD 16.0-21.0 million.
- Pathway E – Concentrate Forms and Pharmaceutical-Grade Applications: Critical healthcare operations require specialized ingredient configurations with optimized potency features and enhanced therapeutic capabilities. Suppliers investing in concentrate development can secure advantages in serving pharmaceutical-grade health applications. Estimated revenue opportunity: USD 14.0-18.0 million.
- Pathway F – Technical Service and Formulation Support Networks: Comprehensive service networks offering clinical guidance, quality assurance, and ongoing formulation support create recurring revenue opportunities. Companies building strong technical support capabilities can capture ongoing relationships and enhance manufacturer satisfaction across pharmaceutical facilities and supplement networks. Estimated revenue opportunity: USD 11.0-15.0 million.
Segmental Analysis
The industry is segmented by source, application, and form. By source, sales are divided into marine oils, algal, and concentrates/EE categories. In terms of application, the industry is segmented into dietary supplements, infant formula, and foods & pharma. By form, the industry is segmented into concentrates and standard oils. Regionally, the industry is divided into England, Scotland, Wales, and Northern Ireland, with England representing a key growth and innovation hub for advanced nutritional ingredient technologies.
By Source, Marine Oils Segment Accounts for 63.0% Share

The Marine Oils segment is projected to account for 63.0% of UK EPA and DHA omega-3 ingredient demand in 2025, making it the leading source category across the sector. This dominance reflects the efficacy requirements and supply infrastructure needs of marine-derived systems for existing supplement formulations and nutritional applications where EPA and DHA concentration is optimized through superior extraction characteristics and reliable sourcing architecture.
In the UK, where substantial pharmaceutical infrastructure requires advanced ingredient integration without complete formulation redevelopment, marine oil platforms provide practical pathways for efficacy enhancement while maintaining product quality. Continuous innovations are improving concentration consistency, purity characteristics, and formulation integration parameters, enabling manufacturers to achieve high therapeutic standards while maximizing consumer acceptance.
The segment’s strong position is reinforced by the extensive existing supplement products requiring proven ingredient capabilities and growing availability of marine oil suppliers with established commercial experience.
- Formulation compatibility and existing product system integration make marine oil platforms the preferred source for enhancing cardiovascular health supplements and cognitive function applications.
- Clinical validation and ingredient sourcing track records are enhancing manufacturer confidence and product viability across large-scale adoption initiatives.
By Application, Dietary Supplements Segment Accounts for 52.0% Share
The Dietary Supplements segment is expected to represent 52.0% of UK EPA and DHA omega-3 ingredient demand in 2025, highlighting the critical importance of consumer health operations requiring comprehensive nutritional solutions. Wellness sector facilities including cardiovascular health supplements, cognitive enhancement products, and general wellness formulations generate consistent demand for EPA and DHA omega-3 ingredient systems that are clinically and commercially favorable for advanced health support applications.
The segment benefits from ingredient characteristics that often provide superior therapeutic outcomes compared to dietary alternatives, reducing health intervention complexity and improving consumer compliance. Dietary supplement applications also access enhanced efficacy optimization through formulation innovation that improves health outcomes and consumer appeal.
In the UK, where preventive healthcare operations represent substantial portions of wellness development, clinical excellence requires ingredient integration across diverse supplement formulations. In England and Scotland regions, where major pharmaceutical concentrations are significant, EPA and DHA omega-3 ingredient demand is elevated by emphasis on maintaining efficacy excellence while achieving consumer satisfaction targets.
- Health outcome optimization and favorable therapeutic economics make this a leading application segment for advanced nutritional technologies.
- Cardiovascular health requirements and cognitive enhancement demands drive consistent demand across heart health supplements, brain function products, and general wellness formulations.
What are the Drivers, Restraints, and Key Trends in the UK EPA and DHA Omega-3 Ingredient Demand?
UK EPA and DHA omega-3 ingredient demand is advancing steadily due to increasing cardiovascular health awareness and growing recognition of omega-3 fatty acids necessity for preventive healthcare, with England region serving as a key driver of innovation and application development. The sector faces challenges including competition from plant-based omega-3 alternatives, need for specialized purification infrastructure development, and ongoing concerns regarding raw material price volatility and marine sourcing considerations.
National health regulations and regional-level wellness initiatives, particularly preventive healthcare programs in England and Scotland regions, continue to influence EPA and DHA omega-3 ingredient selection and adoption timelines.
Expansion of Health Research Validation and Clinical Standards
The enhancement of cardiovascular health research, gaining particular significance through government preventive care mandates and wellness awareness campaigns, is enabling omega-3 ingredient suppliers to achieve differentiation without prohibitive development costs, providing predictable demand patterns through healthcare professional recommendations and consumer health preferences. Enhanced clinical standards offering substantial opportunities for scientifically validated ingredients and evidence-based applications provide foundational dynamics while allowing suppliers to secure pharmaceutical agreements and research partnerships.
These trends are particularly valuable for first-mover suppliers and premium ingredient development that require substantial quality investments without immediate cost advantages.
Deployment of Advanced Formulation Technologies and Efficient Production Systems
Modern EPA and DHA omega-3 ingredient suppliers and premium pharmaceutical operators are establishing advanced production networks and centralized manufacturing facilities that improve operational efficiency through bioavailability enhancement and economies of scale. Integration of purification systems, high-precision concentration technology, and coordinated quality management enables more efficient omega-3 ingredient production across multiple manufacturing facilities.
Advanced production concepts also support next-generation health applications including personalized nutrition integration, therapeutic optimization, and regional ingredient supply networks that optimize system-level economics while enabling comprehensive purity monitoring across production regions, with UK developments increasingly adopting collaborative manufacturing models to reduce individual supplier costs and accelerate deployment.
Analysis of UK EPA and DHA Omega-3 Ingredient Demand by Key Region
| Region |
CAGR (2025-2035) |
| England |
4.9% |
| Scotland |
4.5% |
| Wales |
4.2% |
| Northern Ireland |
3.9% |
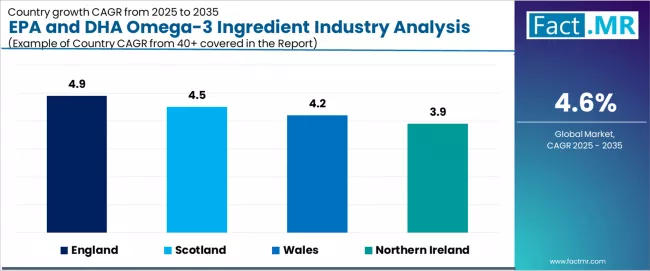
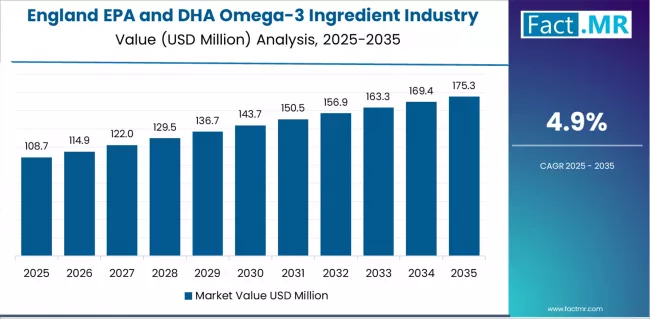
The UK EPA and DHA omega-3 ingredient demand is witnessing steady growth, supported by rising cardiovascular health awareness, expanding preventive healthcare initiatives, and the deployment of advanced nutritional ingredient technologies across regions. England leads the nation with a 4.9% CAGR, reflecting progressive health trends, substantial pharmaceutical innovation, and early adoption of premium supplement systems.
Scotland follows with a 4.5% CAGR, driven by extensive healthcare infrastructure, favorable wellness demographics, and concentration of research operations that enhance application development. Wales grows at 4.2%, as health optimization and preventive care opportunities increasingly drive EPA and DHA omega-3 ingredient deployment. Northern Ireland demonstrates growth at 3.9%, supported by expanding pharmaceutical facilities and regional healthcare initiatives.
England Leads National Growth with Innovation and Premium Health Applications
Demand for EPA and DHA omega-3 ingredients in England is projected to exhibit strong growth with a CAGR of 4.9% through 2035, driven by progressive health operational preferences, substantial pharmaceutical development creating premium ingredient opportunities, and concentration of advanced wellness advancement across London, Manchester, and Birmingham healthcare areas.
As the dominant region with extensive pharmaceutical infrastructure and innovation-focused health policies, England’s emphasis on comprehensive cardiovascular excellence and preventive care leadership is creating significant demand for advanced EPA and DHA omega-3 ingredient systems with proven efficacy and reliable therapeutic potential. Major supplement manufacturers and omega-3 ingredient suppliers are establishing comprehensive research development programs to support formulation advancement and premium health deployment across diverse applications.
- Health optimization trends and ingredient efficacy preferences are requiring comprehensive quality management strategies and clinical solutions, driving demand for EPA and DHA omega-3 ingredient systems with demonstrated health enhancement capabilities and permanent purity assurance throughout diverse supplement formulations.
- Research ecosystem strength and pharmaceutical capital availability are supporting deployment of next-generation ingredient technologies and novel formulation pathways that enhance therapeutic viability, reduce health intervention costs, and create new wellness opportunities across pharmaceutical and consumer health applications, positioning England as a national health leadership region.
Scotland Demonstrates Strong Potential with Pharmaceutical Infrastructure
Demand for EPA and DHA omega-3 ingredients in Scotland is expanding at a CAGR of 4.5%, supported by extensive healthcare facilities including cardiovascular health operations, advanced research institutions, and specialty pharmaceutical manufacturers generating concentrated demand favorable for omega-3 ingredient systems. The region’s health characteristics, featuring substantial pharmaceutical infrastructure and research requirements ideal for premium ingredient integration, provide operational advantages.
Healthcare expertise concentrated in Glasgow, Edinburgh, and regional research corridors facilitates application development and formulation management. EPA and DHA omega-3 ingredient suppliers and manufacturers are implementing comprehensive efficacy strategies to serve expanding precision-focused requirements throughout Scotland.
- Pharmaceutical concentration and favorable application economics are creating opportunities for specialized omega-3 ingredient suppliers that can integrate advanced formulation systems with existing health operations.
- Clinical research positioning and health awareness are building regional competitive advantages in pharmaceutical applications, enabling comprehensive efficacy development and supplier cluster enhancement that meets therapeutic targets while accessing premium pricing opportunities.
Wales Maintains Steady Growth with Health Sector Expansion
Demand for EPA and DHA omega-3 ingredients in Wales is growing at a CAGR of 4.2%, driven by substantial healthcare facilities from wellness operations, advanced pharmaceutical plants, and regional health consumption requiring advanced nutritional pathways.
The region’s healthcare base, supporting critical preventive care operations, is increasingly adopting advanced omega-3 ingredient technologies to maintain competitiveness while meeting health expectations. Manufacturers and EPA and DHA omega-3 ingredient suppliers are investing in formulation integration systems and regional supply infrastructure to address growing efficacy management requirements.
- Health optimization imperatives and therapeutic competitiveness concerns are facilitating adoption of omega-3 ingredient technologies that enable continued operations while achieving efficacy enhancement across cardiovascular health, advanced pharmaceutical plants, and wellness facilities.
- Preventive healthcare opportunities including regional ingredient development and therapeutic utilization for enhanced health operations are creating unique regional advantages and diversified application types throughout Wales healthcare operations.
Northern Ireland Shows Progressive Adoption with Healthcare Modernization
Demand for EPA and DHA omega-3 ingredients in Northern Ireland is advancing at a CAGR of 3.9%, supported by expanding healthcare facilities, regional pharmaceutical development including premium wellness consumption and health operations, and growing emphasis on efficacy solutions across the region.
Healthcare modernization and pharmaceutical facility expansion are driving consideration of EPA and DHA omega-3 ingredient systems as therapeutic enhancement pathways. Premium manufacturers and omega-3 ingredient suppliers are developing regional capabilities to support emerging efficacy deployment requirements.
- Healthcare expansion and pharmaceutical diversification are creating economic drivers for therapeutic technologies and omega-3 ingredient deployment across health and wellness facilities seeking competitive differentiation pathways.
- Regional healthcare cooperation and coordinated pharmaceutical development are establishing consistent efficacy environments and shared operational infrastructure that support multi-regional health projects throughout Northern Ireland healthcare operations.
Competitive Landscape of UK EPA and DHA Omega-3 Ingredient Demand
UK EPA and DHA omega-3 ingredient demand is defined by competition among specialized marine ingredient manufacturers, biotechnology companies, and integrated nutritional solution providers, with major pharmaceutical corporations maintaining significant influence through research resources and application development capabilities. Companies are investing in omega-3 ingredient advancement, manufacturing infrastructure optimization, quality network structures, and comprehensive technical services to deliver effective, reliable, and high-performance nutritional ingredient solutions across UK pharmaceutical and supplement applications.
Strategic partnerships, manufacturing infrastructure development, and first-mover application execution are central to strengthening competitive positioning and presence across efficacy, purity, and health technology applications.
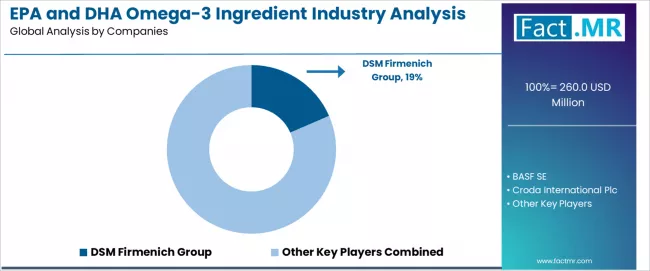
DSM Firmenich Group, internationally recognized nutritional ingredient leader, leads with 18.5% share, offering comprehensive EPA and DHA omega-3 ingredient solutions including formulation development, manufacturing, and technical services with focus on pharmaceutical applications, bioavailability optimization, and quality enhancement across UK operations. BASF SE, operating with extensive UK presence, provides integrated nutritional ingredient solutions leveraging German chemical expertise, application development, and quality management capabilities.
Croda International Plc delivers full-service omega-3 ingredient implementation including biotechnology development, purity optimization, and formulation integration serving UK and international pharmaceutical projects. Epax AS emphasizes comprehensive marine oil solutions with integrated purification capabilities, specialty concentrates, and application features leveraging advanced Norwegian sector expertise. GC Rieber AS offers EPA and DHA omega-3 ingredient application development and manufacturing operations for pharmaceutical facilities and supplement companies across UK operations.
Key Players in UK EPA and DHA Omega-3 Ingredient Industry
- DSM Firmenich Group
- BASF SE
- Croda International Plc
- Epax AS
- GC Rieber AS
- KD Pharma Group GmbH
- Aker BioMarine ASA
- Corbion N.V.
- Polaris Ingredients
- Golden Omega, Inc.
Scope of the Report
| Item |
Value |
| Quantitative Units (2035F) |
USD 408 million |
| Source |
Marine Oils, Algal, Concentrates/EE |
| Application |
Dietary Supplements, Infant Formula, Foods & Pharma |
| Form |
Concentrates, Standard Oils |
| Regions Covered |
England, Scotland, Wales, Northern Ireland |
| Key Companies |
DSM Firmenich Group, BASF SE, Croda International Plc, Epax AS, GC Rieber AS |
| Additional Attributes |
Sales by source and application segment; regional demand trends across England, Scotland, Wales, and Northern Ireland; competitive landscape with established ingredient manufacturers and specialized biotechnology firms; manufacturer preferences for marine oils versus algal sources; integration with preventive healthcare programs and cardiovascular health policies, particularly advanced in the England region |
UK EPA and DHA Omega-3 Ingredient Industry by Segments
-
Source :
- Marine Oils
- Algal
- Concentrates/EE
-
Application:
- Dietary Supplements
- Infant Formula
- Foods & Pharma
-
Form :
- Concentrates
- Standard Oils
-
Region :
- England
- Scotland
- Wales
- Northern Ireland



:max_bytes(150000):strip_icc()/KFheadshot-9fe00fcb29c24a589a05cb7dea9ca150.jpeg "We Asked a Doctor How Long You Need to Take Magnesium for Muscle Recovery")