About Editorial team of BIPNs

Main team of content of bipns.com. Any type of content should be approved by us.
23 10, 2025

Solana Price Prediction: ETF Approval Fuels Bullish Momentum as SOL Eyes Breakout Towards $200

By |2025-10-23T07:12:37+03:00October 23, 2025|Crypto News, News|0 Comments

Solana price gains renewed momentum after Hong Kong’s ETF approval, with bulls defending key support levels and eyeing a breakout towards the $200 zone.

Solana price latest rally is drawing fresh excitement across the crypto market. Following Hong Kong’s landmark approval of the first Solana ETF, investor confidence has surged as traders eye the network’s expanding global footprint.

ETF Approval Sparks Renewed Optimism for Solana Price

Hong Kong’s recent approval of the first Solana ETF has added a strong bullish undertone to the market. The announcement shared by Ash Crypto has quickly ignited interest across institutional and retail circles, marking Solana’s first major regulatory milestone in Asia.

This approval underscores Solana’s transition from a high-growth network to a globally recognized asset class. As ETFs typically enhance accessibility and legitimacy, many believe this move could open the door for further adoption and regional liquidity inflows throughout Q4.

ETF Filings Strengthen the Long-Term Bullish Thesis

Market data shows Solana leading all crypto assets in ETF filings since 2024, totaling 23 applications, as highlighted by CryptoCurb. This surpasses even Bitcoin and Ethereum, signaling an unusual level of institutional interest for a non-BTC chain.

Solana leads the market with 23 ETF filings, surpassing Bitcoin and Ethereum in institutional interest. Source: CryptoCurb via X

More ETF filings often precede structural market maturity, suggesting Solana may be gearing up for broader global exposure.

Solana Price Prediction: Bulls Defend Key Support with Precision

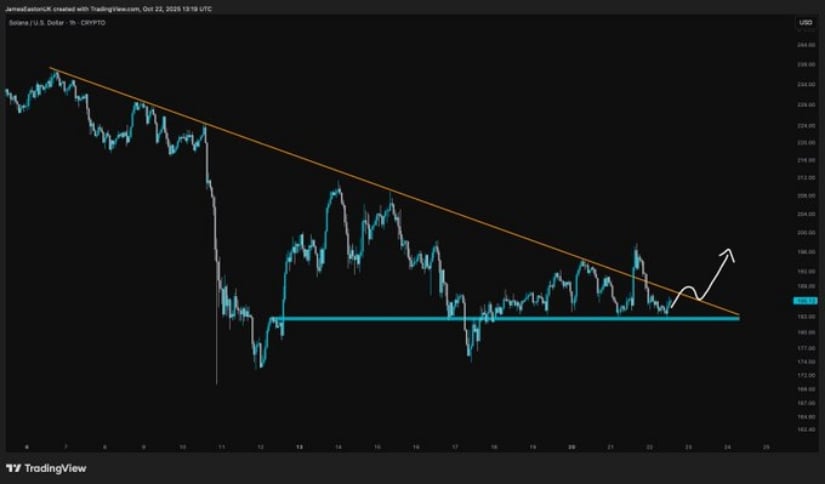
Technical setups continue to show strength near $182, where buyers have repeatedly stepped in to defend structure. James notes that price is respecting a long-term descending trendline and appears to be compressing tightly towards an imminent breakout zone.
Solana Price Prediction: ETF Approval Fuels Bullish Momentum as SOL Eyes Breakout Towards 0

Solana holds firm near $182 support as bulls eye a potential breakout towards the $200–$210 resistance zone. Source: James via X

A breakout above the trendline could trigger a sharp move towards $200 to $210, with short-term resistance around $195 acting as the initial test. Maintaining higher lows above $182 to $184 will be crucial to confirm continuation and invalidate any near-term bearish pressure.

Solana Triangle Breakout Could Start Next Expansion Leg

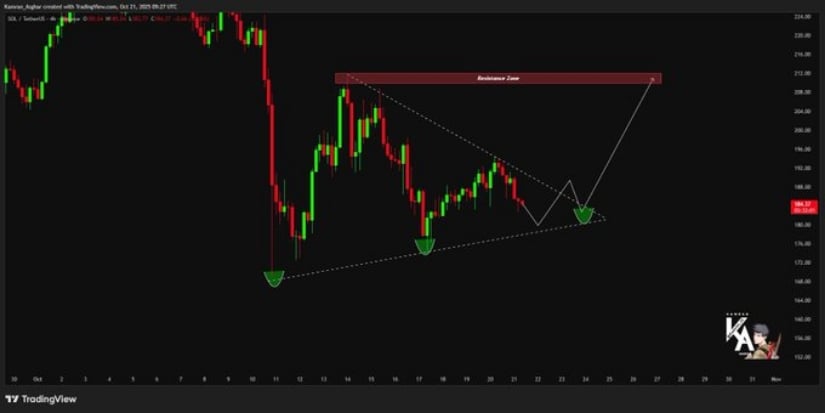
Chart formations shared by Kamran Asghar highlight Solana’s triangle consolidation pattern, reflecting tightening volatility before potential liftoff. The Solana price structure shows clear higher lows forming against flat resistance, a textbook setup for a bullish breakout.
Solana Triangle Breakout Could Start Next Expansion Leg

Solana’s triangle pattern signals tightening volatility, with a breakout above resistance potentially driving price toward $210–$220. Source: Kamran Asghar via X

If the triangle resolves upward, measured move projections suggest a possible run towards $210 to $220, with the lower boundary support resting around $178 to $180. Failure to hold that zone, however, could briefly retest prior liquidity pools near $170 before any recovery attempt.

On-Chain Fundamentals Support Price Strength

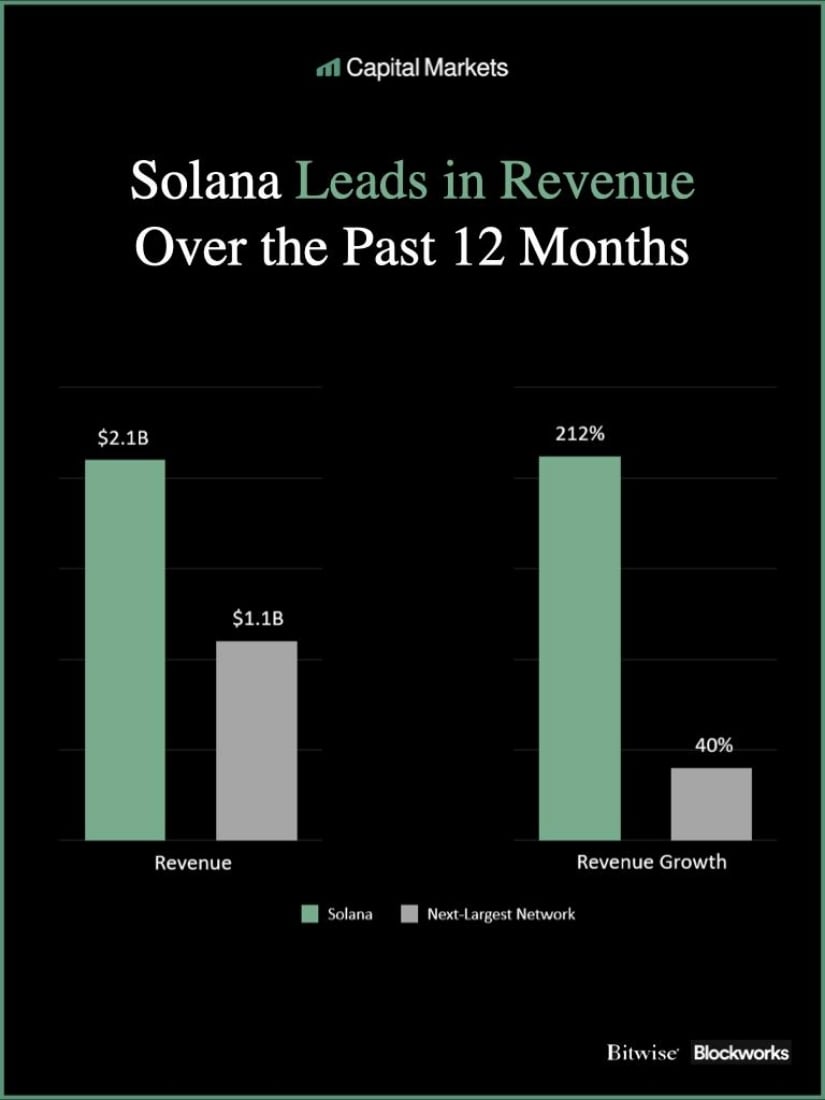
Solana’s on-chain growth remains a core pillar behind its ongoing resilience. Data shared by Capital Markets shows the network leading the industry with $2.1B in annual revenue, growing an impressive 212% year-over-year, far surpassing competing blockchains.
On-Chain Fundamentals Support Price Strength

Solana leads all major blockchains with $2.1B in annual revenue, marking a 212% year-over-year growth. Source: Capital Markets via X

These metrics reinforce Solana’s price position as not just a high-throughput chain, but a profitable ecosystem with real economic activity. Sustained revenue and network growth provide a strong backdrop for long-term holders, aligning well with the ongoing ETF momentum and bullish technical structures.

Final Thoughts: What’s Next for Solana?

From ETF approvals to leading on-chain performance, Solana price continues to stand out as one of the most fundamentally and structurally strong assets in the market. The combination of regulatory recognition, investor demand, and technical strength provides a firm setup heading into year-end.

If $182 support holds and the breakout above $195 to $200 confirms, SOL Solana price could easily revisit the $220 to $240 range in the coming weeks. With institutional participation expanding and ecosystem metrics at record highs, the Solana price prediction is aiming for a bullish rally.




Source link

23 10, 2025

Euro to Dollar Forecast: “EUR Could Test 1.1580”, Gold Price Slump Supports USD

By |2025-10-23T05:46:32+03:00October 23, 2025|Forex News, News|0 Comments


– Written by

The Euro to Dollar exchange rate (EUR/USD) has continued to lose ground, retreating to 1-week lows just below 1.1580 amid a solid dollar tone and a further sell-off in gold.

According to ING; “The dollar has remained bid as US credit market concerns continue to ease, and the large drop in precious metals potentially offers extra support. More USD gains from here should be harder to sustain though.”

Wall Street futures were slightly stronger on the day and, according to Danske Bank; “The cross remains largely driven by US credit and equity sentiment.”

UoB sees scope for a near-term trough; “EUR could test 1.1580, but a continued decline below this level is unlikely. The major support at 1.1540 is also unlikely to come into view for now. On the upside, resistance levels are at 1.1620 and 1.1640.”

Danske Bank has a 12-month EUR/USD forecast of 1.22.

Geo-political developments had a limited negative impact on the Euro following reports that the potential meeting between US President Trump and Russian President Putin had been postponed which dampened any talk of a potential Ukraine ceasefire.

Global trade developments will also be important amid underlying tensions over rare-earth minerals.

Save on Your EUR/USD Transfer

Get better rates and lower fees on your next international money transfer.
Compare TorFX with top UK banks in seconds and see how much you could save.


Compare the Best EUR/USD Rates »

According to ING, US-China trade developments will need to be watched closely. President Trump stated on Tuesday that his meeting with Chinese President Xi may not take place.

ING commented; “For now, this is being seen as simple brinkmanship, but China has struck a sourer tone around these negotiations, and markets may be erring on the side of complacency. No meeting doesn’t equal higher tariffs, but it should be enough to weigh on risk sentiment and the dollar.”

US political developments will also be under scrutiny.

Danske Bank commented; “The government shutdown is now on the cusp of becoming the second-longest on record as it enters its fourth week, and prediction markets increasingly see it extending into November. The next key catalyst for the pair will be Friday’s CPI release, where we see upside risks that could lend the USD additional near-term support.”

Markets are continuing to price in over a 95% chance of a Fed rate cut next week with over a 90% chance of another cut in December.

The latest US consumer prices data is due on Friday with consensus forecasts that core prices will increase 0.3% for September.

Commerzbank commented; “the data is unlikely to be a game changer for next week’s Fed meeting, as the majority of Fed members assume that any tariff effect on inflation will be temporary anyway.”

Like this piece? Please share with your friends and colleagues:


International Money Transfer? Ask our resident FX expert a money transfer question or try John’s new, free, no-obligation personal service! ,where he helps every step of the way,
ensuring you get the best exchange rates on your currency requirements.

TAGS: Euro Dollar Forecasts

Source link

23 10, 2025

How rising matcha prices are affecting local cafes

By |2025-10-23T05:31:53+03:00October 23, 2025|Dietary Supplements News, News|0 Comments


A vibrant bright green tea has picked up steam in United States media over the past few years. Matcha has been on the rise as cafes experiment with the radiant ingredient in desserts and beverages. Yet, matcha has also seen a recent influx in price. 

The growing popularity of the tea has increased the global market for matcha, with revenue expected to reach $5.5 billion by 2027, according to 2023 research from Global Edge.

Japan is the primary grower of matcha and exports more than half of its supply, according to the Japanese Ministry of Agriculture, Forestry and Fisheries and as reported by The Japan Times. In 2023, Japan produced over 4,000 tons of matcha. 

However, both environmental factors and economic policy have caused the matcha market to experience jumps in price. 

In recent years, poor weather and labor shortages have led to an imbalance in the supply and demand of matcha coming from Japan, according to an article by the Associated Press.

Along with foreign burdens, recent tariff implementations have also caused surges in matcha prices. In September, a baseline 15% tariff was placed on nearly all Japanese imports entering the U.S. as a part of the United States-Japan Agreement, according to a White House executive order. 

Despite the recent tariff agreements with Japan, the U.S. remains one of the top importers of matcha, with sales exceeding $10 billion within the last 25 years, according to Global Edge. 

But Arizona cafes and consumers have still been feeling the effects of these higher prices.

How local cafes are affected

Local cafes that source their teas internationally are dealing with the market shift, sometimes struggling to find balance between quantity and quality.

Songbird Coffee & Tea House is a local cafe in downtown Phoenix that previously sourced its matcha from the AOI Tea Company, which imports products from Japan.

Prices for AOI’s matcha have doubled due to both tariffs and increasing demand for the product, manager Frankie Hirsch said in a statement. In an effort to avoid raising prices, Songbird Coffee & Tea House is planning to switch matcha suppliers, Hirsch wrote. 

“We are pretty well known for our matcha, so we sampled quite a few brands,” Hirsch wrote. “We don’t want to skimp out on the quality of our products.” 

Tariffs have also impacted the price of the cafe’s espresso beans, Hirsch wrote. Their roaster has increased the price of the beans by 10%, leading to uncertainty for Songbird.

“As of right now we don’t quite know what that means for us,” Hirsch wrote. 

Learning about the news a week ago, Hirsch wrote that the effects of the price increase is yet to be seen at the coffee shop.  

Fillmore Coffee Co. is another Phoenix-based cafe that has seen increases in price from its matcha supplier.

“Where we would usually pay $30 to $40 for a bag of matcha, we are now paying $65 to start,” said manager Olivia Owens.

Owens noticed matcha prices rising about five months ago and for about one month, the company was dealing with backorder issues from its matcha supplier, Owens said.

Despite these changes occurring in the matcha market, the company has continued to charge customers with the same prices.

Fillmore has not had a price increase in the last four years which is something that sets it apart from other companies in the area, Owens said.

“We still are making profit because we get a lot of drinks from one (matcha) bag,” Owens said. 

Infusion Coffee & Tea is a cafe in Tempe with a “unique and informed perspective,” as they have not experienced price influxes yet, corporate trainer and web manager Devin O’Malley said in a statement.

Infusion is the daughter company of the wholesale company Infusion Distribution. The stock distribution company has not yet been affected by tariffs but anticipate possible impacts, O’Malley said. 

“Because we are a wholesaler operation, we have an excess of stock already in house,” O’Malley said.

Infusion mainly works in specialty coffee and only recently started selling ceremonial grade matcha. The coffee house recently experimented in finding a matcha alternative by grinding earl grey tea to mimic the stone grinding of matcha, she said. 

“Maybe the route will just be expanding what the matcha window is (and) what we use to do that,” she said.

Consumer impact

Matcha consumers are already starting to feel the effects of rising prices at local cafes near ASU’s campuses. 

READ MORE: Ditch that cup of coffee: Top 5 matcha cafes around ASU

Caitlin Giap, a freshman studying biological sciences, said ever since the tea became popular, prices have been increasing. 

Market shifts are changing student’s buying habits as the drink becomes more expensive. Where students used to buy matcha casually, some are now more selective about their spending. 

Matcha is now becoming something to have for special occasions, Giap said.

“It would have to be a sweet treat after I take a test or something like that,” Gabby Davis, a freshman studying biological sciences, said.

Troubles across seas and domestic surcharges are leaving the future of the matcha market unclear for companies and consumers alike. 

“Tea, in and of itself, is already facing a crisis, if you will, so it’s really just a wait and see if matcha ends up getting less popular,” O’Malley said.

Edited by Natalia Rodriguez, Senna James and Pippa Fung.


Reach the reporter at dbell39@asu.edu and follow @dhemibell on X. 

Like The State Press on Facebook and follow @statepress on X.


Dhemi BellCommunity Reporter

Dhemi Bell is a reporter on the Community and Culture desk at The State Press. She is a second-year at Arizona State University. This is her first semester with The State Press.


Continue supporting student journalism and donate to The State Press today.


Source link

23 10, 2025

MATIC Price Prediction: $0.48 Target by December 2025 Despite Current Technical Weakness

By |2025-10-23T05:11:35+03:00October 23, 2025|Crypto News, News|0 Comments


Joerg Hiller
Oct 17, 2025 05:27

MATIC price prediction shows mixed signals with analysts targeting $0.21-$0.72 range. Current technical indicators suggest caution before next bullish move toward $0.48.


MATIC Price Prediction: Navigating Mixed Signals Toward $0.48 December Target

With Polygon trading at $0.38 amid conflicting technical signals, our MATIC price prediction reveals a complex landscape where short-term bearish momentum could give way to medium-term recovery. Recent analyst forecasts paint a picture of potential volatility before the next significant move higher.

MATIC Price Prediction Summary

MATIC short-term target (1 week): $0.35-$0.40 range (-8% to +5%) • Polygon medium-term forecast (1 month): $0.42-$0.52 range (+11% to +37%) • Key level to break for bullish continuation: $0.43 (SMA 20 resistance) • Critical support if bearish: $0.33 (strong support level)

Recent Polygon Price Predictions from Analysts

The latest MATIC price prediction data reveals significant divergence among analysts. CoinCodex presents the most conservative near-term outlook with a $0.214786 target by October 18, 2025, representing a concerning -43% decline from current levels. This bearish short-term view is supported by technical indicators showing RSI at 40.90 and a Fear & Greed Index of 38.

Conversely, PricePredictions.com offers a more optimistic Polygon forecast with an average October price of $0.715326, suggesting an 88% upside potential. CoinArbitrageBot’s AI-driven analysis targets $0.48489 by year-end, representing a 28% gain that appears more realistic given current market conditions.

The consensus emerges around medium-term bullish potential despite short-term headwinds, with price targets clustering between $0.48-$0.72 for the remainder of 2025.

MATIC Technical Analysis: Setting Up for Consolidation Before Breakout

Current Polygon technical analysis reveals a cryptocurrency caught between competing forces. The RSI at 38.00 sits in neutral territory but leans bearish, while the MACD histogram at -0.0045 confirms weakening momentum. However, this technical weakness may be setting up an oversold bounce opportunity.

The Bollinger Bands analysis shows MATIC trading at 0.2879 position, closer to the lower band at $0.31, suggesting the token is oversold relative to its 20-day moving average. This positioning often precedes reversals, supporting our medium-term bullish MATIC price target.

Volume analysis from Binance shows $1.07 million in 24-hour trading, which remains relatively modest and suggests accumulation rather than distribution. The 14-day ATR of $0.03 indicates manageable volatility for position sizing.

Polygon Price Targets: Bull and Bear Scenarios

Bullish Case for MATIC

The primary MATIC price target for bulls centers on reclaiming the $0.43 SMA 20 level, which would trigger a move toward $0.48-$0.52. Breaking above the $0.56 upper Bollinger Band would confirm the bullish scenario and target the $0.58 strong resistance level.

For this bullish Polygon forecast to materialize, MATIC needs to hold above the $0.35 immediate support while RSI recovers above 50. The convergence of the EMA 12 and EMA 26 near $0.39-$0.42 creates a technical setup for a momentum shift.

Bearish Risk for Polygon

The bearish scenario activates if MATIC breaks below the $0.33 strong support level, which would expose the 52-week low at $0.37. A deeper correction could target the $0.31 lower Bollinger Band and potentially the analysts’ $0.21 downside target.

Key bearish triggers include RSI falling below 30, MACD histogram deepening into negative territory, and trading volume increasing on downside moves.

Should You Buy MATIC Now? Entry Strategy

Current technical levels suggest a measured approach rather than aggressive accumulation. The optimal buy or sell MATIC strategy involves waiting for either a bounce from $0.35 support or a breakout above $0.43 resistance.

Conservative entry points include: – Primary entry: $0.35-$0.36 (support zone test) – Aggressive entry: $0.40-$0.41 (if momentum shifts positive) – Stop-loss: $0.32 (below strong support) – Take-profit: $0.48 (medium-term target)

Position sizing should account for the 14-day ATR of $0.03, allowing for normal volatility while maintaining risk management discipline.

MATIC Price Prediction Conclusion

Our comprehensive MATIC price prediction assigns a MEDIUM confidence level to a $0.48 target by December 2025, representing a 26% upside from current levels. This forecast aligns with the AI-driven analysis while acknowledging short-term technical weakness.

Key indicators to monitor include RSI recovery above 45, MACD histogram turning positive, and sustained trading above the $0.35 support level. The Polygon forecast timeline suggests 6-8 weeks for this prediction to materialize, contingent on broader cryptocurrency market stability.

The critical decision point arrives at the $0.33 support level – a break below invalidates the bullish scenario and opens the door to the $0.21 downside target. Conversely, reclaiming $0.43 would confirm the path toward our $0.48 MATIC price target and potentially the more optimistic $0.72 level suggested by technical analysts.

Image source: Shutterstock


Source link

23 10, 2025

XAU/USD at risk of piercing the $4,000 threshold

By |2025-10-23T03:53:42+03:00October 23, 2025|Forex News, News|0 Comments


XAU/USD Current price: $4,049.41

  • US-China trade relationship shaping the market’s sentiment and the direction of the USD.
  • The UK Consumer Price Index rose by less than anticipated in September.
  • XAU/USD flirted with $4,000 before bouncing, risk remains skewed to the downside.

Gold price remained pressured throughout Wednesday, flirting with the $4,000 mark before finding some room to bounce towards the current $4,050 region. The US Dollar (USD) held on to its modest, yet positive momentum throughout the first half of the day, but lost steam after Wall Street’s opening.

Market players were relatively optimistic amid hopes that United States (US) President Donald Trump and his Chinese counterpart, Xi Jinping, would discuss a trade deal and avoid escalating tensions. Things changed when sources familiar with the matter reported that the White House is considering a plan to restrict globally produced exports to China made with or containing US software.

Other than that, the US government shutdown continues. In the twenty-second consecutive day of stalemate, House Speaker Mike Johnson accused Democrats of “eating up the clock” and making it more difficult to do the necessary things on time.

Meanwhile, the United Kingdom (UK) Office for National Statistics (ONS) reported September Consumer Price Index (CPI) figures. Headline inflation rose by 3.8% on year, below the 4.0% anticipated. On a monthly basis, prices remained flat after growing by 0.3% in August. Also, the core annual CPI rose 3.5%, down from the previous 3.6% and also below the 3.7% anticipated by market players. Easing inflation put pressure on the Sterling Pound.

XAU/USD short-term technical outlook

From a technical point of view, the XAU/USD pair is at risk of falling further, particularly if the $4,000 threshold gives up. The daily chart shows that the pair bounced from a bullish 20 Simple Moving Average (SMA), while the 100 and 200 SMAs maintain their bullish slopes far below the shorter one. At the same time, technical indicators extended their slides, heading south within positive levels.

In the near term, and according to the 4-hour chart, XAU/USD is stuck around a bullish 100 SMA, while the 20 SMA gained downward traction above the current level, providing resistance at around $4,025. Finally, technical indicators stand near oversold readings with uneven strength, still skewing the risk to the downside.

Support levels: 4,000.00 3,986.45 3,972.10

Resistance levels: 4,061.20 4,085.70 4,110.00


Source link

23 10, 2025

GBP/USD Price Forecast: Pound Sterling “Bearish” as Rate Expectations Soften

By |2025-10-23T03:44:46+03:00October 23, 2025|Forex News, News|0 Comments


– Written by

The Pound US Dollar exchange rate (GBP/USD) slipped on Wednesday after a softer-than-expected UK inflation print fuelled speculation that the Bank of England (BoE) could begin cutting interest rates before the end of the year.

At the time of writing, GBP/USD was trading around $1.3420, down roughly 0.4% from Wednesday’s opening levels.

The Pound (GBP) came under sustained selling pressure during the European session after the Office for National Statistics (ONS) reported that inflation in the UK cooled more than expected in September.

Headline CPI held steady at 3.8%, missing forecasts for a rise to 4%, while core inflation eased from 3.6% to 3.5%, instead of the anticipated uptick to 3.7%.

The weaker data suggested that inflationary pressures in the UK economy are fading faster than the BoE had anticipated, particularly in key areas such as food prices, which fell on the month.

According to ING, the data delivered a dovish signal for policymakers:

“The September UK inflation reading released this morning is sending a dovish signal to the Bank of England and weighing on the pound. Headline inflation remained unchanged at 3.8% (consensus 4.0%), while core slowed down from 4.6% to 3.5% and services CPI stabilised at 4.75% versus expectations of 4.8% and 0.3pp below the BoE’s latest forecast.”

Save on Your GBP/USD Transfer

Get better rates and lower fees on your next international money transfer.
Compare TorFX with top UK banks in seconds and see how much you could save.


Compare the Best GBP/USD Rates »

The bank added that the main surprise came from food prices — a major concern for the BoE of late — which are now around 0.5 percentage points below the Bank’s August forecasts.

This softer inflation outlook prompted traders to ramp up bets on a potential December rate cut, leaving the Pound on the defensive throughout the day.

The US Dollar (USD), meanwhile, held steady in relatively thin trading conditions amid a quiet domestic calendar.

Easing trade tensions between the US and China provided some modest support for the ‘Greenback’, after President Donald Trump described progress on trade negotiations as “fantastic” and signalled plans to meet Chinese leader Xi Jinping next week.

The comments helped stabilise risk sentiment, though they failed to trigger any sustained directional move in USD exchange rates.

GBP/USD Forecast: UK Business Confidence to Drive Sterling?

Looking ahead, movement in the Pound US Dollar exchange rate on Thursday may hinge on the Confederation of British Industry’s (CBI) business optimism index.

Economists expect sentiment among UK firms to have softened in the final quarter of the year amid concerns about the economic outlook and tightening fiscal conditions ahead of Chancellor Rachel Reeves’s autumn budget.

A weaker-than-expected print could see the Pound remain under pressure, while any upside surprise might help Sterling stabilise after its mid-week losses.

In the US, the government shutdown continues to suppress key data releases, meaning market sentiment will likely drive Dollar direction.

If risk appetite fades, USD could benefit from safe-haven demand, whereas a more upbeat tone across global markets may see the ‘Greenback’ give back some recent gains.

Like this piece? Please share with your friends and colleagues:


International Money Transfer? Ask our resident FX expert a money transfer question or try John’s new, free, no-obligation personal service! ,where he helps every step of the way,
ensuring you get the best exchange rates on your currency requirements.

TAGS: Pound Dollar Forecasts

Source link

23 10, 2025

XRP Price Prediction: XRP Charts Bullish Path with $2.45 Neckline and $3.10 Breakout Goal

By |2025-10-23T03:09:53+03:00October 23, 2025|Crypto News, News|0 Comments

A major bullish pattern is quietly emerging on the XRP chart, and traders are closely watching the $2.45 neckline.

If confirmed, this setup could trigger a strong rally toward $3.10, potentially setting the stage for one of XRP’s most notable breakout attempts in recent months.

Behind the scenes, whale accumulation, growing trading volumes, and optimistic market sentiment are adding weight to this technical signal. With price consolidating at a critical range, the next move could shape the token’s outlook heading into the last quarter of 2025.

Inverse Head and Shoulders Pattern Sets the Stage

The latest analysis on TradingView shows a clear Inverse Head and Shoulders pattern developing since early October 2025. The structure has its neckline positioned around $2.45, with an upside projection toward $3.10 once a breakout occurs. The base of the formation is anchored near recent lows of $2.20, suggesting a healthy accumulation phase underneath the surface.

XRP is forming a classic inverse head and shoulders pattern, aiming for a breakout toward the $3.10 resistance level. Source: Kamran Asghar via X

Market participants have historically viewed this pattern as a bullish reversal signal. A decisive move above the neckline often sparks renewed buying interest, which can quickly accelerate price momentum in trending markets.

XRP Price Holds Strong Amid High Volume

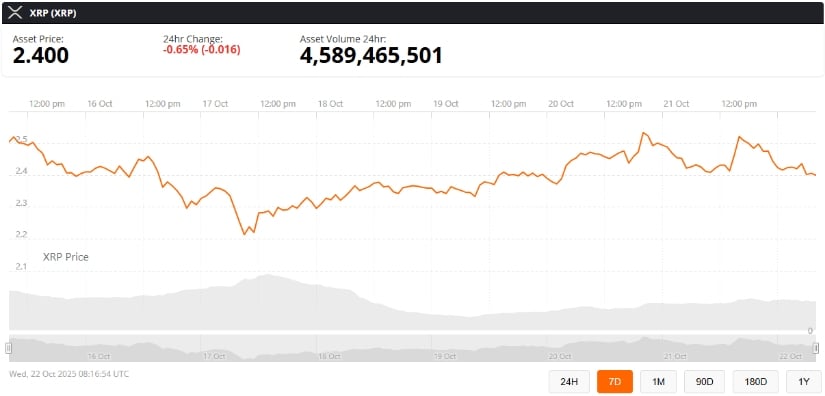
Despite mild intraday weakness, XRP price today remains resilient. The token recently recorded a 24-hour trading volume exceeding $5.1 billion, reflecting heightened market activity and investor engagement. XRP has swung between $2.21 and $2.64 over the past week, maintaining its position among the top-performing cryptocurrencies by market capitalization. It currently ranks #5 with a market cap of approximately $145.25 billion.

XRP Price Prediction: XRP Charts Bullish Path with .45 Neckline and .10 Breakout Goal

XRP was trading at around $2.40, down 0.65% in the last 24 hours at press time. Source: XRP price via Brave New Coin

The current XRP price sits just above its 50-day exponential moving average (EMA) of $2.40, while the 200-day EMA remains at $2.54. This narrow range has created a standoff between short-term traders taking profits and long-term holders positioning for a larger upside.

Whales Accumulate Over 30 Million XRP

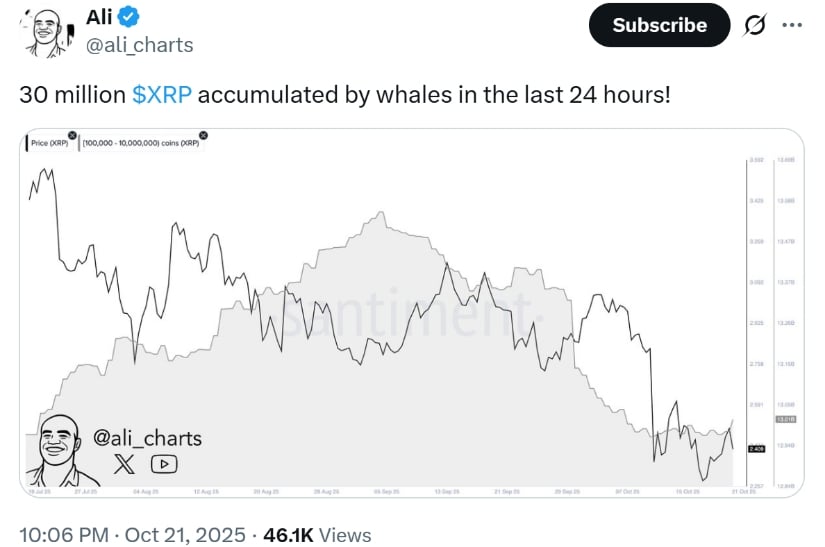
On-chain data from Santiment provides further support for the bullish thesis. In the 24 hours ending October 22, whale wallets accumulated more than 30 million XRP, valued at around $74 million. This spike in large-holder transactions (100,000 to 10 million coins) coincides with price stabilization near $2.40, often a sign that institutional players are quietly building positions.

Whales Accumulate Over 30 Million XRP

Whales have accumulated 30 million XRP in the past 24 hours, signaling renewed large-scale investor interest. Source: Ali Martinez via X

Market observers are speculating that this accumulation could be linked to anticipated regulatory catalysts, including potential developments around the U.S. Securities and Exchange Commission and discussions tied to a possible Grayscale XRP ETF approval window between October 18 and November 14.

Technical Indicators Suggest Imminent Move

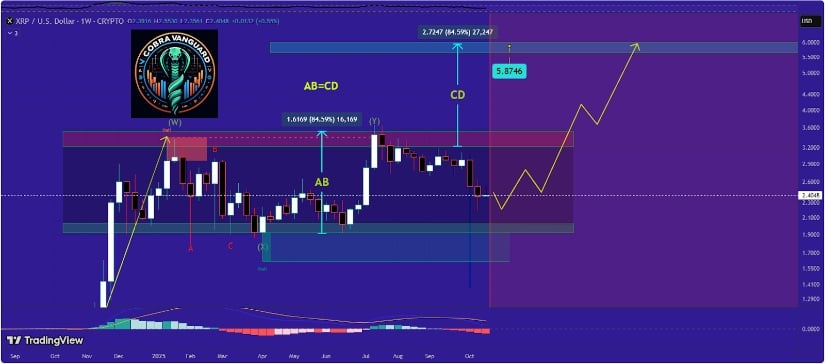
The XRP/USD pair is trading in a tight range, with the Relative Strength Index (RSI) sitting at a neutral 46. This neither strongly favors bulls nor bears but points to a potential volatility spike ahead. Candlestick patterns such as Doji and spinning tops are emerging on the chart—a classic sign of market indecision before a major directional move.

Technical Indicators Suggest Imminent Move

XRP price remains range-bound, but a breakout from the upper channel could set the stage for a potential $5 target. CobraVanguard on TradingView

If the XRP price closes decisively above $2.48, analysts believe this could spark renewed momentum, with immediate targets near $2.64 and $2.70. On the flip side, a close below $2.40 would weaken the bullish outlook and expose the $2.21 support zone as the next key level to watch.

The broader XRP community remains optimistic, with several traders pointing to potential price targets well above $3 if the current pattern confirms. Many cite multi-year technical structures, regulatory progress around the XRP lawsuit, and growing institutional interest as reasons for the bullish sentiment. Still, volatility across the crypto market and retail selling pressure could shape short-term fluctuations.

Trader Takeaway: Patience Before the Breakout

For traders, this is a classic “wait-and-see” scenario. A breakout above the $2.45 neckline could open the door to a swift rally toward the XRP price target of $3.10. Conversely, a failure to defend support may trigger a corrective move back to lower levels.

The market is at a decision point, and both technical and on-chain data suggest that the next major move could come soon. Whether it’s ETF speculation, whale accumulation, or pattern confirmation, XRP seems poised for a defining moment in its price trajectory.

Source link

23 10, 2025

Natural Gas Price Forecast: 200-Average Caps $3.57 Surge

By |2025-10-23T01:52:45+03:00October 23, 2025|Forex News, News|0 Comments


Trade Setup

October’s double top stalled at a rising channel level, extended by 25% to capture that advance. Today’s push above $3.55 shows minor bullish strength, but a close above $3.46 and $3.45 is needed to confirm the breakout. Without it, the second-day surge fades. Clearing the $3.59 swing high (B) would spark a bullish reversal, building on the rally from the $2.89 swing low (C).

Upside Targets

A $3.59 breakout targets the 25% extended channel top, with a rising ABCD pattern pointing to $3.71 as the initial harmonic goal. The $3.57 high completed a 61.8% Fibonacci retracement, so surpassing $3.59 would eye the 78.6% level at $3.82 for further upside. Recent channel tests suggest another approach is plausible before the rally exhausts.

Support Levels

The 20-day moving average at $3.25 anchors key dynamic support. Staying above it preserves the near-term bullish bias, even if today’s close weakens. A drop below signals caution, but the structure favors buyers if this floor holds.

Outlook

The $3.46-$3.45 zone is pivotal – close above to lock in strength and aim for $3.59, or below to test $3.25. Today’s close decides: $3.59 opens $3.71 and $3.82, but a failed breakout keeps sellers active. Momentum tilts upward if support stands—watch the triggers for the next swing.

For a look at all of today’s economic events, check out our economic calendar.


Source link

23 10, 2025

If You Take CoQ10, a Leading Heart Doctor Warns of a Rarely Discussed Side Effect

By |2025-10-23T01:30:15+03:00October 23, 2025|Dietary Supplements News, News|0 Comments


About the expert

  • Frederick St. Goar, MD, is a board-certified cardiologist at El Camino Health in California, where he also serves as medical director of the hospital’s Norma Melchor Heart & Vascular Institute. A member of El Camino Health for more than 30 years, Dr. St. Goar is widely recognized for his contributions to interventional cardiology. In 2024, he received both the Andreas Gruentzig Ethics Award—the highest honor in the field—and the Octane Cardiovascular Innovation Award, which celebrates leaders in cardiovascular innovation.

Highlights

  • CoQ10 is a popular supplement known for supporting overall health and energy.
  • Some research suggests it may also influence blood pressure levels.
  • Most people tolerate CoQ10 well, but mild side effects can occur.
  • A cardiologist explains who should use caution and when to talk to your doctor before taking it.

Coenzyme Q10—often called CoQ10—has become one of the most popular supplements for people looking to boost their wellness. Best known for its role in heart health, CoQ10 helps the body produce energy at the cellular level and acts as a powerful antioxidant that protects cells from damage. It’s also drawn interest for other potential benefits, such as reducing migraine frequency and supporting fertility.

But even if you’re taking CoQ10 for reasons unrelated to your heart, it’s important to know that the supplement may affect your blood pressure.

Ahead, Frederick St. Goar, MD, a board-certified cardiologist with El Camino Health, explains how CoQ10 works in the body, the possible side effects to watch for, and when to talk to your doctor before adding it to your routine.

What is CoQ10, and how does it affect blood pressure?

“CoQ10 is an enzyme that the body naturally makes,” Dr. St. Goar explains. “It acts as an antioxidant and has effects on various cells, including the endothelium, or lining, of your blood vessels.” Dr. St. Goar adds CoQ10 “may protect and preserve [the endothelium] from damage or deterioration.”

The endothelium plays a major role in keeping your blood vessels flexible. When it’s healthy, your arteries can expand and contract as needed to maintain normal blood pressure. “The health of your endothelium is one of many factors that keep your arteries compliant, and thus your blood pressure within a normal range,” he adds.

As we age, the body’s natural production of CoQ10 declines, which may contribute to endothelial dysfunction and rising blood pressure. Some research suggests that supplementing with CoQ10 can help offset this effect, though results have been mixed.

Dr. St. Goar says CoQ10 supplement has been extensively studied as a method to lower the detrimental increase in blood pressure that occurs with age, but the data has not been consistent. He adds, “While it may be beneficial in some patients, there are presently no predictors as to whom that might be. For this reason it is not routinely recommended by physicians for this purpose.”

CoQ10 side effects: What to know before taking it

Overall, CoQ10 is considered safe for most people. However, like any supplement, it’s not completely without side effects.

“As a supplement, CoQ10 has no well-documented risks, and is usually well-tolerated by patients,” says Dr. St. Goar. “On a rare occasion I have had patients complain that it can be tough on the GI tract causing nausea, cramping and diarrhea.”

These digestive issues are uncommon but can happen, particularly when CoQ10 is taken on an empty stomach or in higher doses. Taking your supplement with food—or splitting your daily dose into two smaller servings—can often help minimize discomfort.

Because CoQ10 may lower blood pressure, those who already have low blood pressure (also known as hypotension) should use it cautiously and only under medical supervision.

It’s also important to know that dietary supplements aren’t strictly regulated by the U.S. Food and Drug Administration (FDA). That means the strength or purity of CoQ10 can vary from one brand to another. For that reason, it’s best to choose products that have been third-party tested for quality and safety—when in doubt, look for the USP seal on the label to signal United States Pharmacopeia verification. Also, discuss any new supplement with your doctor before starting.

How much CoQ10 should you take?

“There is no data or information at this point supporting or confirming an ‘ideal’ or ‘effective’ dose, though well-tolerated dosing ranges in the 100 milligrams (mg) to 200 milligrams a day,” Dr. St. Goar says.

Most CoQ10 supplements fall within this general range, but the right dose can vary depending on your health status and reason for taking it. People using CoQ10 for heart support, fertility, or other conditions should always check with their healthcare provider for personalized recommendations.

CoQ10 and statins: Things to know

Many people who take statins for high cholesterol also reach for CoQ10 supplements. That’s because statins can lower your body’s natural CoQ10 levels, potentially leading to side effects like muscle soreness.

“Statins, the most commonly prescribed medication for managing elevated cholesterol, can, on a rare occasion, have the side effect of muscle soreness due to low level inflammation,” Dr. St. Goar notes. In some patients, this discomfort can be eased by the antioxidant and anti-inflammatory effects of CoQ10 supplements. “There is limited harm in trying this though it is hard to predict in whom it will be effective and beneficial,” he adds.

Who should avoid CoQ10?

While CoQ10 is generally safe, Dr. St. Goan says some people should use extra caution.

“CoQ10 should not be considered a replacement for prescribed blood pressure medications, and its use—especially in patients with heart conditions—should be discussed with one’s physician,” explains Dr. St. Goar. “It is contraindicated in patients taking the blood thinner warfarin, as it may impact its effect.” (In medical terms, “contraindicated” means that something should be avoided because it could interfere with another medication or cause harm.)

If you’re thinking about taking CoQ10, it’s best to check with your doctor first. Licensed healthcare professionals can help determine whether it’s safe for you, recommend the right dosage, and ensure it won’t interact with any other medications or supplements you are currently take.

For daily wellness updates, subscribe to The Healthy by Reader’s Digest newsletter and follow The Healthy on Facebook and Instagram. Keep reading:


Source link

23 10, 2025

BTC, ETH, BNB, XRP, SOL, DOGE, ADA, HYPE, LINK, XLM — TradingView News

By |2025-10-23T01:08:57+03:00October 23, 2025|Crypto News, News|0 Comments

Key points:

  • Bitcoin bulls are attempting to sustain the price above $107,000, but the bears have continued to exert selling pressure.

  • The recovery in most major altcoins has fizzled out, indicating that the bears continue to sell on minor rallies.

Buyers have managed to keep Bitcoin BTCUSD above the vital $107,000 support level, but the lack of a solid rebound suggests that the bears have maintained their pressure. The short-term uncertainty has divided the analysts on BTC’s next directional move. 

Standard Chartered’s global head of digital assets research, Geoff Kendrick, told Cointelegraph that BTC remains on track to hit $200,000 by the end of 2025. Kendrick believes the investors will consider the recent sell-off as a buying opportunity, propelling BTC higher. 

On the other end of the spectrum is veteran trader Peter Brandt, who sees similarities between BTC’s chart and the soybean market of the 1970s, which nosedived 50% after global supply exceeded demand. Brandt told Cointelegraph that BTC is forming a broadening top chart pattern, “famous for tops,” which could pull the price down to about $60,000.

What are the critical support levels to watch out for in BTC and the major altcoins? Let’s analyze the charts of the top 10 cryptocurrencies to find out.

Bitcoin price prediction

BTC rallied sharply on Tuesday, but the bears cut short the recovery attempt at the 50-day simple moving average ($114,137).

Sellers will try to strengthen their position by pulling the Bitcoin price below the $107,000 support. If they succeed, the risk of a drop in the psychological support of $100,000 increases. Buyers are expected to defend the $100,000 level with all their might because the failure to do so could start a new downtrend.

The first sign of strength will be a break and close above the $116,000 level. That suggests the BTCUSDT pair could remain within the $107,000 to $126,199 range for some more time.

Ether price prediction

Ether ETHUSD turned down from the 20-day exponential moving average ($4,062) on Tuesday, signaling the bears are selling on minor rallies.

The bears will try to sink the Ether price below the support line of the descending channel pattern. If they manage to do that, the selling could pick up, and the ETHUSDT pair risks dropping to $3,350. 

Buyers will have to drive the price above the moving averages to suggest that the pair could remain inside the channel for a while longer. The bulls will gain the upper hand on a close above the resistance line.

BNB price prediction

BNB BNBUSD has been trading between the moving averages since Friday, indicating a tough battle between the bulls and the bears.

The downsloping 20-day EMA ($1,122) and the RSI in the negative territory indicate a slight edge to the bears. A close below the 50-day SMA ($1,041) signals the start of a new downtrend to $932.

Contrarily, a close above the 20-day EMA indicates that the bulls have overpowered the bears. That opens the doors for a relief rally to the 50% Fibonacci retracement level of $1,198.

XRP price prediction

XRP’s XRPUSD bounce off the $2.30 support fizzled out at the 20-day EMA ($2.55) on Tuesday, indicating a negative sentiment.

The bears will try to build upon their advantage by pulling the XRP price below the $2.19 support level. If they can pull it off, the XRPUSDT pair may tumble to $2.06 and subsequently to $1.90.

Buyers will have to swiftly drive the price above the 20-day EMA to signal a comeback. The pair may then climb to the 50-day SMA ($2.79) and later to the downtrend line. A close above the downtrend line suggests the end of the corrective phase. The pair may then ascend toward $3.38.

Solana price prediction

Solana SOLUSD turned down from the 20-day EMA ($198) on Tuesday, indicating that the bears are attempting to retain control.

The SOLUSDT pair could slide to the support line of the descending channel pattern, where the buyers are expected to step in. The bulls will have to drive the Solana price above the 20-day EMA to suggest that the pair may remain inside the channel for a while longer. A new up move could begin on a close above the resistance line.

Sellers are likely to have other plans. They will try to sink the price below the support line. If they can pull it off, the pair could plunge to $155 and then to $145.

Dogecoin price prediction

Dogecoin DOGEUSD failed to rise above the 20-day EMA ($0.21), indicating that the bears are selling on minor rallies.

The Dogecoin price could dip to $0.18, which is a crucial support to watch out for. If bears pull the DOGEUSDT pair below $0.18, the next stop is likely to be $0.16 and eventually $0.14.

Contrary to this assumption, if the price turns up sharply and breaks above the 20-day EMA, it suggests that the selling pressure is reducing. The pair could climb to the 50-day SMA ($0.23) and later to the stiff overhead resistance at $0.29.

Cardano price prediction

Cardano’s (ADA) recovery attempt could not even reach the 20-day EMA ($0.70), indicating a lack of demand at higher levels.

The bears will attempt to increase their advantage by pulling the Cardano price below the $0.59 support. If they succeed, the ADAUSDT pair could plummet to the critical support at $0.50. Buyers are expected to defend the $0.50 level with all their might because a close below it clears the path for a fall to $0.40.

This negative view will be invalidated in the near term if the price turns up and rises above the breakdown level of $0.75. The pair may then climb to the downtrend line.

Hyperliquid price prediction

Hyperliquid (HYPE) turned down from the neckline of the head-and-shoulders pattern, indicating that the bears remain in control.

The downsloping 20-day EMA ($40.09) and the RSI in the negative territory increase the likelihood of further downside. There is support at $33.28, but if the level cracks, the HYPE/USDT pair could descend to $30.50 and then to $28.

The bulls will have to drive and maintain the Hyperliquid price above the neckline to signal that the selling pressure is reducing. The pair may rally to the 50-day SMA ($46.42) and then to $51.

Chainlink price prediction

Chainlink (LINK) dipped near the support line of the descending channel pattern after buyers failed to push the price above the 20-day EMA ($19.02).

Sellers will attempt to sink the price below the support line and retest the $15.43 level. Repeated retest of a support level tends to weaken it. If the $15.43 level gives way, the Chainlink price may tumble to $12.73.

The bulls will have to push and sustain the price above the 20-day EMA to indicate strength. The LINKUSDT pair could then rally to the resistance line, where the bears are expected to sell aggressively.

Stellar price prediction

The bears stalled Stellar’s (XLM) relief rally near the 20-day EMA ($0.34) on Tuesday, indicating a negative sentiment.

The XLMUSDT pair risks falling to $0.29, which is a critical support to watch out for. If the $0.29 support breaks down, the selling could accelerate, and the Stellar price may decline to $0.25.

Buyers will have to push and maintain the price above the breakdown level of $0.34 to signal strength. The pair could then rise to the downtrend line, where the bears are expected to pose a strong challenge. A close above the downtrend line signals a potential trend change.

This article does not contain investment advice or recommendations. Every investment and trading move involves risk, and readers should conduct their own research when making a decision.

Source link

Go to Top