About Editorial team of BIPNs

Main team of content of bipns.com. Any type of content should be approved by us.
3 09, 2025

How High Can WLFI Go?

By |2025-09-03T15:40:47+03:00September 3, 2025|Crypto News, News|0 Comments

The post World Liberty Financial (WLFI) Price Prediction 2025, 2026–2030: How High Can WLFI Go? appeared first on Coinpedia Fintech News

Story Highlights

  • WLFI price today is at $  $ 0.22920737
  • WLFI price could reach a maximum of $0.515 in 2025.
  • The token could touch $3.897 by 2030 if adoption accelerates.

World Liberty Financial (WLFI) is a hybrid finance protocol bringing together traditional banking with DeFi. Backed by Donald J. Trump and institutional investors, it is powered by its governance token $WLFI and a USD-pegged stablecoin, USD1. This is in order to drive financial inclusion and strengthen the U.S. dollar dominance through a compliant, audit-backed framework.

WLFI is built on Ethereum with cross-chain support through Chainlink’s CCIP and planned expansion to Solana and BNB Chain. A mobile app is in development to onboard Web2 users for staking, lending, and governance. With a fixed 100 billion token supply, future unlocks require community votes. The Trump family holds 15.75 billion WLFI, raising governance neutrality questions, while staking utilities are set to launch soon.

World Liberty Financial Price Today

Cryptocurrency World Liberty Financial
Token WLFI
Price $0.2292

down -5.08%
Market Cap $ 5,654,332,813.49
24h Volume $ 1,524,801,747.8922
Circulating Supply 24,669,070,265.00
Total Supply 100,000,000,000.00
All-Time High $ 0.4600 on 01 September 2025
All-Time Low $ 0.2096 on 01 September 2025

World Liberty Financial Price Prediction 2025

If WLFI’s adoption accelerates, driven by its USD1 stablecoin being used in high-value institutional settlements, further exchange listings, and staking rollout, the upper target of $0.515 is achievable. On the flip side, regulatory headwinds or delays in app development could test the low of $0.172.

Year Potential Low Potential Average Potential High
2025 $0.172 $0.344 $0.515

Also read: Trump Coin Price Prediction 2025, 2026-2030

WLFI Price Prediction 2026 – 2030

Year Potential Low ($) Potential Average ($) Potential High ($)
2026 0.258 0.516 0.773
2027 0.387 0.774 1.160
2028 0.581 1.161 1.741
2029 0.872 1.742 2.612
2030 1.308 2.613 3.897

WLFI Cryptocurrency Forecast 2026

In 2026, WLFI could trade between $0.258 and $0.773, with an average near $0.516. As more users are onboarded through its upcoming mobile app and cross-chain features mature, liquidity may deepen, supporting steady price growth.

WLFI Coin Price Prediction 2027

For 2027, WLFI’s price could reach a maximum of $1.160, while its potential low sits at $0.387. Assuming staking is fully integrated and institutional use of USD1 expands, the average price could stabilize around $0.774.

WLFI Token Price Projection 2028

By the end of 2028, WLFI could see further traction among compliant DeFi protocols, helping the price hit $1.741 at its peak. A more conservative outlook suggests a low of $0.581, with a median value near $1.161.

WLFI Price Analysis 2029

If WLFI’s governance model remains strong and avoids centralization risks despite Trump family holdings, the token may range between $0.872 and $2.612, with an average projection of $1.742 in 2029. Global DeFi adoption and regulatory clarity would be key catalysts.

WLFI Crypto Price Forecast 2030

Looking ahead to 2030, WLFI’s long-term outlook depends heavily on USD1 adoption as a compliant settlement stablecoin and its ability to bridge traditional banking with DeFi. In a bullish scenario, WLFI may climb to $3.897, while a bearish climate could limit it to $1.308. The average price is expected to hover around $2.613.

Market Analysis

Firm Name 2025 2026 2030
CoinEdition 0.33 0.42 0.75
MEXC 0.05 0.0525 0.0638
CoinCodex 0.165 0.3333 0.5033

*The aforementioned targets are the average targets set by the respective firms.

CoinPedia’s WLFI Price Projection

Expecting a bullish outlook, WLFI price could claim a high of $0.515 in 2025. Conversely, a bearish climate may push it toward $0.172. Over the longer term, WLFI could scale up to $3.897 by 2030, provided the protocol sustains real-world use cases and keeps regulatory compliance at its core.

Year Potential Low Potential Average Potential High
2025 $0.172 $0.344 $0.515

Also check out: Ethereum Price Prediction 2025, 2026-2030.

FAQs

What is World Liberty Financial (WLFI)?

WLFI is a hybrid finance protocol that combines traditional banking with DeFi using its governance token WLFI and USD1 stablecoin.

What is the total supply of WLFI tokens?

WLFI has a fixed supply of 100 billion tokens, with community-controlled unlocks.

Is WLFI a good investment?

Yes, if we consider compliant DeFi adoption and USD-pegged stablecoin growth. WLFI’s strong institutional backing and governance model give it long-term potential.

Source link

3 09, 2025

Solana’s Breakthrough Upgrade Sparks Race for Web3 Supremacy

By |2025-09-03T13:53:04+03:00September 3, 2025|News, NFT News|0 Comments


Solana, one of the most prominent blockchain platforms, is currently experiencing significant market attention amid ongoing technical upgrades and shifting investor sentiment. Recent developments suggest the network is preparing for a major transformation, as the Solana community overwhelmingly approved the Alpenglow upgrade with 98.27% of stakers voting in favor. This update, which replaces core components of the network—Proof-of-History and TowerBFT—introduces Votor and Rotor, two new systems designed to enhance transaction finality and reduce data transfer overhead [1]. According to the upgrade’s timeline, Votor is expected to cut finality times from over 12 seconds to approximately 150 milliseconds, while Rotor will focus on improving scalability for high-demand applications such as decentralized finance (DeFi) and Web3 gaming [1]. This technical evolution is seen as a critical step in positioning Solana for broader adoption and increased transaction throughput, reinforcing its position as a top-tier blockchain for developers and users alike.

The market has responded to these developments with renewed interest in Solana’s price trajectory. As of late August 2025, Solana (SOL) traded above $200, marking a significant recovery from earlier price dips in the year. Analysts suggest that the token is on a strong trajectory, with a peak price of $224 expected by November 2025, driven by growing on-chain activity and institutional interest [2]. The Solana blockchain continues to attract real-world asset (RWA) projects, decentralized finance protocols, and high-performance dApps, all of which contribute to increased network utilization and, potentially, long-term value capture for SOL holders. Furthermore, the approval of a spot Solana ETF by the U.S. Securities and Exchange Commission (SEC) in October 2025 is anticipated to serve as a major catalyst for price appreciation, as it could unlock a new wave of institutional demand [2].

Despite this optimism, Solana faces immediate downside risks. Market watchers caution that SOL could struggle to maintain its position above $180 in the near term, with fading momentum and weak support levels contributing to bearish sentiment [4]. If the token breaks below $174, analysts warn that a more pronounced selloff could follow, particularly if broader market conditions remain volatile. However, many remain bullish in the medium to long term, citing Solana’s ongoing innovation and expanding ecosystem as key differentiators. The network’s recent performance, including a 14% week-on-week gain, reinforces this view, with the bulls targeting a potential $300 level based on technical indicators such as the RSI and volume patterns [6].

At the same time, attention is increasingly shifting to emerging projects like DeSoc, a SocialFi initiative that has raised over $10 million in its presale phase. DeSoc’s $SOCS token is gaining traction for its unique approach to decentralized social infrastructure, allowing users to monetize content and maintain cross-platform identity without relying on centralized intermediaries [3]. Unlike Solana, which focuses on infrastructure and transaction efficiency, DeSoc is addressing a growing need in Web3: decentralized identity and content monetization. Analysts highlight this as a compelling value proposition, particularly in an era where social media platforms are under scrutiny for data privacy and creator compensation [5]. With over 50,000 wallets participating in its presale and a structured roadmap emphasizing scalability and adoption, DeSoc is positioned as a potential 2,000% gain for early investors [4].

While Solana and DeSoc operate in different niches of the blockchain space, both projects are vying for the attention of crypto investors seeking high-growth opportunities. Solana’s strength lies in its established ecosystem and technical capabilities, whereas DeSoc’s appeal stems from its novel approach to social media and content creation in a decentralized context. As the market continues to evolve, the interplay between these projects could shape the next phase of Web3 adoption, with institutional and retail investors alike weighing their respective risks and rewards.

Source:

[1] title1 (https://www.coindesk.com/tech/2025/09/02/solana-set-for-major-overhaul-after-98-votes-to-approve-historic-alpenglow-upgrade)

[2] title2 (https://icobench.com/cryptocurrency/solana-price-prediction/)

[3] title3 (https://www.thecoinrepublic.com/2025/08/29/desoc-raises-over-10-million-cardano-and-dogecoin-investors-bet-big-socs/)

[4] title4 (https://coindoo.com/solana-price-prediction-sol-price-eyes-220-whilst-desoc-set-for-2000-gains/)

[5] title5 (https://coindoo.com/is-this-the-best-crypto-investment-of-2025-as-desoc-could-recreate-shiba-inu-and-pepe-coin-gains/)

[6] title6 (https://cryptodnes.bg/en/solana-rebounds-to-200-as-new-solana-bot-presale-nears-3-5m/)


Source link

3 09, 2025

Pound Sterling recovery seems brittle as gilt yields edge higher

By |2025-09-03T13:43:39+03:00September 3, 2025|Forex News, News|0 Comments

  • GBP/USD recovers above 1.3400 after dropping to its weakest level in nearly a month.
  • Long-dated UK gilt yields remain near multi-decade highs.
  • Key resistance area for GBP/USD aligns at 1.3440-1.3460.

After falling more than 1% and registering its biggest one-day loss since April on Tuesday, GBP/USD touched its lowest level since early August at 1.3333 in the Asian session on Wednesday. Although the pair recovered above 1.3400 in the European trading hours, investors could refrain from betting on an extended rebound.

Pound Sterling Price This week

The table below shows the percentage change of British Pound (GBP) against listed major currencies this week. British Pound was the weakest against the US Dollar.

USD EUR GBP JPY CAD AUD NZD CHF
USD 0.35% 0.68% 1.02% 0.45% 0.21% 0.44% 0.51%
EUR -0.35% 0.32% 0.61% 0.10% -0.14% 0.09% 0.15%
GBP -0.68% -0.32% 0.18% -0.22% -0.45% -0.23% -0.12%
JPY -1.02% -0.61% -0.18% -0.50% -0.80% -0.55% -0.49%
CAD -0.45% -0.10% 0.22% 0.50% -0.23% -0.01% 0.10%
AUD -0.21% 0.14% 0.45% 0.80% 0.23% 0.23% 0.35%
NZD -0.44% -0.09% 0.23% 0.55% 0.00% -0.23% 0.11%
CHF -0.51% -0.15% 0.12% 0.49% -0.10% -0.35% -0.11%

The heat map shows percentage changes of major currencies against each other. The base currency is picked from the left column, while the quote currency is picked from the top row. For example, if you pick the British Pound from the left column and move along the horizontal line to the US Dollar, the percentage change displayed in the box will represent GBP (base)/USD (quote).

Growing concerns over the global fiscal health lifted borrowing costs of long-dated government bonds of major economies on Tuesday, opening the door for a flight to safety. Following Tuesday’s sharp increase, the yield on the 30-year UK gilt touched its highest level since 1998 at 5.75% early Wednesday before retreating. In turn, Pound Sterling found support and managed to erase its daily losses.

Reporting on the matter, “in Britain, Prime Minister Keir Starmer’s reshuffle of his top team of advisers on Monday renewed focus on fiscal challenges given the UK’s high levels of borrowing and slow growth,” Reuters reported. “A budget is due later in the year, prompting weeks of speculation about tax rises that could dampen the economy.”

In the second half of the day, the US Bureau of Labor Statistics will release the JOLTS Job Openings data for July. Markets expect the number of job openings to decline slightly to 7.4 million. A noticeable increase, with a print above 7.7 million, could boost the USD and weigh on GBP/USD. On the flip side, a disappointing reading close to 7 million is likely to have the opposite impact on the pair’s action. Nevertheless, investors could remain reluctant to bet on a steady recovery in Pound Sterling unless there is a sharp downward correction in long-dated gilt yields.

GBP/USD Technical Analysis

The Relative Strength Index (RSI) indicator on the 4-hour chart stays near 40 and GBP/USD continues to trade well below the 200-period Simple Moving Average (SMA), suggesting that the bearish bias remains intact despite the latest recovery attempt.

On the upside, GBP/USD faces a critical resistance area at 1.3440-1.3460, where the 200-period SMA, Fibonacci 50% retracement of the latest downtrend and the 100-day SMA are located. While this resistance area stays intact, buyers are likely to remain on the sidelines. On the downside, 1.3330 (static level) could be seen as the next support level before 1.3300 (Fibonacci 23.6% retracement).

If GBP/USD manages to clear 1.3440-1.3460, next resistance levels could be spotted at 1.3490-1.3500 (round level, 100-period SMA) and 1.3535 (Fibonacci 61.8% retracement).

UK gilt yields FAQs

UK Gilt Yields measure the annual return an investor can expect from holding UK government bonds, or Gilts. Like other bonds, Gilts pay interest to holders at regular intervals, the ‘coupon’, followed by the full value of the bond at maturity. The coupon is fixed but the Yield varies as it takes into account changes in the bond’s price. For example, a Gilt worth 100 Pounds Sterling might have a coupon of 5.0%. If the Gilt’s price were to fall to 98 Pounds, the coupon would still be 5.0%, but the Gilt Yield would rise to 5.102% to reflect the decline in price.

Many factors influence Gilt yields, but the main ones are interest rates, the strength of the British economy, the liquidity of the bond market and the value of the Pound Sterling. Rising inflation will generally weaken Gilt prices and lead to higher Gilt yields because Gilts are long-term investments susceptible to inflation, which erodes their value. Higher interest rates impact existing Gilt yields because newly-issued Gilts will carry a higher, more attractive coupon. Liquidity can be a risk when there is a lack of buyers or sellers due to panic or preference for riskier assets.

Probably the most important factor influencing the level of Gilt yields is interest rates. These are set by the Bank of England (BoE) to ensure price stability. Higher interest rates will raise yields and lower the price of Gilts because new Gilts issued will bear a higher, more attractive coupon, reducing demand for older Gilts, which will see a corresponding decline in price.

Inflation is a key factor affecting Gilt yields as it impacts the value of the principal received by the holder at the end of the term, as well as the relative value of the repayments. Higher inflation deteriorates the value of Gilts over time, reflected in a higher yield (lower price). The opposite is true of lower inflation. In rare cases of deflation, a Gilt may rise in price – represented by a negative yield.

Foreign holders of Gilts are exposed to exchange-rate risk since Gilts are denominated in Pound Sterling. If the currency strengthens investors will realize a higher return and vice versa if it weakens. In addition, Gilt yields are highly correlated to the Pound Sterling. This is because yields are a reflection of interest rates and interest rate expectations, a key driver of Pound Sterling. Higher interest rates, raise the coupon on newly-issued Gilts, attracting more global investors. Since they are priced in Pounds, this increases demand for Pound Sterling.

Source link

3 09, 2025

Suntory announces resignation of CEO amid illegal supplement investigation

By |2025-09-03T13:42:40+03:00September 3, 2025|Dietary Supplements News, News|0 Comments


Japanese beverage giant Suntory has announced that Takeshi Niinami, the company’s CEO, has resigned from his position amid a police investigation regarding his purchase of suspected illegal supplements.

Niinami – who served as Suntory’s chairman, chief executive officer and representative director – stepped down effective from 1 September 2025 following the matter, which Suntory called a ‘grave governance concern’.

In a statement published yesterday (2 September), Suntory said it had received a report from Niinami on 22 August confirming that an investigation was being conducted by the police regarding supplements allegedly purchased by him under the understanding that they were legal.

Suntory, which offers a range of supplements under its Health & Wellness business, emphasised that the supplements purchased were not Suntory products.

According to Tokyo news outlet Shimbun, the investigation surrounds supplements sent to Niinami’s home suspected to contain cannabis components. Shimbun reported that Niinami confirmed he had purchased CBD supplements from the US upon an acquaintance’s recommendation, after suffering from jet lag due to overseas business trips.

CBD (cannabidiol) is an active ingredient found in cannabis, and is legal in Japan as well as many other regions including the EU and UK. It is commonly used in dietary supplements and functional food and beverage products, believed to offer potential benefits such as relaxation, mood support and pain relief. The psychoactive component of cannabis, THC, is illegal in Japan – though it is legal in some US states.

At a press conference in Tokyo as representative director of the Japan Association of Corporate Executives, Niinami reportedly stated his innocence, commenting: “I neither possessed nor used the supplements, nor did I order their import into Japan. I believe I am innocent and have not broken any laws.”

In its statement, Suntory said that the determination of the supplements’ legality should be deferred to authorities – however, it stressed that ‘strict compliance with laws and regulations is fundamental,’ and that ‘exercising appropriate caution in purchasing supplements is an indispensable quality’.

Due to this, the company decided Niinami’s actions demonstrated a ‘lack of awareness’ regarding the supplements industry, rendering him unable to continue in his position.

Niinami told press at the briefing: “Although I am not aware of any violation of the law, I have decided to resign in accordance with the company’s judgment and to avoid causing trouble to employees and customers”.

Suntory has not appointed a replacement for the CEO role, with president and representative director Nobuhiro Torii continuing to lead the global business.


Source link

3 09, 2025

MATIC Price Prediction: Recovery to $0.45-$0.50 Expected Within 30 Days Despite Current Weakness

By |2025-09-03T13:40:11+03:00September 3, 2025|Crypto News, News|0 Comments


Felix Pinkston
Sep 03, 2025 05:41

MATIC price prediction targets $0.45-$0.50 recovery over next month as oversold conditions and key support at $0.35 create potential buying opportunity despite bearish momentum.


Polygon’s MATIC token is currently navigating through challenging technical territory at $0.38, presenting both risks and opportunities for traders. Our comprehensive MATIC price prediction analysis suggests a potential recovery phase could emerge over the coming weeks, despite current bearish momentum indicators.

MATIC Price Prediction Summary

MATIC short-term target (1 week): $0.42 (+10.5%) – targeting SMA 20 resistance • Polygon medium-term forecast (1 month): $0.45-$0.50 range – recovery to SMA 50 levels • Key level to break for bullish continuation: $0.43 (SMA 20 breakthrough needed) • Critical support if bearish: $0.35 (immediate support breakdown triggers deeper decline)

Recent Polygon Price Predictions from Analysts

The cryptocurrency prediction landscape for MATIC has been notably quiet over the past three days, with no significant analyst forecasts emerging. This silence often occurs during consolidation phases where the market awaits clear directional signals. The absence of fresh predictions creates an opportunity for technical analysis to guide our Polygon forecast, as fundamental sentiment appears neutral in the near term.

The lack of analyst coverage suggests that MATIC is currently in a “wait-and-see” mode among institutional observers, making technical indicators particularly crucial for our prediction framework.

MATIC Technical Analysis: Setting Up for Potential Reversal

Our Polygon technical analysis reveals a complex picture that supports a cautious bullish outlook over the medium term. The current RSI reading of 38.00 places MATIC in neutral territory but approaching oversold conditions, historically a precursor to bounce opportunities.

The MACD histogram at -0.0045 confirms bearish momentum remains intact, but the magnitude suggests weakening selling pressure rather than accelerating decline. This divergence between RSI positioning and MACD momentum often creates conditions for trend reversals.

MATIC’s position within the Bollinger Bands at 0.29 indicates the token is trading in the lower portion of its recent range, with the lower band at $0.31 providing crucial technical support. The 24-hour trading volume of $1,074,371 on Binance suggests moderate interest, sufficient to support a recovery move if buying emerges.

The moving average structure presents a clear roadmap for recovery, with the 7-day SMA at $0.37 already below current price, suggesting short-term momentum may be shifting. The next key MATIC price target sits at the 20-day SMA of $0.43, representing a 13% upside from current levels.

Polygon Price Targets: Bull and Bear Scenarios

Bullish Case for MATIC

Our optimistic MATIC price prediction centers on a recovery to the $0.45-$0.50 range within 30 days, representing a 18-32% upside potential. This scenario requires MATIC to first reclaim the $0.43 SMA 20 level, which would signal the beginning of a technical recovery.

The pathway to $0.50 involves breaking through the SMA 50 at $0.45, a level that has historically acted as significant resistance. Success at this level could trigger momentum-driven buying, potentially pushing MATIC toward the Bollinger Band upper boundary at $0.56.

Volume confirmation above 1.5 million daily on Binance would support this bullish Polygon forecast, indicating genuine buying interest rather than short-covering rallies.

Bearish Risk for Polygon

The downside scenario becomes active if MATIC breaks below the immediate support at $0.35, which would trigger our bearish MATIC price prediction toward the strong support zone at $0.33. This represents a 13% decline from current levels and would likely coincide with RSI dropping into oversold territory below 30.

A break of $0.33 support would expose MATIC to a test of yearly lows near $0.31, aligning with the Bollinger Band lower boundary. This scenario carries a 18% downside risk and would require significant market stress or MATIC-specific negative developments to materialize.

Should You Buy MATIC Now? Entry Strategy

Based on our Polygon technical analysis, the current risk-reward profile suggests a cautious accumulation strategy rather than aggressive buying. The optimal entry strategy involves scaling into positions between $0.35-$0.38, with the strongest conviction purchases occurring near the $0.35 support level.

Risk management becomes crucial in this environment. Conservative traders should implement stop-losses below $0.33, limiting downside exposure to approximately 13% from current levels. More aggressive traders might consider wider stops below $0.31, accepting higher risk for potentially greater rewards.

Position sizing should reflect the medium confidence level of this prediction, suggesting allocation of no more than 2-3% of portfolio value to MATIC positions until clearer technical confirmation emerges.

The buy or sell MATIC decision ultimately depends on individual risk tolerance, but current technical conditions favor patient accumulation over immediate selling, particularly for investors with 30-60 day time horizons.

MATIC Price Prediction Conclusion

Our comprehensive analysis supports a medium-confidence MATIC price prediction targeting $0.45-$0.50 over the next 30 days, representing 18-32% upside potential from current levels. This Polygon forecast relies on MATIC maintaining support above $0.35 and subsequently breaking through SMA 20 resistance at $0.43.

Key technical indicators to monitor include RSI movement toward oversold levels below 30 (bullish divergence signal) and MACD histogram progression toward positive territory. Volume expansion above 1.5 million daily would provide crucial confirmation of our bullish thesis.

The prediction timeline spans 2-4 weeks for initial targets around $0.43-$0.45, with extension to $0.50 possible if momentum sustains through month-end. Failure to hold $0.35 support would invalidate this forecast and trigger reassessment toward lower targets near $0.31-$0.33.

Image source: Shutterstock


Source link

3 09, 2025

Why investors are betting big on DeFi’s next breakout

By |2025-09-03T11:51:39+03:00September 3, 2025|News, NFT News|0 Comments


Mutuum Finance (MUTM) has surged 300% from its initial presale price of $0.01 to $0.035 in Phase 6, attracting more than $15.2 million in capital and securing 15,880+ holders [1]. This rapid growth is driving investor interest as the token prepares for a price increase to $0.04 in the next phase and a projected launch price of $0.06, offering potential gains of up to 500% for early buyers [2]. The project’s presale momentum is fueled by a capped token supply and the introduction of a two-way lending model, which combines peer-to-peer and peer-to-contract mechanisms to enhance capital efficiency and user accessibility [3].

The lending innovation in Mutuum Finance is further supported by its integration of a Layer 2 solution, which reduces transaction costs and increases speed, making the platform more scalable and user-friendly [1]. Additionally, the project has launched an overcollateralized stablecoin system, designed to maintain price stability by operating on a mint-and-burn framework [2]. These features position MUTM as a competitive player in the decentralized finance (DeFi) sector, where utility-driven models are becoming increasingly attractive to investors.

Security remains a key focus for Mutuum Finance. The project recently completed a CertiK audit with a 95.00 score and no reported vulnerabilities, ensuring a robust foundation for its platform [1]. To further strengthen its security posture, the team has also launched a $50,000 Bug Bounty Program, incentivizing the community to identify and report potential weaknesses [3]. These efforts have contributed to the trust and confidence seen in the growing number of holders and presale participants.

Community growth has also been a significant driver of MUTM’s momentum. The project has introduced a $100,000 giveaway, distributing $10,000 worth of MUTM to 10 winners, which has further amplified enthusiasm around the token [2]. Additionally, the launch of a leaderboard featuring the top 50 token holders encourages long-term commitment by offering bonus token rewards [1]. These initiatives, combined with the project’s strong presale performance, underscore MUTM’s potential to generate substantial returns for early investors.

Price predictions for MUTM suggest the token could surpass $0.50 by 2025, a target supported by historical parallels with Dogecoin and Ripple (XRP). For instance, Dogecoin rose from $0.0025 in 2020 to $0.74 in May 2021 within 18 months, while XRP saw an over 60,000% return from $0.006 in 2017 to $3.84 by 2017’s end [2]. These examples illustrate how strong community growth and utility-driven models can lead to explosive returns in the crypto market.

Comparisons between MUTM and Ethereum (ETH) highlight the different investment profiles of these assets. While Ethereum remains a foundational asset with a current price above $4,300, its growth potential is constrained by its large market capitalization and limited upside for exponential returns [3]. In contrast, Mutuum Finance’s low entry price and dual-lending infrastructure make it a compelling option for investors seeking higher ROI. At launch, MUTM is projected to deliver a 750% return from its presale price, with longer-term predictions suggesting the token could reach $1 by 2026 [3]. This potential growth aligns with MUTM’s structured DeFi use cases, including mtToken staking and the development of a USD-pegged stablecoin [1].

As the DeFi market continues to evolve, projects like Mutuum Finance are gaining attention for their innovative approaches to lending, borrowing, and stablecoin issuance [4]. The combination of security, scalability, and community-driven initiatives positions MUTM as a strong contender for long-term value creation, particularly in comparison to higher-priced tokens where growth is more constrained. With its presale currently in Phase 6, the opportunity to secure MUTM at its current price is rapidly closing, making it one of the top cryptos to watch in 2025.

Source:

[1] Price Prediction If Mutuum Finance Breaks $0.50 In 2025 (https://www.mitrade.com/insights/news/live-news/article-3-1086200-20250902)

[2] Mutuum Finance (MUTM): The New Crypto Below $0.05 … (https://www.mitrade.com/insights/news/live-news/article-3-1084643-20250901)

[3] MUTM vs. ETH: Which crypto to buy today for long-term ROI? (https://invezz.com/news/2025/09/01/mutm-vs-eth-which-crypto-to-buy-today-for-long-term-roi/)

[4] Ethereum (ETH) Price Set to Touch $8500 in 2025, But … (https://www.mitrade.com/insights/news/live-news/article-3-1083225-20250901)


Source link

3 09, 2025

The CADCHF keeps the positive attempts– Forecast today – 3-9-2025

By |2025-09-03T11:43:53+03:00September 3, 2025|Forex News, News|0 Comments


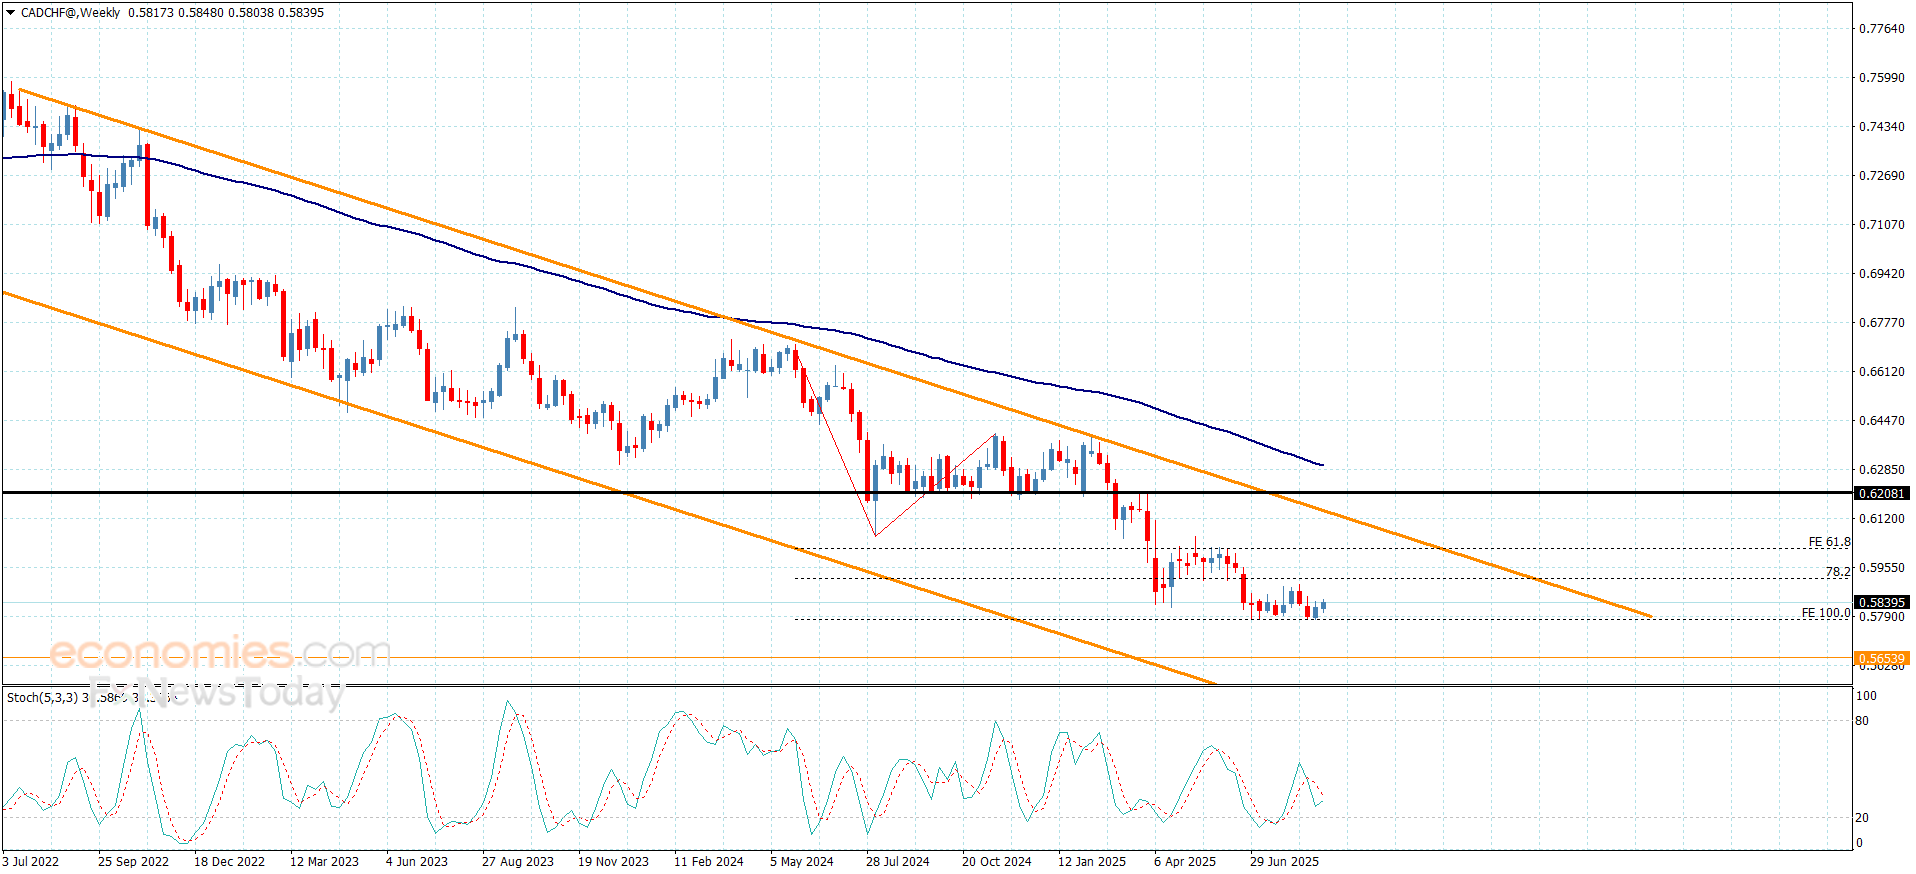
Despite the neediness of the CADCHF to the positive momentum in the last period, but it its positive stability above the support at 0.5780 supports the chances of activating the suggested bullish correctional attempts, to fluctuate near 0.5830.


By the above image, we notice stochastic attempt to provide positive momentum by its stability above 20 level, to increase the chances for targeting the positive stations by its rally towards 0.5910, surpassing it might succeed in renewing the pressure on the barrier at 0.6020 level.


The expected trading range for today is between 0.5800 and 0.5910


Trend forecast: Bullish


Source link

3 09, 2025

Testing Key 148.5 Resistance (video)

By |2025-09-03T11:42:43+03:00September 3, 2025|Forex News, News|0 Comments

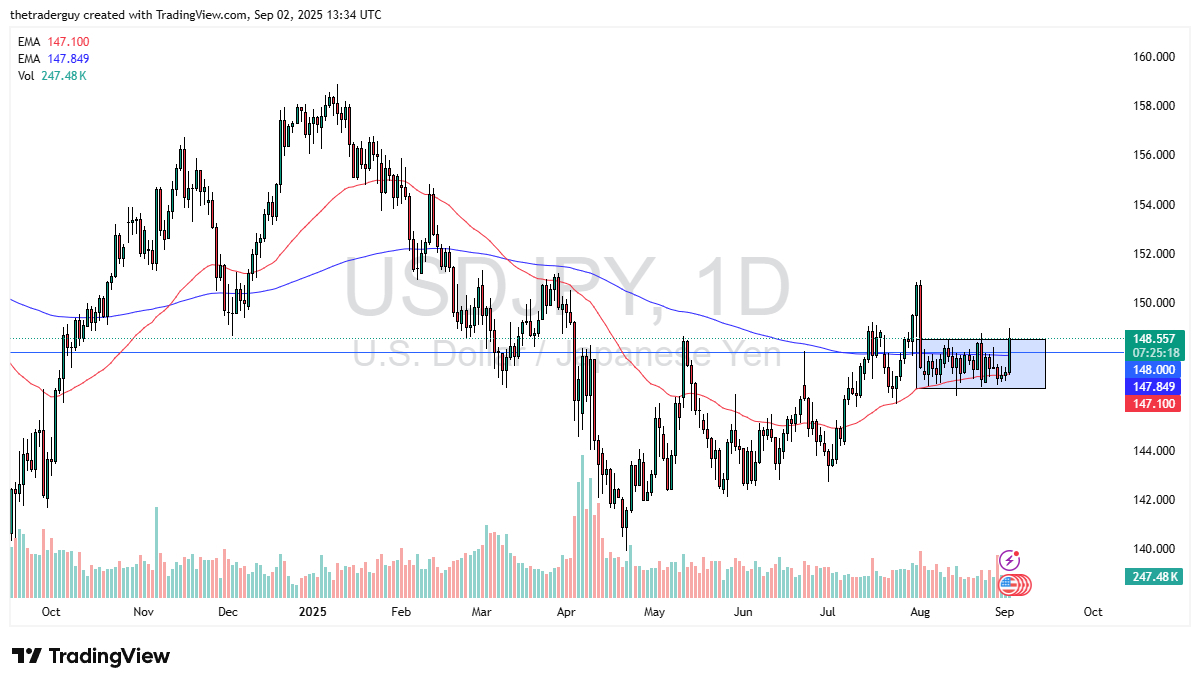
  • The US dollar has rallied quite nicely against the Japanese yen in early trading on Tuesday as we are testing the crucial 148.5 yen level an area that has been a bit of a barrier for some time now.
  • Ultimately, this is a market that if we can break above here, we could go looking to the 151 yen level but I think it’s going to be a bit difficult to do it all in one shot, mainly due to the fact that we do get the employment numbers later in the week on Friday, and that will obviously have a major influence on what happens next with the US dollar and risk appetite in general.
  • It’s worth noting that we have broken above the 200-day EMA as well, so that’s a good sign, but both moving averages, the 50-day EMA and the 200-day EMA, are flat at the moment. So that doesn’t necessarily suggest that we are in any type of trend.

Choppy Week Ahead?

I anticipate that most of this week will probably be choppy and somewhat sideways as we wait for that important jobs figure. The real question at this point in time is will the interest rate differential continue to favor the US dollar over the longer term, which I think it will. And that does give a little bit of credence to the idea of a positive currency pair here.

Whether or not we can really come to grips with that between now and the jobs number is a completely different situation. But I think you’ve got a scenario where traders will have to watch this.

Maybe more of a buy on the dip mentality is the way to go. That’s the way I’ve been playing this pair for a couple of weeks now. After that nasty sell-off, and then we just went sideways. Sometimes it’s all about where a pair won’t go.

And at this point, it doesn’t look like it wants to go lower. So, I remain bullish, but I also keep my expectations a little tempered over the next couple of days.

Want to trade our USD/JPY forex analysis and predictions? Here’s a list of forex brokers in Japan to check out.

Christopher Lewis has been trading Forex and has over 20 years experience in financial markets. Chris has been a regular contributor to Daily Forex since the early days of the site. He writes about Forex for several online publications, including FX Empire, Investing.com, and his own site, aptly named The Trader Guy. Chris favours technical analysis methods to identify his trades and likes to trade equity indices and commodities as well as Forex. He favours a longer-term trading style, and his trades often last for days or weeks.

Source link

3 09, 2025

Global Tea Market Size, Share, Growth And Trends Report

By |2025-09-03T11:41:40+03:00September 3, 2025|Dietary Supplements News, News|0 Comments


Tea Market

Tea Market Size and Outlook 2025 to 2033

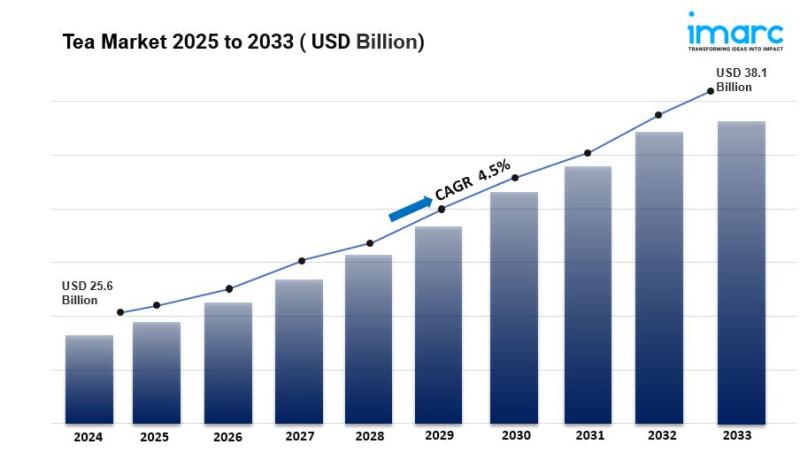
The global tea market size was valued at USD 25.6 Billion in 2024. Looking forward, IMARC Group estimates the market to reach USD 38.1 Billion by 2033, exhibiting a CAGR of 4.5% during 2025-2033. China currently dominates the market, holding a significant market share of over 14.3% in 2024. The market is experiencing steady growth driven by rising health consciousness among consumers, increasing demand for specialty and organic teas, growing popularity of ready-to-drink (RTD) tea products, and expanding global tea culture across diverse demographics.

Key Stats for Tea Market:

• Tea Market Value (2024): USD 25.6 Billion

• Tea Market Value (2033): USD 38.1 Billion

• Tea Market Forecast CAGR: 4.5%

• Leading Segment in Tea Market in 2024: Black Tea (38.5%)

• Key Regions in Tea Market: China, India, Kenya, Sri Lanka, Turkey, Vietnam, Others

• Top companies in Tea Market: Associated British Foods PLC, Barry’s Tea, Bigelow Tea, Caraway Tea, Dabur Ltd, Dilmah Ceylon Tea Company PLC, LIPTON Teas and Infusions B.V., TAETEA Group Co., Ltd, Tata Consumer Products Limited (Tata Group), The Republic of Tea, Unilever.

Request Sample URL: https://www.imarcgroup.com/tea-market/requestsample

Why is the Tea Market Growing?

The tea market is experiencing a remarkable transformation as health consciousness reaches unprecedented levels globally. According to a comprehensive survey by Aditya Birla Health Insurance, 84% of people report increased health awareness following the pandemic. This fundamental shift in consumer mindset is driving people away from sugary beverages toward tea, which offers natural antioxidants, polyphenols, and catechins associated with reduced risk of heart disease, stroke, and certain cancers.

What’s particularly fascinating is the demographic expansion of tea consumption. In the United States alone, over 159 million Americans drink tea daily, according to Census data. This represents a massive cultural shift where tea is no longer just a traditional beverage but a lifestyle choice embraced by health-conscious millennials and Gen Z consumers seeking functional beverages that deliver both taste and wellness benefits.

The ready-to-drink tea revolution is reshaping how people consume tea. Modern consumers with hectic lifestyles are gravitating toward RTD tea products that maintain health advantages while offering convenience. These products come in diverse flavors and are often enhanced with vitamins and minerals, making them particularly appealing to health-aware shoppers who want nutrition on-the-go.

Innovation in tea brewing technology and flavor profiles is attracting entirely new demographics to tea consumption. From cold brews to artisan blends, companies are reimagining how tea is prepared and consumed. Lipton’s recent launch of five new green tea varieties in the US-featuring Signature Blend, Decaf, Lemon, Peach, and Honey Ginger-exemplifies this innovation trend. These products target Gen Z consumers through their “2 Cups to Goodness” initiative, supported by a comprehensive 36-week marketing campaign including digital content and influencer collaborations.

Global production capabilities are expanding remarkably. According to the Food and Agriculture Organization, tea production surged from 4.3 million tons in 2008 to 6.3 million tons in 2020, cultivated across 5 million hectares worldwide. This production increase, combined with climate-resilient cultivars and precision agriculture using IoT and GPS sensors, ensures stable supply chains while meeting growing global demand.

The demographic momentum is undeniable. The United Nations projects world population growth to 9.7 billion by 2050, with urbanization trends favoring convenient, health-conscious products like tea. The expanding middle class in developing nations is particularly significant, as these new consumers embrace tea drinking for its health benefits and social significance.

AI Impact on the Tea Market:

Artificial intelligence is revolutionizing the tea industry by transforming traditional practices that have remained unchanged for centuries. AI integration spans the entire tea value chain, from precision agriculture in cultivation to sophisticated quality control in processing, creating unprecedented opportunities for optimization and innovation.

Smart cultivation technologies are enabling tea growers to monitor vast plantations with remarkable precision. AI-powered systems analyze soil health, moisture levels, pest risks, and weather patterns to optimize growing conditions. Machine learning algorithms process data from IoT sensors and satellite imagery to predict optimal harvesting times, identify disease patterns before they become visible, and determine precise nutrient requirements for different tea varieties.

Quality control and processing have been transformed through AI-powered vision systems that can grade tea leaves with precision exceeding human capabilities. Computer vision technology evaluates color, texture, and leaf integrity to ensure consistent product quality. AI algorithms analyze the complex chemical compositions of tea leaves to optimize processing parameters for maximum antioxidant retention and flavor development.

Supply chain optimization through AI is solving logistics challenges that have plagued the tea industry. Predictive analytics help companies forecast demand patterns across different tea types and geographic markets, reducing waste and ensuring product freshness. AI-powered inventory management systems track tea from garden to cup, maintaining quality standards while optimizing distribution efficiency.

Consumer experience enhancement through AI is creating personalized tea recommendations based on individual taste profiles, health goals, and consumption patterns. Machine learning algorithms analyze customer preferences to suggest new products and optimize flavor profiles for different market segments.

The AI food and beverages market is projected to reach USD 56.47 billion by 2029, with tea industry applications representing a significant growth segment. Advanced sensor technologies integrated with AI are enabling real-time monitoring of crucial quality parameters throughout the production process, ensuring food safety and premium quality standards.

Buy Now: https://www.imarcgroup.com/checkout?id=635&method=1670

Segmental Analysis:

Analysis by Product Type:

• Green Tea

• Black Tea

• Oolong Tea

• Others

Black tea dominates the market with 38.5% share in 2024, driven by its bold flavor profile, higher caffeine content compared to other varieties, and deep cultural significance across many global regions. The segment benefits from versatile consumption options-hot or cold-and availability in multiple formats including loose leaves, tea bags, and instant powder, providing convenience and choice for consumers worldwide.

Analysis by Packaging:

• Plastic Containers

• Loose Tea

• Paper Boards

• Aluminium Tin

• Tea Bags

• Others

Paper boards exhibit clear market dominance due to their economical and environmentally favorable qualities. These recyclable and biodegradable materials align with growing consumer demand for sustainable packaging solutions, while effectively maintaining tea freshness, aroma, and quality. Superior printability enhances brand visibility through attractive designs that capture consumer attention on retail shelves.

Analysis by Distribution Channel:

• Supermarkets/Hypermarkets

• Specialty Stores

• Convenience Stores

• Online

• Others

Supermarkets and hypermarkets lead with 32.8% market share in 2024, offering extensive product variety and convenient one-stop shopping experiences. According to the Government of Canada, tea retail sales in the U.S. reached USD 2.9 billion in 2021, with projections to rise to USD 3.4 billion by 2026, while organic tea sales hit USD 0.4 billion and are expected to grow to USD 0.5 billion by 2026.

Analysis by Application:

• Residential

• Commercial

Residential represents the largest segment with 62.0% market share in 2024, reflecting growing household tea consumption globally. This dominance stems from tea’s deep-rooted cultural significance, increasing preference for specialty teas among consumers seeking diverse flavors and health benefits, and the trend toward health consciousness positioning tea as a staple in daily routines.

Analysis of Tea Market by Regions

• China

• India

• Kenya

• Sri Lanka

• Turkey

• Vietnam

• Others

China leads the market with 14.3% share, significantly influencing global supply and demand through extensive production capabilities and rich cultural heritage. According to Worldmetrics, China produces about 40% of the world’s total tea, making it the undisputed leader in global tea production. The country’s dominance is reinforced by diverse native tea varieties and deeply ingrained tea-drinking culture.

What are the Drivers, Restraints, and Key Trends of the Tea Market?

Market Drivers:

Health awareness transformation is the primary catalyst driving tea market expansion. Consumers increasingly recognize tea’s antioxidant properties, with green tea containing catechins and polyphenols linked to reduced risk of chronic diseases. The shift from sugary beverages to healthier alternatives positions tea as a preferred choice among wellness-focused demographics.

Growing global population creates expanding consumer base for tea products. UN projections show world population reaching 9.7 billion by 2050, with urbanization trends favoring convenient, health-conscious products. The expanding middle class in developing nations particularly drives demand as these consumers embrace tea drinking for health benefits and social significance.

Innovation in product development and flavors attracts new consumer segments. Companies are introducing specialty blends, functional teas, and RTD products that cater to modern lifestyles. Advanced brewing technologies and packaging innovations preserve quality while enhancing convenience, appealing to busy consumers seeking premium experiences.

E-commerce expansion democratizes access to specialty and premium teas globally. Online platforms enable consumers worldwide to access previously region-limited products, expanding market reach for premium and niche tea varieties while supporting direct-to-consumer business models.

Market Restraints:

Climate change impacts threaten traditional tea-growing regions with unpredictable weather patterns affecting crop yields and quality. Temperature fluctuations, irregular rainfall, and extreme weather events create supply chain uncertainties that can impact pricing and availability.

Price volatility stemming from weather conditions, geopolitical factors, and supply chain disruptions affects market stability. Premium tea segments are particularly sensitive to cost fluctuations that can limit accessibility for price-conscious consumers.

Competition from alternative beverages including coffee, energy drinks, and functional beverages creates market pressure. The beverage industry’s competitive landscape requires continuous innovation and marketing investment to maintain market share.

Quality standardization challenges across different regions and producers create consumer confusion and trust issues. Varying processing methods and quality controls can result in inconsistent product experiences that impact brand loyalty.

Market Key Trends:

Precision agriculture and AI-powered farming are revolutionizing tea cultivation. Smart irrigation systems, drone monitoring, and predictive analytics optimize yields while reducing resource consumption. IoT sensors and GPS technology enable precise nutrient delivery and water management, improving both production efficiency and environmental sustainability.

Sustainable and organic tea production gains momentum as consumers prioritize environmental responsibility. Ethical sourcing, eco-friendly packaging, and organic certifications become essential differentiators. European consumers drink up to 2 kg of tea annually, with growing emphasis on sustainably sourced products.

Functional tea innovations address specific health and wellness needs. Companies develop blends targeting immunity enhancement, stress reduction, detoxification, and cognitive function. These specialized products command premium pricing while meeting consumer demand for targeted health benefits.

Ready-to-drink tea market expansion caters to on-the-go lifestyles. RTD products now account for significant market segments, particularly among younger consumers seeking convenience without compromising health benefits. Innovation in flavors, packaging, and nutritional enhancement drives this segment’s growth.

Leading Players of Tea Market:

According to IMARC Group’s latest analysis, prominent companies shaping the global Tea landscape include:

• Associated British Foods PLC

• Barry’s Tea

• Bigelow Tea

• Caraway Tea

• Dabur Ltd

• Dilmah Ceylon Tea Company PLC

• LIPTON Teas and Infusions B.V.

• TAETEA Group Co., Ltd

• Tata Consumer Products Limited (Tata Group)

• The Republic of Tea

• Unilever

These leading providers are expanding their footprint through product diversification, sustainable sourcing practices, innovative packaging solutions, and strategic partnerships with retail and hospitality sectors to meet growing consumer demand for premium, organic, and specialty tea products across global markets.

Ask An Analyst: https://www.imarcgroup.com/request?type=report&id=635&flag=C

Key Developments in Tea Market:

• January 2024: Chai Sutta Bar, a prominent tea chain, introduced its new premium tea brand Maatea through a press release in New Delhi, India. The brand aims to enhance the tea-drinking experience by offering natural, premium teas that avoid additives and artificial colors commonly found in other brands, representing the industry’s movement toward cleaner, more authentic products.

• 2024: Lipton unveiled a comprehensive collection of green teas in the US market, featuring five distinct varieties: Signature Blend, Decaf, Lemon, Peach, and Honey Ginger, all rich in flavonoids. This launch targets Gen Z consumers through the “2 Cups to Goodness” initiative, supported by a 36-week integrated marketing campaign including digital content and influencer collaborations.

• November 2024: AI integration in tea processing reached new sophistication levels, with advanced sensor technologies enabling real-time monitoring of crucial quality parameters throughout production. These systems ensure food safety and premium quality standards while optimizing processing efficiency.

• September 2024: Precision agriculture adoption accelerated significantly across major tea-producing regions, with IoT sensors and GPS technology enabling precise nutrient delivery and water management. These innovations improve production efficiency while reducing environmental impact.

• July 2024: Sustainable packaging innovations gained momentum as tea companies responded to consumer demand for eco-friendly solutions. Paper board packaging dominance reflects growing environmental consciousness, with recyclable and biodegradable materials becoming industry standards.

If you require any specific information that is not covered currently within the scope of the report, we will provide the same as a part of the customization.

About Us:

IMARC Group is a global management consulting firm that helps the world’s most ambitious changemakers to create a lasting impact. The company provides a comprehensive suite of market entry and expansion services.

IMARC offerings include thorough market assessment, feasibility studies, company incorporation assistance, factory setup support, regulatory approvals and licensing navigation, branding, marketing and sales strategies, competitive landscape and benchmarking analyses, pricing and cost research, and procurement research.

Contact US:

IMARC Group

134 N 4th St. Brooklyn, NY 11249, USA

Email: sales@imarcgroup.com

Tel No:(D) +91 120 433 0800

United States: +1-201971-6302

This release was published on openPR.


Source link

3 09, 2025

Dogecoin Price Prediction: DOGE Heads Into September Under $0.15, While Remittix Shatters Records in Crypto Space

By |2025-09-03T11:39:35+03:00September 3, 2025|Crypto News, News|0 Comments

Remittix is emerging as a revolutionary DeFi project designed to solve the $19 trillion global payments problem by enabling instant crypto-to-fiat bank transfers in over 30 countries. This isn’t hype, it’s a crypto built to deliver tangible results.

Why Investors Are Flocking to Remittix

  • Real-Time FX Conversion: Transparent rates make cross-border transactions instant and seamless.

  • Security Assured: CertiK audit guarantees top-tier trust.

  • Low Fee Model: Optimized for cost-efficient transactions.

  • Institutional Listings: BitMart and LBank listings increase market visibility and liquidity.

  • $250,000 Giveaway: Incentivizes early holders with tangible rewards and community engagement.

Having sold over 640 million tokens and raised $23.3 million, Remittix demonstrates strong demand and growing investor confidence. Its ecosystem combines real-world utility, robust infrastructure, and strategic market expansion, setting the stage for potential exponential returns.

Don’t Miss the Next Big Crypto Opportunity

With Dogecoin price prediction showing a shaky September and market uncertainty looming, Remittix offers a rare window to secure early-stage participation in a utility-driven crypto with global relevance. The Q3 wallet launch, institutional listings, and active incentives create urgency; early investors are positioning themselves for outsized gains before broader adoption surges.

Missing this moment could mean waiting on the sidelines while one of 2025’s fastest-growing crypto projects reshapes DeFi and global remittances.

Discover the future of PayFi with Remittix by checking out their project here:

Website: https://remittix.io/

Socials: https://linktr.ee/remittix

$250,000 Giveaway: https://gleam.io/competitions/nz84L-250000-remittix-giveaway

Source link

Go to Top