About Editorial team of BIPNs

Main team of content of bipns.com. Any type of content should be approved by us.
26 08, 2025

Dogecoin Price Consolidates Amid Key Support and Resistance Levels as Bearish Pressure Mounts

By |2025-08-26T05:39:04+03:00August 26, 2025|Crypto News, News|0 Comments

Dogecoin’s price movement this week has drawn attention from traders and analysts who are closely watching three key levels that could determine the altcoin’s short-term direction. Following a 5.81% drop on August 25, Dogecoin has been consolidating within a defined range, with technical indicators such as the RSI and On-Balance Volume (OBV) signaling increasing bearish pressure [1]. The broader crypto market also weakened after Bitcoin fell below $112k, triggering a 4% drop in altcoin market capitalization [1].

At the time of writing, Dogecoin hovered near the mid-range level of $0.196, struggling to maintain a foothold above the $0.224 level, which serves as the 75% support within its long-term range [1]. A breakdown below this threshold could push prices toward the $0.21 support zone, which has previously acted as a demand cluster. Analysts noted that this area was tested last week before a failed rally at $0.241 [1].

The 2-week liquidity heatmap further highlighted potential turning points. The $0.24 level, once a strong magnetic zone, was swept, indicating a bearish reversal [1]. The next notable cluster is near $0.207, slightly below the bullish order block on the 1-hour chart, suggesting a deeper decline is likely if bears maintain control [1].

If DOGE fails to stabilize above $0.21, the next key support level comes into play at $0.19, according to pattern analysis from AInvest and The Tradable [1]. A successful hold above $0.21 could trigger a rebound toward $0.25, a key resistance level that represents both the upper boundary of a symmetrical triangle and a psychological price point. A confirmed breakout above $0.25, supported by strong volume and momentum, could see prices move toward $0.2658 and eventually $0.3077 [1].

On the downside, $0.165 is highlighted as the next critical support level if the market corrects below $0.22. This area is seen as a potential bounce zone where liquidity may support a recovery move [2]. Traders are also monitoring for a potential test of this level if further weakness persists.

While aggressive bullish scenarios have been floated, such as a move toward $0.50, these forecasts require strong follow-through volume and a broader market upturn [3]. More conservative projections, such as those from Bitget, suggest a modest 0.014% daily growth rate, projecting DOGE to reach $0.2318 by August 29, 2025 [5]. Meanwhile, speculative models from Mitrade have mentioned the potential for 10x gains during a bull run, though these are not supported by current fundamentals [6].

Dogecoin closed at $0.232 on August 3, 2025, underperforming the broader crypto market, which saw a 0.9% decline [7]. This underscores the influence of wider market conditions on DOGE’s price action, despite some short-term bullish patterns.

Source: [1] https://ambcrypto.com/dogecoin-price-prediction-3-key-levels-to-watch-for-this-week/ [2] https://cryptonews.com/news/dogecoin-price-prediction-doge-director-reveals-secret-protocol-test-doge-going-to-10/ [3] https://www.mitrade.com/insights/news/live-news/article-3-1064276-20250824 [4] https://thetradable.com/crypto/doge-coin-price-symmetrical-triangle-signals-a-breakout-ahead-ig–a [5] https://www.bitget.com/price/dogecoin/price-prediction [6] https://www.mitrade.com/insights/news/live-news/article-3-1068079-20250826 [7] https://coinmarketcap.com/cmc-ai/dogecoin/price-analysis/


Source link

26 08, 2025

XAU/USD trades cautiously near $3,330, Fed Powell’s speech in focus

By |2025-08-26T03:50:03+03:00August 26, 2025|Forex News, News|0 Comments


  • Gold price faces selling pressure ahead of Fed Powell’s speech at the Jackson Hole Symposium.
  • Fed’s Powell is expected to reiterate a “wait and see” approach on the monetary policy outlook.
  • Traders trim Fed dovish bets ahead of Jerome Powell’s speech.

Gold price (XAU/USD) trades 0.3% lower around $3,330.00 during the European trading session on Friday. The precious metal faces selling pressure as market experts believe that Federal Reserve (Fed) Chair Jerome Powell could reiterate his argument that a “wait and see” approach on the interest rate outlook is appropriate in the current environment in his speech at the Jackson Hole (JH) Symposium at 14:00 GMT.

“The most likely scenario is that Powell won’t provide any definitive clues on what the Fed will do next ahead of critical non-farm payrolls and CPI data,” analysts at Commonwealth Bank said.

The Federal Open Market Committee (FOMC) minutes of the July monetary policy meeting also showed on Wednesday that a majority of members, including Jerome Powell, underscored the need for time to gain absolute clarity on the “magnitude and persistence of higher tariffs’ effects on inflation”.

Ahead of Fed Powell’s speech, traders have also trimmed bets supporting interest rate cuts by the Fed in the September meeting. According to the CME FedWatch tool, the probability of the Fed cutting interest rates in September has eased to 73.3% from 85.4% seen a week ago.

The maintenance of interest rates at higher levels by the Fed bodes poorly for non-yielding assets, such as Gold.

Traders raised Fed dovish bets earlier this month after the release of the Nonfarm Payrolls (NFP) report for July, which showed a significant revision in newly employed workers in May and June on the downside.

On the global front, growing uncertainty over peace between Russia and Ukraine is expected to continue supporting the Gold price. On Thursday, Moscow launched a mass attack on targets in Ukraine. This came at a time when US President Donald Trump is persuading leaders from both nations to end the three-year-long war.

Gold technical analysis

Gold price trades in a Symmetrical Triangle, which indicates a sharp volatility contraction. The upper border of the above-mentioned chart pattern is plotted from the April 22 high around $3,500, while the downward border is placed from the May 15 low near $3,180.86.

The yellow metal wobbles near the 20-day Exponential Moving Average (EMA) around $3,351.00, indicating a sideways trend.

The 14-day Relative Strength Index (RSI) oscillates inside the 40.00-60.00 range, suggesting indecisiveness among market participants.

Looking down, the Gold price would fall towards the round-level support of $3,200 and the May 15 low at $3,121, if it breaks below the May 29 low of $3,245.

Alternatively, the Gold price will enter an uncharted territory if it breaks above the psychological level of $3,500 decisively. Potential resistances would be $3,550 and $3,600.

Gold daily chart

Gold FAQs

Gold has played a key role in human’s history as it has been widely used as a store of value and medium of exchange. Currently, apart from its shine and usage for jewelry, the precious metal is widely seen as a safe-haven asset, meaning that it is considered a good investment during turbulent times. Gold is also widely seen as a hedge against inflation and against depreciating currencies as it doesn’t rely on any specific issuer or government.

Central banks are the biggest Gold holders. In their aim to support their currencies in turbulent times, central banks tend to diversify their reserves and buy Gold to improve the perceived strength of the economy and the currency. High Gold reserves can be a source of trust for a country’s solvency. Central banks added 1,136 tonnes of Gold worth around $70 billion to their reserves in 2022, according to data from the World Gold Council. This is the highest yearly purchase since records began. Central banks from emerging economies such as China, India and Turkey are quickly increasing their Gold reserves.

Gold has an inverse correlation with the US Dollar and US Treasuries, which are both major reserve and safe-haven assets. When the Dollar depreciates, Gold tends to rise, enabling investors and central banks to diversify their assets in turbulent times. Gold is also inversely correlated with risk assets. A rally in the stock market tends to weaken Gold price, while sell-offs in riskier markets tend to favor the precious metal.

The price can move due to a wide range of factors. Geopolitical instability or fears of a deep recession can quickly make Gold price escalate due to its safe-haven status. As a yield-less asset, Gold tends to rise with lower interest rates, while higher cost of money usually weighs down on the yellow metal. Still, most moves depend on how the US Dollar (USD) behaves as the asset is priced in dollars (XAU/USD). A strong Dollar tends to keep the price of Gold controlled, whereas a weaker Dollar is likely to push Gold prices up.


Source link

26 08, 2025

UCLA Health dietitian discusses matcha amid global shortage

By |2025-08-26T03:39:58+03:00August 26, 2025|Dietary Supplements News, News|0 Comments


A global shortage of matcha has led to rising prices, empty shelves and a search for alternatives to the specialized tea. 

Matcha, a finely ground powder made from specially grown and processed tencha leaves, has long been prized in Japanese culture for its role in traditional tea ceremonies and its beneficial health impacts.

Those benefits, and its gentler caffeine profile compared to coffee, have in recent years made matcha popular around the world. Demand for premium Japanese matcha has particularly grown in North America and Europe, where it is used in lattes, smoothies and baked goods. 

Currently, that demand is outpacing supply, leading to rising costs and limited overall availability. 

For answers to commonly asked questions about matcha, its health benefits, risks and alternatives, we turned to Yasi Ansari, MS, RDN, CSSD, senior dietitian at UCLA Health Santa Monica.

Q: What is unique about matcha?

Ansari: Creating high-quality matcha requires careful cultivation, including shading tea plants before harvest, which limits how much can be produced each year.

Unlike steeped tea, where the leaves are discarded, matcha involves consuming the whole leaf in powdered form, which concentrates its nutrients and antioxidants.

Q: How does matcha nutritionally compare to other hot drinks like non-matcha green tea, black tea or coffee?

Ansari: Coffee contains the most caffeine, followed by matcha and then regular green tea. Matcha is unique because it contains L-theanine, an amino acid that slows caffeine absorption. This often means fewer jitters and less upset stomach compared to coffee.

Matcha contains four main antioxidants known as catechins: EC, ECG, EGC, and EGCG. Of these, EGCG is the most powerful.

Studies show matcha provides up to 137 times more EGCG than standard green tea. This is one reason matcha is often highlighted for its potential health benefits.

Q: What does research say about the health benefits?

Ansari: Studies show matcha may support cardiovascular health, brain function and possibly metabolism. The caffeine + L-theanine combination has been shown to help improve focus and attention.

Traditional uses of green tea include aiding digestion, regulating blood sugar and supporting mental well-being. Some small studies suggest the L-theanine in matcha may help with stress management and sleep quality, and on its own, L-theanine is linked to better sleep and relaxation.

However, when it comes to sports nutrition, a three-week study of green tea extract found no significant improvement in performance among endurance-trained men. 

More research is needed before we can say matcha directly benefits exercise or energy metabolism.

Q: Are there risks to drinking matcha regularly?

Ansari: The main consideration is caffeine. Consuming too much caffeine can lead to high blood pressure, anxiety, sleep disturbances, nausea or headaches.

One cup of matcha (about 1 teaspoon of powder) contains roughly 60–70 mg of caffeine. For adults, up to 400mg per day is generally considered safe, but tolerance varies. 

Q: Does preparation affect matcha’s health benefits?

Ansari: Yes. Whisking matcha in hot (not boiling) water helps preserve its flavor and antioxidant content. Adding milk may slightly reduce antioxidant absorption, but the effect is small in the context of a balanced diet.

What’s more important is added sugar. Sweetened matcha drinks, such as some café lattes, can contain high sugar levels that offset potential health benefits if frequently consumed.

Q: What are good alternatives if matcha is too expensive or unavailable?

Ansari: There are several options, and each have their benefits.

– Green tea provides catechins, though at lower levels than matcha

– Black and oolong tea are rich in antioxidants and contain caffeine

– Coffee is linked to lower risk of certain chronic diseases when consumed in moderation

– Herbal teas like rooibos or hibiscus are caffeine-free, antioxidant-rich, and supportive of hydration

Q: How much matcha is safe to drink daily?

Ansari: Up to 4–5 cups of matcha can fit within safe caffeine limits for adults, but 1–2 cups per day is ideal and a better recommendation for supporting tolerance. Pay attention to how you feel, especially if you also consume other caffeinated drinks.

Q: Any final advice for consumers?

Ansari: It’s important to remember that no single food or drink is a “magic bullet.” Matcha can be a wonderful part of a balanced routine, alongside nutrient-rich foods, movement, sleep and stress management.

For people who are sensitive to coffee, matcha can be a good alternative. The ritual of preparing matcha can also bring a mindfulness benefit to your day.

Making a matcha drink yourself allows you to adjust sweetness, creaminess and flavor to your liking while keeping the health benefits intact. Personally, I love adding rose water to my matcha.


Source link

26 08, 2025

Could SOL Break $500 Before Layer Brett Hits 120x?

By |2025-08-26T03:37:54+03:00August 26, 2025|Crypto News, News|0 Comments

Disclaimer: This is a Press Release provided by a third party who is responsible for the content. Please conduct your own research before taking any action based on the content.


The Solana price prediction for 2025 looks impressive, with analysts projecting new highs fueled by ecosystem growth and rising adoption. Yet, even the most optimistic SOL forecasts pale in comparison to what’s unfolding with Layer Brett (LBRETT).

While Solana may inch toward $500 over time, LBRETT is being tipped for a staggering 120x surge, making it the hottest ticket to the moon this year and beyond. Here’s why.

Analysts predict 120x upside for Layer Brett

Layer Brett has stormed the crypto scene as both a meme coin phenomenon and a serious Layer 2 scaling solution, spurring analysts to tout it as a rare hybrid project that offers entertainment value while solving real blockchain problems.

In the short term, some projections see LBRETT climbing to $0.05—a more than 10x gain from current presale levels. Over the long term, multiple analysts are pointing to a possible price target of $1, which represents an explosive 120x return for early investors.

Several bullish catalysts are fueling these forecasts. First, the staking program offering rewards as high as +25,000% APY makes Layer Brett irresistible for those seeking passive income.

Second, its scarce supply of 10 billion tokens amplifies upside price potential even with average capital inflows. Third, the project benefits from meme-driven virality, ensuring it captures mainstream attention like DOGE or SHIB.


Fourth, its roadmap includes continuous development, utility expansion, and governance features, positioning it as more than just hype. Finally, the rapidly accelerating presale, which has already soared toward $1.4 million, is proof that investor demand is red-hot.

With these five pillars in place, it’s no wonder experts are tipping LBRETT as the next 100x meme coin!

Solana’s breakout to $200+ is inspiring

Recently, the SOL price broke past the $200 level, confirming its resilience despite heavy competition.  At current rates, the SOL price has more than doubled from its April lows of $96, reaffirming its authority in Web3 as its market cap soars past $100 billion!

Part of this strength comes from ongoing ecosystem developments, which have seen Solana’s TVL climb significantly, reflecting increased adoption across DeFi. This growth underscores Solana’s rising dominance in the L1 sector thanks to its faster, low-cost network.

Solana price prediction: Will SOL hit $500?

Solana’s market sentiment looks quite bullish, with CoinMarketCap data showing that 85% of community members expect SOL to push higher this year.

Analysts are equally optimistic. WalletInvestor projects SOL could push toward $350 in the next 12 months, while CoinPriceForecast places the 2025 target near $500.

Such targets are achievable given Solana’s thriving ecosystem of dApps, NFTs, and DeFi protocols. However, these gains are likely to be gradual given Solana’s heavy market cap, which demands huge capital inflows to push the token price upwards.

For this reason, analysts recommend holding Solana for stability. Investors seeking astronomical returns should allocate part of their portfolios toward low-cap projects like Layer Brett.

Conclusion

Solana remains one of crypto’s most robust ecosystems, and its price predictions for 2025 are undeniably strong. A push toward $500 is well within reach, supported by ecosystem growth, rising TVL, and positive market sentiment.

But compared to the potential of Layer Brett, Solana’s trajectory looks modest. Analysts believe that LBRETT could pull a 120x upside thanks to its innovative fusion of meme virality with solid L2 functionalities!

LBRETT is the real growth beast, so race up and grab your ticket to the moon at the $0.0047 presale price floor

Presale: Layer Brett | Fast & Rewarding Layer 2 Blockchain

Telegram: Telegram: View @layerbrett

X: (1) Layer Brett (@LayerBrett) / X

Disclaimer: This media platform provides the content of this article on an “as-is” basis, without any warranties or representations of any kind, express or implied. We assume no responsibility for any inaccuracies, errors, or omissions. We do not assume any responsibility or liability for the accuracy, content, images, videos, licenses, completeness, legality, or reliability of the information presented herein. Any concerns, complaints, or copyright issues related to this article should be directed to the content provider mentioned above.

/div>

Source link

26 08, 2025

Stablecoin Activity Hits Record Levels in July 2025 on Strong DeFi and Trading Demand

By |2025-08-26T02:01:24+03:00August 26, 2025|News, NFT News|0 Comments


Stablecoin activity has reached historic levels in July 2025, with usage metrics for Tether (USDT) and USD Coin (USDC) surging to all-time highs. According to recent data, USDT recorded over 147,000 daily active addresses, while USDC followed closely with more than 97,000, marking the highest levels of engagement for both assets [1]. These figures reflect a growing reliance on stablecoins for trading, saving, and cross-border transactions, particularly within the broader cryptocurrency ecosystem.

The surge in activity is part of a broader trend in the stablecoin market, which saw global transfer volumes exceed $27.6 trillion in the past year, surpassing the combined transaction volumes of major traditional card networks [2]. On the Ethereum network alone, USDC transactions totaled 8.3 million in July 2025, with a monthly transfer value of $748.3 billion [1]. The increase in volume and activity is driven by stablecoins’ utility in decentralized finance (DeFi), exchanges, and institutional-grade blockchain solutions.

Despite these gains, stablecoin adoption is still largely confined to the crypto ecosystem, with 88% of activity occurring within digital asset platforms and only 6% linked to real-world payments [3]. This suggests that while stablecoins are increasingly used in financial infrastructure, their integration into traditional payment systems remains limited. Nevertheless, the rise in institutional adoption and custody demand is evident, particularly as regulatory clarity improves in several major economies.

Regulatory developments have played a key role in the current landscape. Increased clarity has spurred institutional adoption, reflected in the performance of crypto-related stocks and the demand for custody solutions. For example, Coinbase’s stock reached an all-time high of $444.64 in July 2025 amid rising trading volumes [4]. Meanwhile, U.S. banks have expressed concerns that new stablecoin frameworks could lead to massive deposit outflows, sparking debates over financial stability and regulatory fairness [6].

The momentum in stablecoin activity is also supported by the performance of underlying blockchain infrastructure. Ethereum, for instance, hit new all-time highs in July 2025, driven by corporate buying and a shifting macroeconomic outlook [7]. Strong spot demand for ETH has led to outperformance against BTC, with ETH reaching as high as $4,996 on some exchanges [8].

Industry leaders are also acknowledging the growing influence of stablecoins. Binance CEO Changpeng “CZ” Zhao has publicly stated that central bank digital currencies (CBDCs) are becoming obsolete in the face of stablecoin innovation and global regulatory support [5]. This reflects a broader belief that stablecoins are not only a tool for crypto trading but also a foundational component of the evolving digital finance ecosystem.

Source:

[1] title1: USDC usage on the Ethereum network hits an all-time high (https://www.chaincatcher.com/en/article/2200144)

[2] title2: Stablecoins Hit Their IPhone Moment From Wyoming To … (https://www.forbes.com/sites/digital-assets/2025/08/25/stablecoins-hit-their-iphone-moment-from-wyoming-to-japan-to-metamask/)

[3] title3: Stablecoin Growth Could Shake Bond Markets (https://www.mitrade.com/insights/news/live-news/article-3-1066851-20250825)

[4] title4: Stablecoin Stocks: How Regulatory Clarity and Institutional … (https://www.ainvest.com/news/stablecoin-stocks-regulatory-clarity-institutional-adoption-reshaping-risk-demand-2508-39/)

[5] title5: CZ Declares CBDCs Outdated as Stablecoins Dominate … (https://coincentral.com/cz-declares-cbdcs-outdated-as-stablecoins-dominate-global-focus/)

[6] title6: U.S. Banks Warn Stablecoins Could Trigger Massive … (https://coincentral.com/u-s-banks-warn-stablecoins-could-trigger-massive-deposit-outflows/)

[7] title7: Ethereum Hits All-Time High On Bullish Economic Outlook (https://stocktwits.com/news-articles/markets/cryptocurrency/ethereum-hits-all-time-high-on-bullish-economic-outlook/chssWfTRdKx)

[8] title8: ETH breaks out on strong spot demand – Kaiko – Research (https://research.kaiko.com/insights/eth-breaks-out-on-strong-spot-demand)


Source link

26 08, 2025

Natural Gas Price Forecast: Bear Trend Holds Despite Intraday Recovery

By |2025-08-26T01:48:59+03:00August 26, 2025|Forex News, News|0 Comments


Bearish Structure Still Dominates

Despite today’s rebound, natural gas remains entrenched in a broader downtrend. Bearish confidence increased after a long-term dynamic support zone was decisively broken on August 12. Following that break, the anchored volume weighted average price (AVWAP) that once provided support flipped into resistance, capping further upside attempts and leading to fresh selling pressure that drove today’s new trend low.

Measured Move Target Reached

Monday’s decline completed a 100% projection of a falling ABCD pattern at $2.63. While this target often marks a potential pivot, confirmation is lacking. Broader bearish signals remain intact, including the recent break below the April swing low at $2.86, which confirmed trend continuation. Today’s price action shows the market recognized the price level. With larger patterns pointing lower, traders should view the $2.63 level as an interim step within a continuing bearish structure.

Falling Wedge Pattern Developing

Short-term trendlines outlining recent consolidation suggest a possible bullish falling wedge is forming. This pattern would remain valid even if natural gas declines further toward the next lower target zone between $2.54 and $2.51. This range is defined by the 78.6% Fibonacci retracement at $2.54, reinforced by a declining trendline from the 2023 peak. The confluence of technical factors makes this zone a likely magnet for price action in the near term. Once the price zone is reached, if the wedge remains intact, an upside breakout could signal a bullish reversal.

Outlook: Watching Key Support

Although today’s low matched an ABCD projection, there has been no confirmation of a sustainable pivot. The lower $2.54–$2.51 support zone remains the more technically significant area. Until natural gas can reclaim and hold above $2.72, sellers remain firmly in control, with risk skewed toward a test of deeper support before any meaningful bullish reversal is likely to develop.

For a look at all of today’s economic events, check out our economic calendar.


Source link

26 08, 2025

Pound Rises to 1.3548 as Fed Cut Bets Mount and BoE Holds Firm

By |2025-08-26T01:43:53+03:00August 26, 2025|Forex News, News|0 Comments

GBP/USD Rebounds Toward 1.3550 After Powell’s Dovish Shift

The GBP/USD exchange rate staged a sharp rebound after Jerome Powell’s Jackson Hole remarks shifted Fed expectations toward an imminent September cut. The pair jumped from a weekly low of 1.3387 to an intraday high of 1.3548, settling near 1.3499 as U.S. Treasury yields slipped and dollar demand weakened. Fed funds futures now price a 93% probability of a September cut and project more than 50 basis points of easing by year-end. Powell’s acknowledgment of “downside risks to the labor market” outweighed persistent inflation at 2.7% headline and 3.1% core, giving traders reason to pare long-dollar positions.

Divergence Between Fed and Bank of England Policies

The rebound in GBP/USD comes against the backdrop of policy divergence. While the Fed leans toward easing, the Bank of England is expected to keep rates unchanged after UK inflation accelerated. July CPI printed at 3.8%, with the Retail Price Index rising to 4.8%, reinforcing BoE Governor Andrew Bailey’s warnings about “acute challenges” for growth and price stability. This contrast suggests Sterling could remain supported if the Fed cuts rates first while the BoE stays cautious.

Technical Structure and Price Patterns in GBP/USD

On the daily chart, GBP/USD has carved out an inverse head-and-shoulders pattern, a classic bullish reversal signal. The neckline sits near 1.3587; a breakout above this level would clear the path toward 1.3700, while downside support lies at 1.3450 and 1.3400. The pair also trades above its 25-day and 50-day EMAs, confirming that momentum favors the pound despite intermittent profit-taking. Friday’s bullish engulfing candle reinforced the recovery structure, but resistance at 1.3594—the August high—remains the critical barrier for further upside.

Short-Term Risks and Market Drivers

Dollar demand returned briefly in Asia trading, pushing GBP/USD back to 1.3495, though Powell’s dovish tone capped the downside. U.S. New Home Sales fell by 0.6% in July, adding to the case for Fed easing. Upcoming catalysts include the U.S. PCE price index on August 29 and nonfarm payrolls on September 5. A weak print on either could accelerate the dollar’s decline, while sticky inflation risks might revive the Fed’s higher-for-longer stance, reversing gains in Sterling. In the UK, focus turns to the BRC Shop Price Index, which will guide expectations for the next inflation trend.

GBP/USD Outlook

Sterling sits at a pivotal junction, consolidating just below 1.3550 after its best weekly gain in over a month. A decisive close above 1.3594 would unlock upside targets near 1.3787, while a slip under 1.3393 would put 1.3140 back into play. With Powell shifting the Fed toward cuts and the BoE holding firm, the policy divergence is currently Sterling-positive. For now, the market favors further upside in GBP/USD, but execution depends on whether data confirm or challenge the dovish Fed narrative.

That’s TradingNEWS


Source link

26 08, 2025

Expanscience leverages its expertise to create responsible nutraceutical actives

By |2025-08-26T01:38:57+03:00August 26, 2025|Dietary Supplements News, News|0 Comments


In the dietary supplement sector, demands for naturalness, traceability, and efficacy are just as high as in cosmetics. Leveraging its expertise in this field, the Expanscience Group believes it can provide a relevant response to meet the expectations of this rapidly growing market.

Nutraceutical brands are at the forefront of certifications such as ROC (Regenerative Organic Certified) and Fair for Life, fully aligned with our positioning. For more than 20 years, Expanscience has placed sustainability and transparency at the heart of its mission. As a B Corp-certified company, we remain committed to the highest ethical and environmental standards,” notes Armelle Le Péniec, Director of the Cosmetic and Nutraceutical Actives Division at Laboratoires Expanscience.

Tulsinity Bio

To mark the launch of this new catalogue, the company has just launched Tulsinity Bio, an extract of holy basil (Ocimum sanctum L.), grown according to the principles of regenerative agriculture and bearing ROC and Fair for Life certifications. At the crossroads between beauty and well-being, it has been proven to reduce stress, through cortisol tests, and to benefit the skin by improving the elasticity and density of the skin barrier.

Developing an active ingredient that addresses both stress and skin health reflects our commitment to holistic solutions—consistent with other cosmetic actives we offer, such as Ayuredi, which is also derived from holy basil,” explains the director.

A ten-year goal

Expanscience’s ambition is to develop a portfolio enriched with one to two new nutraceutical active ingredients per year, with applications extended beyond nutricosmetics to the entire wellness market for dietary supplements, such as menopause, vitality, sleep, etc.

Our strategy aims to offer a range that complements our cosmetic active ingredients, with a similar model, namely highlighting the effectiveness of our natural ingredients and sourcing guarantees. Our ten-year goal is to achieve a turnover equivalent to that generated by the cosmetic active ingredients business,” adds Armelle Le Péniec.

In addition to Europe, Expanscience is primarily targeting the North American market with the support of its local subsidiary. Asia, which is very interested in this type of product, could also become an area for expansion.

Constraints and investments

For the time being, the company is transferring its expertise to the new constraints of this activity. Plant extraction processes in particular require adaptations due to distinct regulatory constraints.

The extraction solvents are not the same. Those used in cosmetics are not necessarily authorised in food supplements and vice versa,” explains the director.

The development of nutraceutical active ingredients requires longer research and development timelines, more expensive clinical studies, and specialized expertise. At this stage, the main investment lies in human and scientific resources, rather than major industrial infrastructure,” concludes Armelle Le Péniec.

The launch of a new nutraceutical active ingredient is already planned for the end of the year, at the Supply Side West trade show in Las Vegas.


Source link

26 08, 2025

XRP Price Prediction: What Drove Ripple Price Below $3 and Where Could It Go Next?

By |2025-08-26T01:37:09+03:00August 26, 2025|Crypto News, News|0 Comments

XRP tumbled below the critical $3 mark this week, surprising investors and sparking questions about what’s driving Ripple’s native token amid a volatile crypto market.

After a strong rally from November 2024, when XRP rose from $0.50 to $3.27, the recent pullback has erased around 8–10% of its value within days. According to experts, a mix of market-wide sell-offs, whales, regulatory uncertainty, and bearish technical indications are the top drivers for this decline, getting investors wondering if the token will be able to catch its pace again.

Drivers of XRP’s Price Fall

1. Market-Wide Cryptocurrency Sell-Off

During mid-August, the overall cryptocurrency market suffered a downtrend as leading assets like Bitcoin and Ethereum dipped into the red zone. Overall correction brought about heavy liquidations, which then induced selling pressure on altcoins like XRP. As a high-beta instrument, XRP tends to record amplified price reactions during these sell-offs, explaining its drop below the $3 support level.

XRP was trading at around $2.95, down 2.09% in the last 24 hours at press time. Source: XRP Liquid Index (XRPLX) via Brave New Coin

2. Whale Activity and Profit-Taking

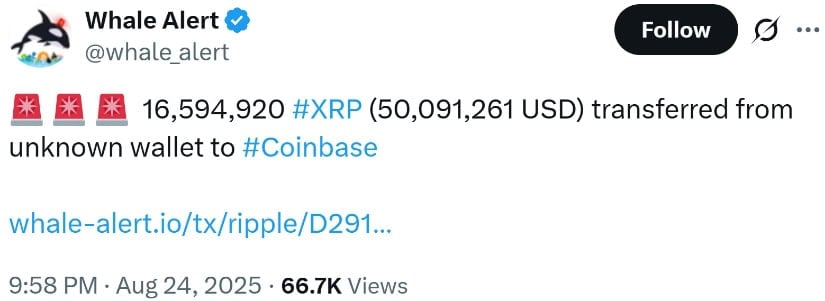
Whales, or big XRP holders, have been aggressively selling. Data from on-chain reveals that wallets holding between 10 million and 100 million XRP sold approximately 470 million tokens valued at around $1.35 billion in a brief period. That significant selling has surpassed market liquidity, exerting bearish pressure on the XRP price.

XRP Price Prediction: What Drove Ripple Price Below  and Where Could It Go Next?

16.59 million XRP, valued at approximately $50.1 million, was transferred from an unknown wallet to Coinbase. Source: Whale Alert via X

3. Technical Indicators and Market Sentiment

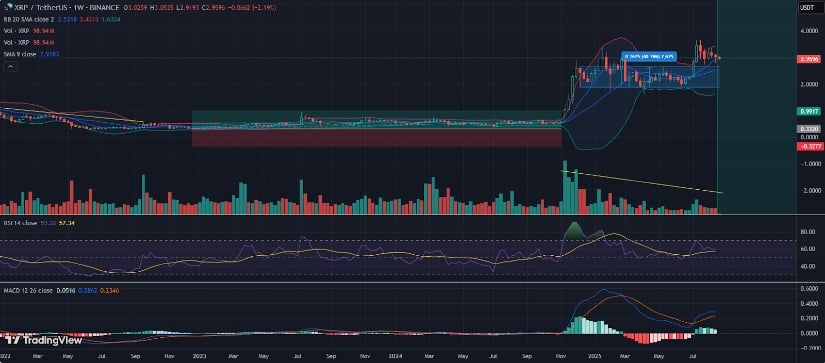
Technical analysis reveals several bearish signals for XRP. The crypto dropped below a symmetrical triangle formation on the 4-hour chart, leaving the significant $3 support level behind. Indications from indicators such as the Moving Average Convergence Divergence (MACD) and Relative Strength Index (RSI) reveal an underlying trend in the bearish direction as the RSI dropped to 32, signaling oversold levels.

Technical Indicators and Market Sentiment

XRP price must break the $3.05-$3.10 resistance zone to resume the long-term bullish move. Source: michael2014robinson on TradingView

XRP’s Outlook: Short-Term Challenges and Long-Term Potential

A few experts remain optimistic about the long-term future of XRP despite the latest decline. Standard Chartered Bank predicted XRP to be at $5.50 by 2025 end on the back of regulatory clarity and potential ETF inflows being key stimulants. In addition, XRP exchange supply decline and ongoing burn rate may allow long-term price appreciation through scarcity growth.

XRP's Outlook: Short-Term Challenges and Long-Term Potential

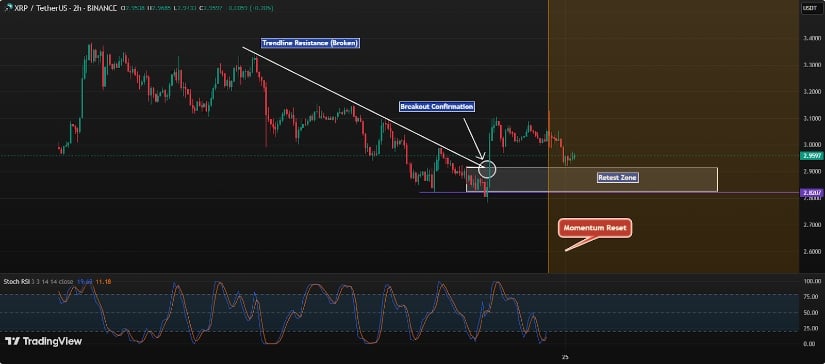
XRP has broken its short-term descending trendline and is consolidating above the $2.82–$2.90 retest zone, with potential upside toward $3.20–$3.30 if support holds. Source: Quant_Trading_Pro on TradingView

XRP’s recent drop to under $3 is attributed to a combination of sell-offs on a market basis, significant whale activity, ETF delays, and bearish technical signals. Short-term woes continue to haunt investors, yet XRP’s long-term time frame is attached to how effectively Ripple navigates regulatory hurdles, secures new partnerships, and differentiates itself in a crowded marketplace. Investors need to stay alert, monitoring key support points and potential bullish catalysts.

Source link

25 08, 2025

Boyaa Bets Big on Bitcoin to Future-Proof Web3 Gaming Empire

By |2025-08-25T23:59:45+03:00August 25, 2025|News, NFT News|0 Comments


Boyaa Interactive International Limited has significantly increased its Bitcoin (BTC) holdings, acquiring 290 BTC for approximately HK$257 million (US$32.9 million) in a strategic move to reinforce its transition toward Web3-based gaming. This addition brings the company’s total Bitcoin reserve to 3,670 BTC, with the average cost per coin standing at $62,878. The purchase was funded by internal resources and executed over a three-week period in regulated markets, necessitating a special disclosure due to exceeding pre-approved shareholder limits for such transactions [2].

The company’s press release outlines a clear strategy in which Bitcoin serves as the foundational asset for its Web3 transformation. Boyaa positions the cryptocurrency not just as a speculative investment but as a key component in the development of its Web3 ecosystem and business model. The firm emphasizes that Bitcoin’s limited supply makes it a scarce, strategic resource, which it is acquiring before it becomes prohibitively expensive or inaccessible. As of 2025, Boyaa was previously ranked among the top ten global public companies in Bitcoin holdings, but it has since dropped to 22nd as more firms enter the market [2].

The strategic accumulation of Bitcoin has already had a measurable impact on shareholder value. According to Boyaa, its Bitcoin holdings per 10,000 shares increased by 12.0% in 2025, reaching approximately 0.0516 BTC. This metric reflects a direct link between the company’s cryptocurrency strategy and individual shareholder stakes, creating a modern interpretation of per-share book value in the context of digital assets [2]. Analysts have responded positively to the move, with the latest rating for Boyaa stock being a “Buy” with a price target of HK$8.50 [1].

This trend of corporate Bitcoin acquisitions is gaining momentum, particularly in Asia and the U.S., where regulatory clarity and institutional adoption are creating a favorable environment for companies to treat Bitcoin as a strategic treasury asset. For instance, Hong Kong-based Ming Shing Group Holdings recently announced a $483 million Bitcoin purchase of 4,250 BTC, further highlighting the growing interest in Bitcoin as a corporate reserve [4]. Boyaa’s decision to increase its holdings aligns with this broader trend and signals its long-term commitment to positioning itself as a leader in the Web3 gaming sector.

The press release also underscores the competitive nature of the corporate Bitcoin space, where companies are racing to secure Bitcoin before supply constraints become more pronounced. Boyaa’s move can be viewed as a proactive measure to secure a critical asset for its future ecosystem development and to hedge against potential volatility in the gaming market. This approach is increasingly common among public companies, with at least 160 now holding Bitcoin in their treasuries [2]. As the Web3 gaming landscape evolves, Boyaa’s Bitcoin-driven strategy may serve as a model for other firms seeking to integrate digital assets into their core operations.

Source:

[1] Boyaa Interactive Expands Bitcoin Holdings with HK$257 Million Acquisition (https://www.tipranks.com/news/company-announcements/boyaa-interactive-expands-bitcoin-holdings-with-hk257-million-acquisition)

[2] Boyaa Interactive adds $33m in Bitcoin to anchor Web3 gaming push (https://crypto.news/boyaa-interactive-adds-33m-in-bitcoin-to-anchor-web3-gaming-push/)

[3] Boyaa Interactive recently spent approximately HK$257 million to purchase 290 Bitcoin (https://www.panewslab.com/en/articles/137c552c-9565-43c2-b65e-bd09d5678bde)

[4] Hong Kong’s Ming Shing Group to Buy $483 Million in Bitcoin (https://thedefiant.io/news/markets/hong-kongs-ming-shing-group-to-buy-483-million-bitcoin-9e2ed5e6)


Source link

Go to Top