About Editorial team of BIPNs

Main team of content of bipns.com. Any type of content should be approved by us.
25 08, 2025

XAG/USD rebounds sharply, Fed minutes eyed

By |2025-08-25T23:46:54+03:00August 25, 2025|Forex News, News|0 Comments


  • Silver rebounds sharply on Wednesday after falling to its lowest level since August 4.
  • The rebound follows a pullback in the US Dollar, as political pressure mounts on the Fed after President Trump calls for Governor Lisa Cook’s resignation.
  • Traders await the release of the FOMC July meeting minutes, which could offer fresh clues on the Fed’s inflation outlook and rate trajectory.

Silver (XAG/USD) stages a sharp recovery on Wednesday after sliding to its lowest level in over two weeks, since August 4. The rebound comes as the US Dollar (USD) lost ground following renewed political pressure on the Federal Reserve (Fed), with US President Donald Trump publicly calling for the resignation of Fed Governor Lisa Cook. The safe-haven appeal of Silver re-emerged, helping the metal bounce from session lows.

At the time of writing, Silver is trading around $37.80, up nearly 1.0% on the day, having rebounded strongly from an intraday low of $36.96. The bounce coincides with growing market caution ahead of the release of the Federal Open Market Committee (FOMC) July meeting minutes at 18:00 GMT, which could offer insight into the Fed’s evolving inflation outlook and interest rate path.

From a technical standpoint, Silver is trading within a symmetrical triangle pattern on a 4-hour chart. The price rebounded sharply from the lower boundary of the triangle formation near $37.00, where buyers re-emerged and defended key support. This bounce has brought the metal back toward the 100-period Simple Moving Average (SMA), which now acts as immediate resistance near $37.76.

A sustained break above the 100-SMA could pave the way for a retest of the triangle’s upper boundary near the $38.20 psychological level. A confirmed breakout above this confluence zone would likely accelerate bullish momentum, exposing the next upside targets at $38.74—the August 14 swing high, followed by $39.53, which marks the multi-year peak.

Momentum indicators are showing early signs of a potential bullish shift. The Relative Strength Index (RSI) has rebounded after briefly dipping into oversold territory, now climbing back toward the midline, which reflects improving intraday strength and fading bearish pressure. Meanwhile, the Moving Average Convergence Divergence (MACD) histogram is narrowing, and the MACD line is approaching a bullish crossover above the signal line, another indication that downside momentum is weakening and a reversal may be underway.

On the downside, failure to clear the 100-SMA may keep the metal confined within the triangle structure. A break below the $37.00 support could trigger a bearish breakdown, exposing the next support levels at $36.50 and $35.90.

Silver FAQs

Silver is a precious metal highly traded among investors. It has been historically used as a store of value and a medium of exchange. Although less popular than Gold, traders may turn to Silver to diversify their investment portfolio, for its intrinsic value or as a potential hedge during high-inflation periods. Investors can buy physical Silver, in coins or in bars, or trade it through vehicles such as Exchange Traded Funds, which track its price on international markets.

Silver prices can move due to a wide range of factors. Geopolitical instability or fears of a deep recession can make Silver price escalate due to its safe-haven status, although to a lesser extent than Gold’s. As a yieldless asset, Silver tends to rise with lower interest rates. Its moves also depend on how the US Dollar (USD) behaves as the asset is priced in dollars (XAG/USD). A strong Dollar tends to keep the price of Silver at bay, whereas a weaker Dollar is likely to propel prices up. Other factors such as investment demand, mining supply – Silver is much more abundant than Gold – and recycling rates can also affect prices.

Silver is widely used in industry, particularly in sectors such as electronics or solar energy, as it has one of the highest electric conductivity of all metals – more than Copper and Gold. A surge in demand can increase prices, while a decline tends to lower them. Dynamics in the US, Chinese and Indian economies can also contribute to price swings: for the US and particularly China, their big industrial sectors use Silver in various processes; in India, consumers’ demand for the precious metal for jewellery also plays a key role in setting prices.

Silver prices tend to follow Gold’s moves. When Gold prices rise, Silver typically follows suit, as their status as safe-haven assets is similar. The Gold/Silver ratio, which shows the number of ounces of Silver needed to equal the value of one ounce of Gold, may help to determine the relative valuation between both metals. Some investors may consider a high ratio as an indicator that Silver is undervalued, or Gold is overvalued. On the contrary, a low ratio might suggest that Gold is undervalued relative to Silver.

Source link

25 08, 2025

EUR/USD, USD/JPY and AUD/USD Forecast – US Dollar Recovers Slightly on Monday

By |2025-08-25T23:43:25+03:00August 25, 2025|Forex News, News|0 Comments

The 200-day EMA is in this neighborhood, but it is flat, suggesting that perhaps people just aren’t that interested in putting a lot of risk on. That could be true, but I would also point out that we are in the dead of summer, and that of course means that volume is a little bit lighter anyway.

AUD/USD Technical Analysis

And in the Australian dollar, it looks like we are rallying just a touch, but at this point in time I would also point out that the 50-day EMA seems to be offering a bit of resistance. And then again, we have the 0.6550 level. That’s an area that has been a bit of trouble for quite some time. You’ll notice that there was a previous uptrend line that has proven itself to be somewhat resistant as well. It’s a bit of a messy trend line, but it does give you an idea of the overall attitude of the market.

While the Euro and the pound were both performing very well against the U.S. dollar, the Australian dollar just ripped it, so I don’t like the Aussie dollar in general and I do think that eventually, if the U.S. dollar starts to pick up strength, this one here is going to fall apart. I prefer to fade rallies in this market.

For a look at all of today’s economic events, check out our economic calendar.

Source link

25 08, 2025

Matcha madness leaves Japan’s tea ceremony pros skeptical

By |2025-08-25T23:38:19+03:00August 25, 2025|Dietary Supplements News, News|0 Comments


By YURI KAGEYAMA, Associated Press

TOKYO (AP) — Clad in an elegant kimono of pale green, tea ceremony instructor Keiko Kaneko uses a tiny wooden spoon to place a speck of matcha into a porcelain bowl.

She froths up the special powdered Japanese green tea with a bamboo whisk after pouring hot water with a ladle from a pot simmering over hot coal.

Her solemn, dance-like movements celebrate a Zenlike transient moment, solitude broken up by the ritualistic sharing of a drink.

No wonder Kaneko and others serious about “sado,” or “the way of tea,” are a bit taken aback by how matcha is suddenly popping up in all sorts of things, from lattes and ice cream to cakes and chocolate.

No one knows for sure who started the global matcha boom, which has been going on for several years. But it’s clear that harvests, especially of fine-grade matcha, can’t keep up with demand.

This shows Matcha Kaki Gori, shaved ice desserts, served at Ogikubo Three Gardens in Tokyo, on July 20, 2025. (AP Photo/Yuri Kageyama)

A booming market

Matcha is a type of tea that’s grown in shade, steamed and then ground into a very fine powder. It’s processed differently from regular green tea, with the best matcha ground using stone mills, and switching from one to the other takes time. No farmer wants to switch and then find that matcha fever has died.

The Japanese agricultural ministry has been working to boost tea growth, offering help for farmers with new machines, special soil, financial aid and counseling to try to coax tea growers to switch to matcha from regular green “sencha” tea.

“We don’t want this to end up just a fad, but instead make matcha a standard as a flavor and Japanese global brand,” said Tomoyuki Kawai, who works at the tea section of the agricultural ministry.

Production of “tencha,” the kind of tea used for matcha, nearly tripled from 1,452 tons in 2008, to 4,176 tons in 2023, according to government data.

Japan’s tea exports have more than doubled over the last decade, with the U.S. now accounting for about a third. Much of that growth is of matcha, according to Japanese government data. The concern is that with labor shortages as aging farmers leave their fields, the matcha crunch may worsen in coming years.

Other countries, including China and some Southeast Asian countries, also are producing matcha, so Japan is racing to establish its branding as the origin of the tea.


Source link

25 08, 2025

Solana Price Prediction: Breakout or Pullback? Participants’ Eye $150–$210 Levels Closely

By |2025-08-25T23:36:22+03:00August 25, 2025|Crypto News, News|0 Comments

SOL Solana price faces a decisive moment as price tests the $210 resistance zone, with institutions eyeing a $1B buy and participants watching for a breakout or pullback.

Solana is back in the headlines, this time with whispers of a massive $1B institutional purchase led by Galaxy, Jump, and Multicoin Capital. A buy of that scale could do more than just make waves.

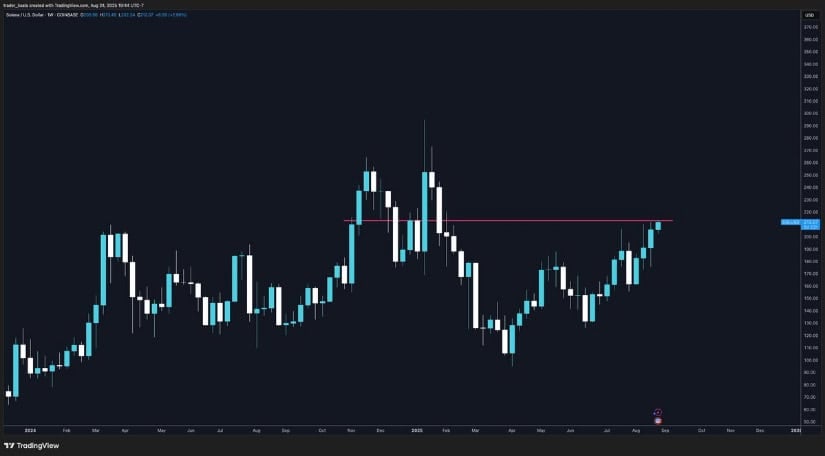
At the same time, Solana’s chart is starting to show signs of life. Price has been pressing against heavy resistance near the $210 zone, a level that has capped rallies several times before.

Institutions Eye $1B Solana Purchase

A major development has surfaced for Solana, with Bloomberg reporting that Galaxy, Jump, and Multicoin Capital are exploring a $1B purchase of SOL. Such large-scale interest from institutional players underscores how Solana is being viewed as a possible investment front.

Solana faces a potential $1B institutional buy-in that could trigger rapid price repricing and spark strong upside momentum. Source: SolanaFloor via X

From a market view, a $1B buy would quickly push the price higher by creating strong demand while reducing the amount of SOL available. Such heavy buying pressure could force the market to reprice fast, sending SOL into higher levels in the short term.

Solana Weekly Chart Signals Key Breakout

Despite skepticism from parts of the market, Solana’s weekly chart is beginning to take shape for what analyst Trader Koala calls a “hated rally.” Price is pressing directly into horizontal resistance around the $210 level, an area that has acted as a ceiling on multiple occasions. The weekly candles show higher lows forming beneath this range, suggesting that buyers are quietly absorbing supply while sentiment remains cautious.

Solana Price Prediction: Breakout or Pullback? Participants’ Eye 0–0 Levels Closely

Solana’s weekly chart presses into the $210 resistance zone, with higher lows hinting at a breakout towards $240–$260. Source: Trader Koala via X

If Solana can secure a weekly close above $210 to $215, it would confirm a breakout from this consolidation and likely drive momentum towards $240 and $260 in the near term. Volume confirmation will be key here, as higher participation would validate the move

Solana Strengthens Against ETH and BTC

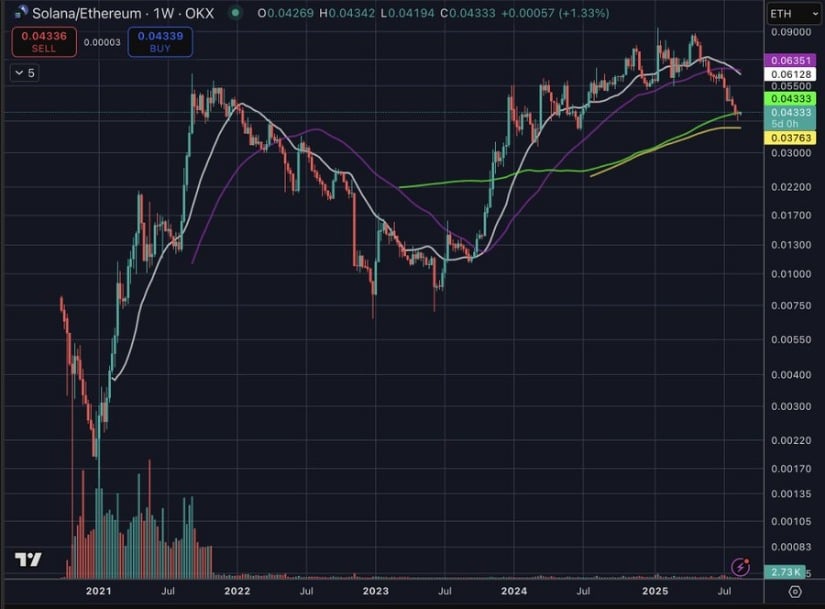
Chris Burniske highlights that Solana’s relative strength against both Ethereum and Bitcoin is starting to stand out on the weekly charts. The SOL/ETH pair is holding firm above the 200-week moving average while consolidating near the 0.043 zone, showing resilience after months of decline.

Solana Strengthens Against ETH and BTC

Solana shows renewed strength on SOL/ETH pair. Source: Chris Burniske via X

Structurally, higher lows are beginning to form, hinting at a possible reversal. If momentum carries through, Solana could start reclaiming lost ground against Ethereum, a sign that capital rotation is shifting in its favor.

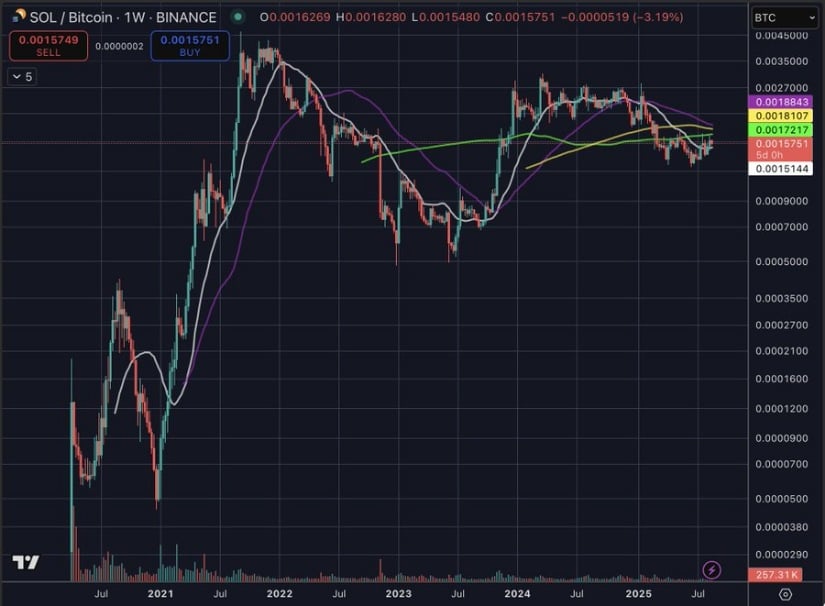
The SOL/BTC chart tells a similar story, where price is stabilizing above the 0.0015 support zone and pushing back toward key moving averages. Each bounce from this base adds to the argument that Solana may begin outperforming Bitcoin as well. If buyers can secure continuation above 0.0018, it opens the way for broader relative strength.

Solana Strengthens Against ETH and BTC

Solana’s SOL/BTC pair holds firm above 0.0015 support, eyeing 0.0018 for a potential breakout in relative strength. Source: Chris Burniske via X

Cautious Outlook: Cooling Momentum Signals Near-Term Pressure

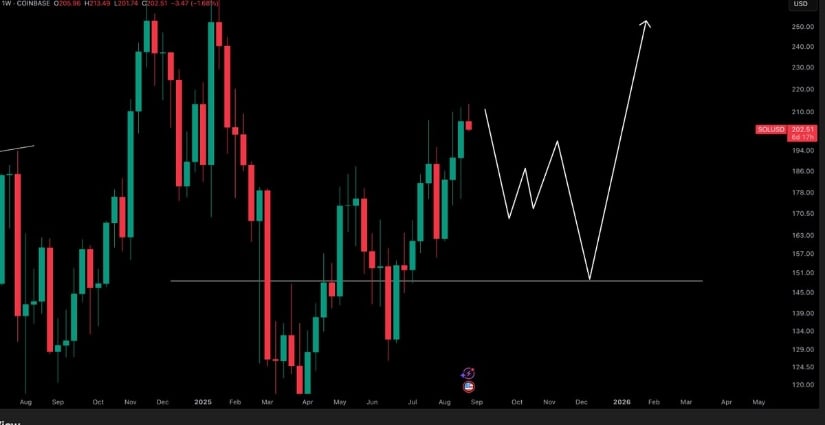
Analyst Crypto Monkey points out that while Solana has been showing strength, traders should remain mindful of key downside levels. If market conditions cool off, a pullback into $170 level followed by $150 level remains possible, with the weekly candles suggesting that buyers would likely step in aggressively there.

Cautious Outlook: Cooling Momentum Signals Near-Term Pressure

Solana faces heavy resistance near $200–$210, with analysts warning a pullback towards $150 may be needed to reset momentum. Source: Crypto Monkey via X

From a technical view, the current range around $200 to $210 has become heavy resistance, stalling momentum in the short term. A rejection here could lead to consolidation or a deeper retrace before a stronger rally resumes. If Solana does revisit $150, holding that level would keep the long-term bullish structure intact while resetting momentum indicators for the next push higher.

Final Thoughts

Solana finds itself at a crossroads where both fundamentals and technicals are aligning. The talk of a $1B institutional buy-in adds fuel to the narrative, while the weekly chart shows signs of a breakout waiting to happen. If price can close above $210 to $215, momentum could quickly build toward higher targets, turning what many still call a “hated rally” into a powerful move. However, resistance at $200 to $210 remains a tough ceiling, and a rejection could easily send Solana back to retest $150 before any stronger rally resumes.


Source link

25 08, 2025

A Technical and Market Flow Deep Dive

By |2025-08-25T21:59:01+03:00August 25, 2025|News, NFT News|0 Comments


On a day when most market participants had expected a quiet session for the crypto and blockchain sector, Defi Development (DFDV.O) plunged nearly 20% in intraday trading, with a volume of over 4.5 million shares exchanged. This significant move came despite a lack of new fundamental news or major macroeconomic catalysts, raising the question: What triggered this sharp drop?

Technical Signal Analysis

From the technical side, the only confirmed signal that triggered was the kdj death cross, a bearish divergence where the fast line crosses below the slow line in the stochastic oscillator. This pattern is typically associated with a weakening of bullish momentum and often precedes a price correction or reversal.

  • No inverse head and shoulders, head and shoulders, or double bottom patterns were confirmed, suggesting no immediate support levels were in play to halt the decline.
  • There was also no macd death cross or rsi oversold signals, which might have hinted at a temporary bounce.
  • The kdj death cross stands out as the only confirmed bearish signal and likely reflects a shift in short-term sentiment and selling pressure.

Order-Flow Breakdown

Unfortunately, no block trading data or cash flow metrics were available for this session, which limits our ability to analyze specific bid-ask imbalances or large institutional orders. However, the massive volume traded suggests increased selling pressure was likely at work, possibly from profit-taking or panic selling after a prior rally.

Peer Comparison

To better understand the broader picture, we looked at the performance of related theme stocks in the blockchain and AI space:

  • AAP (Applied Optoelectronics) rose over 2.37%, showing positive momentum in the AI hardware space.
  • BH (Birch Grove Group) and BH.A (Class A) both posted gains of over 1.7% and 2.1%, respectively.
  • ADNT (AvidXchange) and BEEM also had positive moves, suggesting a broader shift into AI and fintech.
  • However, AACG (Able County Acquisition) fell 6.38%, indicating varied performance across the space.

This mixed performance suggests sector rotation might be at play, with capital shifting from crypto-related stocks to AI and fintech alternatives, or even more speculative plays like ATXG and AREB, which jumped more than 10% and 1.7%, respectively.

Hypothesis Formation

Putting it all together, two key hypotheses emerge:

  1. Short-term bearish divergence in the kdj oscillator signaled a shift in momentum and may have triggered algorithmic selling or stop-loss orders, accelerating the drop.
  2. Capital is rotating out of crypto-related stocks and into AI and fintech, as seen in the divergent performance of related stocks. DFDV may be a casualty of broader thematic shifts rather than company-specific issues.

Without new news, the drop appears to be driven by market sentiment and sector rotation, rather than a fundamental breakdown.


Source link

25 08, 2025

XAU/USD at $3,365 as Powell’s Dovish Pivot Meets Dollar Strength

By |2025-08-25T21:46:06+03:00August 25, 2025|Forex News, News|0 Comments


Gold Price (XAU/USD) Holds Above $3,350 Amid Dollar Strength and Powell’s Dovish Pivot

Fed Policy Outlook Shapes Gold’s Near-Term Path

The gold price (XAU/USD) is hovering near $3,365–$3,370 as markets digest Jerome Powell’s Jackson Hole remarks that tilted unexpectedly dovish. Powell noted that the “balance of risks” is shifting toward labor market weakness, with traders now pricing in an 85% probability of a 25 bps rate cut in September, up from 75% before his speech. Lower interest rates reduce the opportunity cost of holding gold, and that shift has underpinned the metal’s resilience above $3,350 despite intermittent dollar strength. Benchmark 10-year Treasury yields trade near 4.27%, while the U.S. Dollar Index (DXY) is consolidating just above 98, close to a four-week low. This dynamic—falling yields versus a still-firm greenback—is defining the near-term tug-of-war around gold’s direction.

Geopolitical Risk Lends Support to Safe-Haven Demand

Beyond monetary policy, geopolitical risks are injecting a safety premium into gold. Russia confirmed new Ukrainian drone strikes against energy and nuclear infrastructure in Kursk, while President Zelensky reiterated that Kyiv will “fight for freedom” on Independence Day. The escalation provides a geopolitical bid for gold, keeping safe-haven flows alive. At the same time, in Saudi Arabia, retail gold prices adjusted lower in local terms, reflecting the translation of global USD moves into regional markets. Gold traded at SAR 405.99 per gram, slightly down from SAR 406.84 on Friday, underscoring how shifts in the global market ripple across regional buyers.

U.S. Growth Data and Inflation in Focus

The market is now bracing for Thursday’s release of U.S. Q2 GDP, expected to show 3.0% annualized growth. A stronger print risks firming the dollar further and weighing on gold, while a downside surprise would validate Powell’s dovish tilt and likely accelerate bids into bullion. Additional catalysts include this week’s inflation, personal income, and jobless claims updates, all of which could further steer Fed expectations and, by extension, gold’s positioning into September.

Technical Setup: Range-Bound But Bullish Bias

Gold futures opened the week above $3,417.60, the first open above $3,400 since early August, and are holding near the 20-day EMA around $3,350. On the upside, the key resistance lies at $3,400–$3,410, followed by $3,439 (July high) and the psychologically critical $3,500. A decisive break above $3,500 opens the door to $3,550–$3,600, with some houses projecting $3,700 by year-end if Fed easing combines with central bank demand. On the downside, immediate support is at $3,315 (Aug 19 low), followed by $3,285–$3,268, near the 100-day EMA. A break of $3,245 would risk a deeper slide toward $3,200–$3,121. Indicators remain mixed: the RSI sits mid-range (40–60), suggesting indecision, while Bollinger Bands are tightening, implying a volatility breakout ahead.

Central Bank Demand and Structural Tailwinds

Structural demand remains a powerful theme. Central banks have been net buyers at 50-year highs, absorbing dips in bullion as part of diversification away from the dollar. At the same time, analysts highlight that U.S. gold reserves are at their lowest levels in 90 years, even as Treasury debt climbs to $36 trillion. Revaluation studies suggest that if U.S. gold holdings were marked against Treasury obligations at historical ratios, implied fair value could reach $25,000–$55,000 per ounce. While not immediate targets, these long-cycle comparisons highlight the imbalance underpinning long-term bullish calls.

Physical Demand and Seasonal Buying

In India, jewelers have begun seasonal stocking ahead of the festival period, but overall Asian demand remains uneven. Volatility above $3,400 has kept some retail buyers on the sidelines, though dips back toward $3,300 are sparking interest. Physical premiums in hubs like China remain elevated, signaling tight local supply despite fluctuating international benchmarks.

Gold Price Forecast: Bulls and Bears Square Off

Bulls argue that Powell’s dovish tone, the high probability of a September rate cut, and geopolitical uncertainty create the ideal backdrop for renewed momentum. The break above $3,400 strengthens the case for retests of $3,439 and a push to $3,500, with stretch targets at $3,700 by year-end. Bears counter that gold is vulnerable to stronger-than-expected GDP and inflation prints this week, which could revive the dollar and push bullion back toward $3,285 or even $3,245. A breakdown through $3,200 risks accelerating losses to $3,121, unwinding part of the summer rally. With volatility compressing, the standoff between bulls targeting $3,700 and bears eyeing $3,200 is about to resolve decisively.

That’s TradingNEWS


Source link

25 08, 2025

U.S. Dollar Gains Ground As New Home Sales Beat Estimates: Analysis For EUR/USD, GBP/USD, USD/CAD, USD/JPY

By |2025-08-25T21:42:36+03:00August 25, 2025|Forex News, News|0 Comments

Scan QR code to install app

Important DisclaimersThe content provided on the website includes general news and publications, our personal analysis and opinions, and contents provided by third parties, which are intended for educational and research purposes only. It does not constitute, and should not be read as, any recommendation or advice to take any action whatsoever, including to make any investment or buy any product. When making any financial decision, you should perform your own due diligence checks, apply your own discretion and consult your competent advisors. The content of the website is not personally directed to you, and we does not take into account your financial situation or needs.The information contained in this website is not necessarily provided in real-time nor is it necessarily accurate. Prices provided herein may be provided by market makers and not by exchanges.Any trading or other financial decision you make shall be at your full responsibility, and you must not rely on any information provided through the website. FX Empire does not provide any warranty regarding any of the information contained in the website, and shall bear no responsibility for any trading losses you might incur as a result of using any information contained in the website.The website may include advertisements and other promotional contents, and FX Empire may receive compensation from third parties in connection with the content. FX Empire does not endorse any third party or recommends using any third party’s services, and does not assume responsibility for your use of any such third party’s website or services.FX Empire and its employees, officers, subsidiaries and associates, are not liable nor shall they be held liable for any loss or damage resulting from your use of the website or reliance on the information provided on this website.Risk DisclaimersThis website includes information about cryptocurrencies, contracts for difference (CFDs) and other financial instruments, and about brokers, exchanges and other entities trading in such instruments. Both cryptocurrencies and CFDs are complex instruments and come with a high risk of losing money. You should carefully consider whether you understand how these instruments work and whether you can afford to take the high risk of losing your money.FX Empire encourages you to perform your own research before making any investment decision, and to avoid investing in any financial instrument which you do not fully understand how it works and what are the risks involved.

Source link

25 08, 2025

10 Medications You Should Avoid Mixing With Turmeric

By |2025-08-25T21:37:19+03:00August 25, 2025|Dietary Supplements News, News|0 Comments


Turmeric is a spice containing curcumin, which may have antioxidant, anticancer, and anti-inflammatory potential. Experts warn that it can interact with certain medications, especially when taken in large quantities.

1. Aspirin

Aspirin reduces the clumping of platelets, which decreases the formation of blood clots responsible for heart attacks and strokes, said Maria Pino, Ph.D., an associate professor at New York Institute of Technology College of Osteopathic Medicine and a licensed pharmacist.

In some preclinical studies, turmeric has been observed to display similar effects to aspirin as an anti-inflammatory and antiplatelet drug. Combining them can therefore lead to an increased chance of bleeding externally and internally, Pino explained, which can be dangerous.

Other antiplatelet drugs, such as clopidogrel, and anticoagulants, such as warfarin and rivaroxaban, which are often used to reduce the risk of stroke from atrial fibrillation, have also shown a similar enhanced bleeding risk when combined with turmeric.

2. Insulin and Glipizide

These medications are used to reduce blood sugar in people with diabetes. Research has meanwhile shown that turmeric can increase the regulation of proteins involved in insulin release, potentially leading to a drop in blood sugar levels.

“Turmeric can potentially help lower blood sugar, which could lead to hypoglycemia if combined with prescription diabetes medications,” said Marissa Mauricio, PharmD, a clinical pharmacy specialist at Baptist Health South Florida.

This can cause symptoms such as blurred vision, dizziness, sweating, heart palpitations, and confusion. In more severe cases, Mauricio said. hypoglycemia can cause loss of consciousness, seizures, or coma.

3. Amlodipine

Amlodipine is used to treat high blood pressure by blocking the entry of calcium into the blood vessels, which dilates them and reduces blood pressure.

One animal study found that amlodipine absorption increased when combined with turmeric.

“Higher levels of amlodipine in the body could result in decreased blood pressure and a greater risk of dizziness, with the possibility of falls being a concern for elderly patients,” Pino said.

4. Tacrolimus

Tacrolimus is an immunosuppressant medication that is used to prevent organ rejection after an organ transplant. However, it can also reduce kidney function.

In one case report, a patient experienced worsening kidney function following a recent high-dose intake of turmeric with his meals. Data from animal studies also found a change in drug metabolism with turmeric.

“This is likely attributed to turmeric preventing the breakdown of tacrolimus in the liver, leading to higher immunosuppressant levels,” Pino said.

5. Chemotherapy Drugs

Chemotherapy drugs kill cancer cells in a variety of ways. A study using human breast cancer cells as an experimental model found that turmeric could lessen the effectiveness of these chemotherapeutic agents.

However, Pino said additional studies are required to confirm whether dietary and supplemented turmeric should be avoided during cancer treatment, as turmeric also has potential anti-cancer effects.

6. Tamoxifen

Tamoxifen is an estrogen modulator that is used to manage breast cancer.

In one study, tamoxifen combined with turmeric was found to increase the liver metabolism of the breast cancer drug, lowering the drug’s effectiveness. But Pino said further studies are needed to include a greater patient population and to understand if this effect is patient-specific.

7. Losartan

This medication lowers blood pressure by dilating blood vessels and blocking a hormone that increases sodium and water retention.

Research has shown that turmeric can reduce the liver’s ability to break down the drug, leading to higher drug levels in the body. This can increase the risk of dizziness, cause a change in heart rate, and lead to muscle cramps.

8. Levothyroxine

Levothyroxine is a hormone replacement for patients with underactive thyroid function, also called hypothyroidism.

“For the highest absorption potential, levothyroxine should be taken on an empty stomach, before your morning meal, and several hours apart from other medications or supplements, including turmeric,” Pino said.

9. Antacids

These drugs neutralize stomach acid and help to manage indigestion and ulcers.

While turmeric does have anti-inflammatory potential in the gastrointestinal tract, curcumin can also stimulate stomach acid production.

“This effect could potentially reduce the effectiveness of antacid medications and worsen conditions like acid reflux,” Mauricio said.

10. Methotrexate

This medication interferes with the production of folate, which is needed for cell survival. It is used to treat rheumatoid arthritis, psoriasis, and cancer.

Because it is metabolized in the liver, other drugs or supplements (including turmeric), which reduce methotrexate’s breakdown, can potentially increase its adverse effects, including a greater risk for infections, Pino said.

Other Things to Consider

It’s important to note that cooking with turmeric in regular doses is generally considered safe from drug interactions. Supplements also pose a greater risk of drug interactions because they’re not regulated by the FDA.

“The form and dose of turmeric can make a big difference on the impact,” Mauricio said.

“High-dose turmeric supplements, especially those that include black pepper extract to boost absorption, are more likely to cause interactions with medications because the body absorbs it at a higher level,” she added.

What This Means For You

While cooking with small amounts of turmeric is generally considered safe while on medication, you should consult with your healthcare provider before taking tumeric supplements or consuming large amounts of the spice if you’re taking any of the listed medications.


Source link

25 08, 2025

Cold Wallet Presale Hits $6.4M, DOGE Price Reaction, ARB Price Prediction

By |2025-08-25T21:34:53+03:00August 25, 2025|Crypto News, News|0 Comments

August is heating up for crypto, with Dogecoin, Arbitrum (ARB), and Cold Wallet (CWT) grabbing the spotlight. These names stand out among top crypto assets this month. Dogecoin faced turbulence after a $207 million whale transfer, showing wild swings but still battling resistance at key levels. Arbitrum finds itself at a turning point, testing the $0.51–$0.52 area that could decide whether it climbs toward $0.90 or slides back down.

At the same time, Cold Wallet (CWT) is charting its own course. With $6.4M raised and 750 million tokens sold in presale, CWT already powers 2 million users. Unlike speculative setups in Dogecoin and Arbitrum, Cold Wallet drives adoption with cashback rewards, creating a clear path to ROI. It is proving utility now, not later, making it one of the most talked-about names in the space.

900 Million DOGE Sent to Binance Sparks Dogecoin (DOGE) Price Reaction

A massive move of 900,000,000 DOGE worth about $207 million has lit up the market. The transfer went straight to Binance, and while it seemed mysterious, blockchain trackers showed it was part of Binance’s internal wallet system. Still, the size of the deposit has stirred speculation.

Right before the transfer, Dogecoin (DOGE) price reaction saw the coin fall from above $0.25 to under $0.22. After the deposit, a rebound carried it back to $0.23, though $0.238 remains stubborn resistance. If buyers fail to push past it, DOGE risks falling again to the $0.22 support.

For many, this move is a wake-up call. Large transfers like this can change liquidity dynamics quickly. Dogecoin watchers are waiting to see if the next waves of activity drive the price toward higher resistance or trigger another pullback.

Arbitrum (ARB) Price Prediction Hinges on $0.51 Support Test

Arbitrum (ARB) sits at a critical test zone between $0.51 and $0.52. Holding this support could fire up a move to $0.90, with extended targets at $1.23 and $1.70. Ethereum’s strength and the broader Layer-2 boom are backing this setup. But if ARB slips under $0.50, the token may slide back into its old range between $0.26 and $0.50.

AD 4nXdHzz m1lOn7bccKBhGYKJ3s8d3LX4ys2aLNiryeS57Z ZN3f0wxYUdo8R bozKZRV9iG8igfZCIX7uZA ZSfgkC7l4TLl6maC7rlMbl6VXkxHXvZW45ypMC9NYEphM

Traders view this moment as a key retest. If the level holds, the breakout could be confirmed and upside unlocked. For those tracking Arbitrum (ARB) price prediction, the next few sessions will be decisive in shaping whether the bullish story continues.

Cold Wallet Presale Skyrockets Past $6.4M With Users Already Onboard

Cold Wallet isn’t waiting for future promises, it is live right now and rewarding people who use it. With over $6.4 million raised and 750 million tokens already sold, this presale is far from the usual. The system is built to give cashback on gas fees, swaps, and bridge transactions, all paid in CWT tokens. Every action becomes a way to earn instead of spend.

What makes Cold Wallet different is its ready-made community. After the $270 million takeover of Plus Wallet, it now has 2 million active users built into the platform. So when you enter the presale, you are not betting on a future idea, you are joining a system already moving with real adoption.

AD 4nXeb2c629 RJBfS0T1TlBBVWWgYGMaXKSuQSDvGtfYNoieRO2kUFmD4M70jqXbSmm9KdTJCTViEBFNJG4tIOd2NALSmb3hMPugnEAV3zBVEFKljIuq9OlfiTMt1rHlTPN

At Stage 17, the presale price is locked at $0.00998, with a confirmed launch price of $0.3517. That equals a 3,423% ROI for early buyers. Each stage raises the price, which means waiting reduces upside. With real use cases, millions of users, and fast presale growth, Cold Wallet is racing ahead. The window is closing, and those who hesitate risk missing out.

Why Cold Wallet Stands Out Among Top Crypto Assets Today

Dogecoin (DOGE) price reaction and Arbitrum (ARB) price prediction are both drawing attention, but the biggest story in today’s market is Cold Wallet (CWT). Dogecoin keeps reacting to massive whale transfers, but it struggles with resistance, keeping its volatility in the spotlight.

Arbitrum is holding near key support, with targets aiming toward $0.90 if it breaks higher, though a drop below $0.50 would signal a setback. By comparison, Cold Wallet is not built on speculation but on daily rewards. With $6.4M already raised, a base of 2 million active users, and its cashback model fueling demand, CWT is proving itself as the top crypto to invest in.

At $0.00998 in Stage 17, the presale offers a 3,423% ROI. But every new stage reduces the margin. For anyone searching among top crypto assets, Cold Wallet stands out as the option that blends real use with long-term growth.

AD 4nXfQjh0we9pbNG0iwdid3XR6EC54AVuitkc779rGKvKONo5iTU5oH2FFvH6Il K8iWZbBBsyYXI5FpqzIFwxEJQwoQ4UlJXMtjcQX BATsV5MlgESxiKJFG9SEgkQd3xxB

Explore Cold Wallet Now:

Presale: https://purchase.coldwallet.com/

Website: https://coldwallet.com/

X: https://x.com/coldwalletapp

Telegram: https://t.me/ColdWalletAppOfficial

This article is not intended as financial advice. Educational purposes only.

Source link

25 08, 2025

WhalePlay Launches Beta in Web3 Gaming Sector Without Token or Leadership Disclosure

By |2025-08-25T19:57:52+03:00August 25, 2025|News, NFT News|0 Comments


WhalePlay has officially launched its beta version on August 25, 2025, marking a key development in the Web3 gaming sector. The platform introduces a next-generation social iGaming experience, aiming to redefine engagement and user interaction in the blockchain gaming space [1]. Unlike traditional gaming platforms, WhalePlay integrates Web3 mechanics to enhance digital ownership and in-game economies, reflecting a broader trend of innovation in the sector.

Notably, the platform has launched without disclosing details about its leadership team or institutional backing [1]. This absence of executive information raises questions about governance and strategic direction, which could influence market perception and investor confidence. While WhalePlay has positioned itself as a forward-thinking platform, the lack of public profiles or statements from its leadership team limits transparency, making it difficult to assess the platform’s immediate impact on the market or community reactions [1].

The absence of a token or on-chain metrics further sets WhalePlay apart from similar Web3 gaming platforms. Many recent entrants in the space, such as Stake.com, have driven significant engagement through token incentives. However, WhalePlay appears to be taking a different approach, focusing on organic community building rather than speculative tokenomics [1]. Analyst insights suggest that the platform’s success may depend on its ability to attract a dedicated user base and establish a clear vision for growth, even in the absence of token-driven incentives [1].

Despite these strategic differences, WhalePlay’s beta launch signals a broader shift toward more sophisticated and decentralized gaming models. As blockchain technology continues to evolve, platforms like WhalePlay are exploring new ways to integrate user-generated value and digital ownership, potentially reshaping industry standards. However, the early-stage nature of the platform means that its long-term success will depend on how effectively it can address leadership visibility and maintain a strong user community [1].

In parallel, the Web3 gaming landscape is witnessing a surge in interest, with projects like Tapzi gaining traction through presale campaigns and structured roadmaps. These developments highlight the growing maturity of the sector, where innovation is increasingly driven by utility and user experience rather than short-term speculation [1]. As WhalePlay and similar platforms continue to evolve, their collective impact on the Web3 gaming ecosystem will likely become clearer, offering a glimpse into the future of decentralized entertainment.

Source: [1] Next-Gen GameFi Token Tapzi Reaches Crypto Whales (https://www.mexc.co/en-IN/news/next-gen-gamefi-token-tapzi-reaches-crypto-whales-this-week/71691)


Source link

Go to Top