Solana price is showing early trend reversal signals after breaking a multi-month downtrend, with analysts watching strong on-chain growth and a potential reclaim of the $160 resistance.
Solana price is showing early signs of structural improvement after breaking out of a multi-month downtrend, with price now trading near the $134–$135 region. The move has drawn renewed attention from traders as both technical structure and on-chain activity begin to align more constructively.
This shift in momentum comes as broader crypto markets remain range-bound, placing greater focus on individual assets showing relative strength. For Solana, the combination of trendline breaks, improving momentum indicators, and rising on-chain volumes is shaping a more optimistic near-term outlook.
Solana Breaks Downtrend
From a technical perspective, Solana has recently pushed above a descending trendline that has capped price action since October. Crypto analyst CryptoCurb highlighted that SOL is “breaking out of the downtrend since October,” noting that this move marks the first meaningful change in structure after months of lower highs.
Solana breaks above a multi-month descending trendline. Source: CryptoCurb via X
On the price chart, SOL is now holding above the $130–$132 region, an area that previously acted as resistance during the downtrend. This level has flipped into short-term support, suggesting that sellers are losing control at these prices. As long as SOL holds above this zone, pullbacks may be treated as corrective.
Support Holds Near $125
Market participants are also paying close attention to the strength of the current support base. Analyst Degen_Hardy noted that SOL has “held this support for almost two months,” adding that the structure is gradually improving rather than deteriorating. His chart highlights a well-defined demand zone between $120 and $125, where buyers have consistently stepped in.
Solana holds firm above the $120–$125 support zone, keeping upside scenarios towards $150–$160 in focus. Source: Degen_Hardy via X
From a risk perspective, this zone remains critical. A sustained move below $120 would weaken the bullish case and reopen downside risk towards the $110 area. However, as long as SOL remains above this support, the probability favors consolidation or continuation higher rather than a renewed selloff.
On the upside, participants are watching the $145–$150 region as the next resistance cluster, followed by a more decisive level near $160. A daily close above $160 would mark a broader trend shift, aligning with previous high-timeframe resistance.
On-Chain Volume Signals Structural Strength
Beyond price action, The Kobessi Letter highlighted a major structural shift taking place beneath the surface. According to their data, Solana’s on-chain spot volume officially overtook nearly all off-chain exchanges in 2025, reaching approximately $1.6 trillion.
Solana’s on-chain spot volume surges to $1.6T. Source: The Kobessi Letter via X
Since 2022, Solana’s on-chain volume has expanded from just 1% of total crypto trading activity to nearly 12%, reflecting a significant migration of activity directly onto the network. The Kobessi Letter also noted that Solana surpassed major centralized venues such as Coinbase Global and Bybit in total volume, while Binance’s market share has declined notably over the same period.
This on-chain dominance adds an important layer to any Solana price prediction, as rising organic network usage often supports longer-term valuation.
Treasury Behavior Hints at a Local Bottom
Adding further context, famous analyst TedPillows suggested that Solana treasury-linked stocks may be signaling a local bottom. His analysis shows that selling pressure from treasury-related entities has slowed significantly, a pattern that historically aligns with exhaustion phases in broader corrections.
Solana-linked treasury stocks show slowing sell pressure, a pattern that has historically signaled local bottoms and accumulation phases. Source: TedPillows via X
Ted’s chart compares multiple Solana-related equities and instruments, highlighting how similar drawdowns in past cycles eventually resolved into accumulation ranges before stronger directional moves emerged. While he cautions that this does not guarantee immediate upside continuation, the reduction in persistent selling pressure removes a key risk factor that had weighed on SOL during its decline.
Price Predictions and Outlook
Short-term projections for Solana remain mixed, largely dependent on whether SOL can sustain acceptance above its broken downtrend and key support zones. As of now, holding above $125 keeps the structure constructive, while a clean move through $150 could accelerate upside momentum toward higher resistance zones.
Solana current price is $134.50, up 1.54% in the last 24 hours. Source: Brave New Coin
Longer-term Solana price prediction scenarios vary widely. More conservative outlooks focus on gradual recovery toward previous consolidation levels, while optimistic projections factor in continued on-chain growth, ecosystem adoption, and expanding real-world usage. In stronger macro conditions, some models explore paths back towards the $200 region, though such outcomes depend heavily on sustained volume confirmation and broader market participation.
Final Thoughts
Solana’s current setup reflects a convergence of improving technical structure, declining sell pressure, and expanding on-chain activity. While the asset is still recovering from a prolonged correction, the combination of trendline breaks, defended support, and organic network growth suggests that downside risks have moderated.
For now, market watchers remain focused on whether the Solana price can continue building above its current base. Acceptance above key resistance levels would strengthen the bullish narrative, while failure to hold support would delay broader recovery expectations.
Gold price (XAU/USD) climbs to around $4,370 during the early Asian trading hours on Monday. The precious metal extends its upside amid a renewed surge in geopolitical risk after the United States’ (US) capture of Venezuelan President Nicolas Maduro. Traders will closely monitor developments surrounding the US seizure of Maduro and await the US ISM Manufacturing Purchasing Managers’ Index (PMI) data later on Monday.
CNN reported over the weekend that the US President Donald Trump administration called a “large-scale strike against Venezuela” and captured its President Maduro to face charges. This action came without the approval of Congress. Trump added that the US will be running Venezuela until it can do a safe, proper, and judicious transition.
On Sunday, US Secretary of State Marco Rubio said the US will use leverage over oil to force further change in Venezuela. The US attack on Venezuela is expected to trigger geopolitical tensions in the region and fuel the uncertainty. This, in turn, could boost traditional safe-haven assets such as Gold.
The recent Federal Open Market Committee (FOMC) Minutes showed that most US Federal Reserve (Fed) officials saw further interest-rate reductions as appropriate so long as inflation declines over time, though they remained divided over when and how far to cut. Lower interest rates could reduce the opportunity cost of holding Gold, supporting the non-yielding precious metal.
The release of the US December employment report will be in the spotlight later on Friday. The market consensus forecast for Nonfarm Payrolls (NFP) is for a gain of 57,000 jobs. In case of a stronger-than-expected outcome, this could strengthen the US Dollar (USD) and weigh on the USD-denominated commodity price in the near term.
Gold FAQs
Gold has played a key role in human’s history as it has been widely used as a store of value and medium of exchange. Currently, apart from its shine and usage for jewelry, the precious metal is widely seen as a safe-haven asset, meaning that it is considered a good investment during turbulent times. Gold is also widely seen as a hedge against inflation and against depreciating currencies as it doesn’t rely on any specific issuer or government.
Central banks are the biggest Gold holders. In their aim to support their currencies in turbulent times, central banks tend to diversify their reserves and buy Gold to improve the perceived strength of the economy and the currency. High Gold reserves can be a source of trust for a country’s solvency. Central banks added 1,136 tonnes of Gold worth around $70 billion to their reserves in 2022, according to data from the World Gold Council. This is the highest yearly purchase since records began. Central banks from emerging economies such as China, India and Turkey are quickly increasing their Gold reserves.
Gold has an inverse correlation with the US Dollar and US Treasuries, which are both major reserve and safe-haven assets. When the Dollar depreciates, Gold tends to rise, enabling investors and central banks to diversify their assets in turbulent times. Gold is also inversely correlated with risk assets. A rally in the stock market tends to weaken Gold price, while sell-offs in riskier markets tend to favor the precious metal.
The price can move due to a wide range of factors. Geopolitical instability or fears of a deep recession can quickly make Gold price escalate due to its safe-haven status. As a yield-less asset, Gold tends to rise with lower interest rates, while higher cost of money usually weighs down on the yellow metal. Still, most moves depend on how the US Dollar (USD) behaves as the asset is priced in dollars (XAU/USD). A strong Dollar tends to keep the price of Gold controlled, whereas a weaker Dollar is likely to push Gold prices up.
US ISM Manufacturing PMI and Fed Speakers in Focus
Later on Monday, US private sector PMI figures are likely to influence demand for the US dollar and the USD/JPY pair. Economists forecast the ISM Manufacturing PMI to increase from 48.2 in November to 48.3 in December.
Typically, a less pronounced contraction, rising employment, and higher prices support a less dovish Fed policy stance, which would lift demand for the US dollar. While the sector accounts for around 10% of the US GDP, the underlying PMI data provide insights into the effect of tariffs and the higher interest rate backdrop on prices.
Last week, the less influential S&P Global US Manufacturing PMI revealed that tariffs continued to drive prices higher, suggesting a more hawkish Fed policy stance. However, the ISM Services PMI, due out on January 7, will be key, given that the sector accounts for roughly 80% of US GDP and is the key inflation contributor.
While the PMI data will influence US dollar demand, Fed commentary remains key for USD/JPY trends. Increased calls to cut rates to bolster the labor market would dampen demand for the US dollar, pushing USD/JPY lower.
According to the CME FedWatch Tool, the probability of a March Fed rate cut increased from 51.1% on January 2 to 54.0% on January 3.
Looking ahead, expectations of further BoJ rate hikes, a new Fed Chair, potentially favoring lower rates, and a cooling US labor market remain key drivers. These scenarios continue to support a bearish short- to medium-term outlook for USD/JPY.
Technical Outlook: USD/JPY on a Downward Trajectory
For USD/JPY price trends, technicals, and fundamentals will continue to require close monitoring.
Looking at the daily chart, USD/JPY traded above its 50-day and 200-day Exponential Moving Averages (EMAs), signaling a bullish bias. While technicals remained bullish, bearish fundamentals are developing, outweighing the technical structure.
A break below the 155 support level and the 50-day EMA would indicate a bearish near-term trend reversal. A sustained fall through the 50-day EMA would expose the 200-day EMA. If breached, 150 would be the next key support level.
Crucially, a sustained fall through the 50-day and 200-day EMAs would reinforce the bearish price outlooks for USD/JPY.
The crypto market is moving through a phase where patience matters more than momentum. Large-cap assets are consolidating, and traders are reassessing risk after weeks of uneven price action.
That shift is showing up clearly in major names, with the Solana price prediction turning cautious as short-term charts weaken, while the Binance coin price remains locked in a tight range despite strong network growth.
As these established names struggle, attention is shifting toward early-stage projects that are attracting demand through structure rather than speculation. One of those is Zero Knowledge Proof (ZKP), which is gaining visibility as a potential next big crypto due to its live presale auction and strict anti-whale rules.
Together, these three cases highlight how sentiment, structure, and distribution are shaping current market decisions.
Solana Price Prediction Turns Cautious as Short-Term Pressure Builds
The Solana price prediction has shifted toward caution as SOL enters a critical phase on the 4-hour chart. Price action shows SOL trading below the 20, 50, 100, and 200 exponential moving averages, confirming short-term bearish momentum. Lower highs and lower lows continue to shape the trend, while the Supertrend indicator remains in sell mode, reinforcing downside pressure.
SOL is currently hovering near the $127 support zone, which has become the immediate level to watch. Holding above this area could allow a short-lived rebound, but upside attempts face strong resistance near $131 and again around $134. Failure to reclaim these levels keeps sellers in control. On the downside, a rejection could send SOL toward $124, with a deeper move exposing the $121.7 support area.
Derivatives data support this cautious view. Futures open interest has cooled to around $7 billion, signaling a deleveraging phase after earlier leverage-driven rallies. This reduction in exposure reflects risk trimming rather than fresh buying interest, keeping the near-term outlook guarded.
Binance Coin Price Stays Range-Bound on Network Growth
The Binance coin price is trading in the $870 to $880 range after a recent pullback, holding a well-defined support zone as the market waits for direction. Price action has compressed into a narrow band, reflecting consolidation rather than a strong trend. Short-term momentum remains soft, with several exponential moving averages still sloping lower and RSI holding near the mid-40s, a level that often signals balance between buyers and sellers.
While price is paused, fundamentals continue to strengthen. Activity on BNB Chain has expanded sharply, with transaction counts, active addresses, and DeFi usage all posting solid gains over the past quarter. Stablecoin liquidity has also increased, helping support overall network health.
Some analysts are beginning to point out constructive technical signals, including a potential long setup supported by Fibonacci retracement levels and improving oscillator behavior. For now, the Binance coin price remains range-bound, with a break above $920 or below $850 likely to determine the next move.
Anti-Whale Design Fuels Urgency Around Zero Knowledge Proof
Zero Knowledge Proof (ZKP) is increasingly being discussed as the next big crypto, and much of that attention is tied to how its presale auction is structured to ensure fairness, rather than pure speculation. The presale auction is live, and participation has been building quickly as buyers realize supply cannot be dominated by a few large wallets.
ZKP enforces a strict anti-whale rule, capping daily purchases at $50,000 per wallet. This design forces broader distribution and has created urgency, since large players cannot simply step in and absorb entire allocations. That urgency is visible in the presale auction itself.
Each day resets with a fresh 200 million token allocation and pricing that adjusts with demand, meaning missed sessions cannot be reclaimed later. Buyers are moving in early instead of waiting, knowing access tightens as participation increases. What adds another layer of confidence is that interest is not limited to tokens. Proof Pods are being purchased alongside auction entries, showing that users want to operate inside the network, not just hold exposure.
Proof Pods are physical devices that perform verifiable compute and earn ZKP through real workload contribution. Momentum accelerated further after confirmation that the first Proof Pod has already been delivered to Australia, proving deployment is underway and not theoretical. This milestone has reinforced the idea that ZKP is already transitioning from setup to execution.
Together, the anti-whale mechanics, live presale auction, and rising Proof Pod demand are shaping strong early pressure. For many buyers, that combination is why Zero Knowledge Proof is being watched closely as the next big crypto, while access is still open.
Key Takeaways
The Solana price prediction and Binance coin price both reflect a market in pause mode, where traders are cautious and waiting for confirmation. SOL faces pressure near key support, while BNB consolidates despite strong on-chain growth.
In contrast, Zero Knowledge Proof is attracting attention as the next big crypto through its anti-whale presale design, live presale auction structure, and growing Proof Pod participation.
With daily purchase caps, active deployment, and rising demand, ZKP is offering a different kind of momentum. For buyers weighing timing, structure, and access, these differences are shaping where attention is flowing while broader markets remain undecided.
Disclaimer: The statements, views and opinions expressed in this article are solely those of the content provider and do not necessarily represent those of 2 Urban Girls. 2 Urban Girls is not responsible for the trustworthiness, quality, accuracy of any materials in this article. This article is provided for educational purposes only. 2 Urban Girls is not responsible, directly or indirectly, for any damage or loss caused or alleged to be caused by or in connection with the use of or reliance on any content, goods or services mentioned in this article. Do your research and invest at your own risk.
Have you thought about playing the best NFT games and earning rewards while having fun? An NFT game gives you a chance to earn digital assets you actually own, trade, or sell, instead of just playing for points that disappear. These games are revolutionizing the way we think about gaming by combining entertainment with real-world value.
In this article, we are diving into how to choose the best NFT games, how to start playing them, and the key trends shaping the future of NFT gaming. Specifically, from earning opportunities to asset ownership and cross-game utility, we’ll cover everything you need to know to get started. Read on to find out.
Best NFT Games: Quick Comparison
Game
Launch Year
Key Features
Platform
Blockchain
Axie Infinity
2018
Players collect, breed, and battle fantasy creatures called Axies.
PC, Android, iOS
Ronin (Ethereum Sidechain)
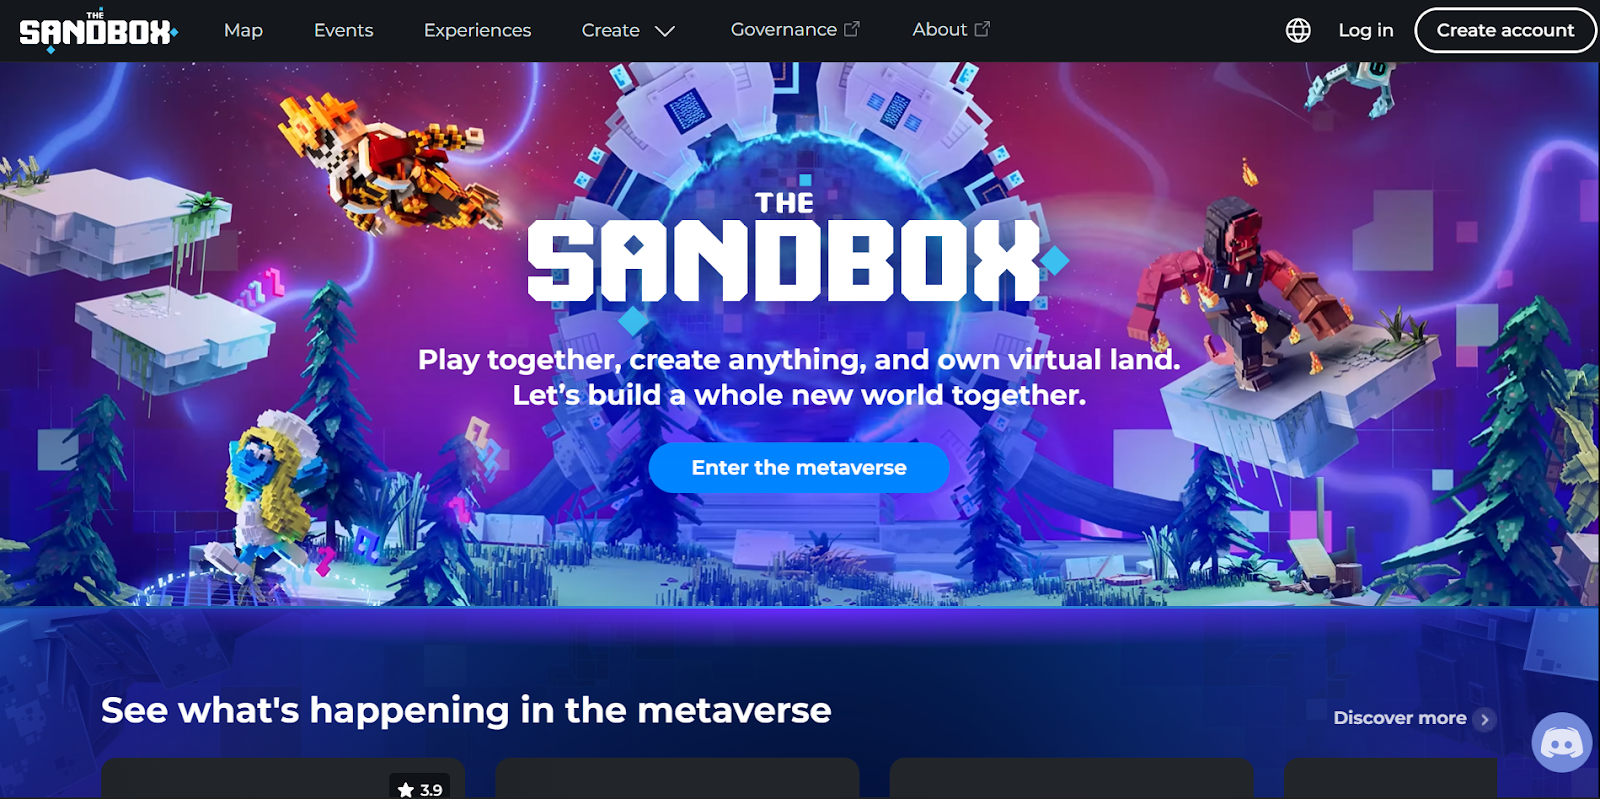
The Sandbox
2018
User‑generated voxel worlds, LAND/ESTATE ownership, NFT marketplace, Game Maker, social metaverse
PC, Mac
Ethereum / Polygon
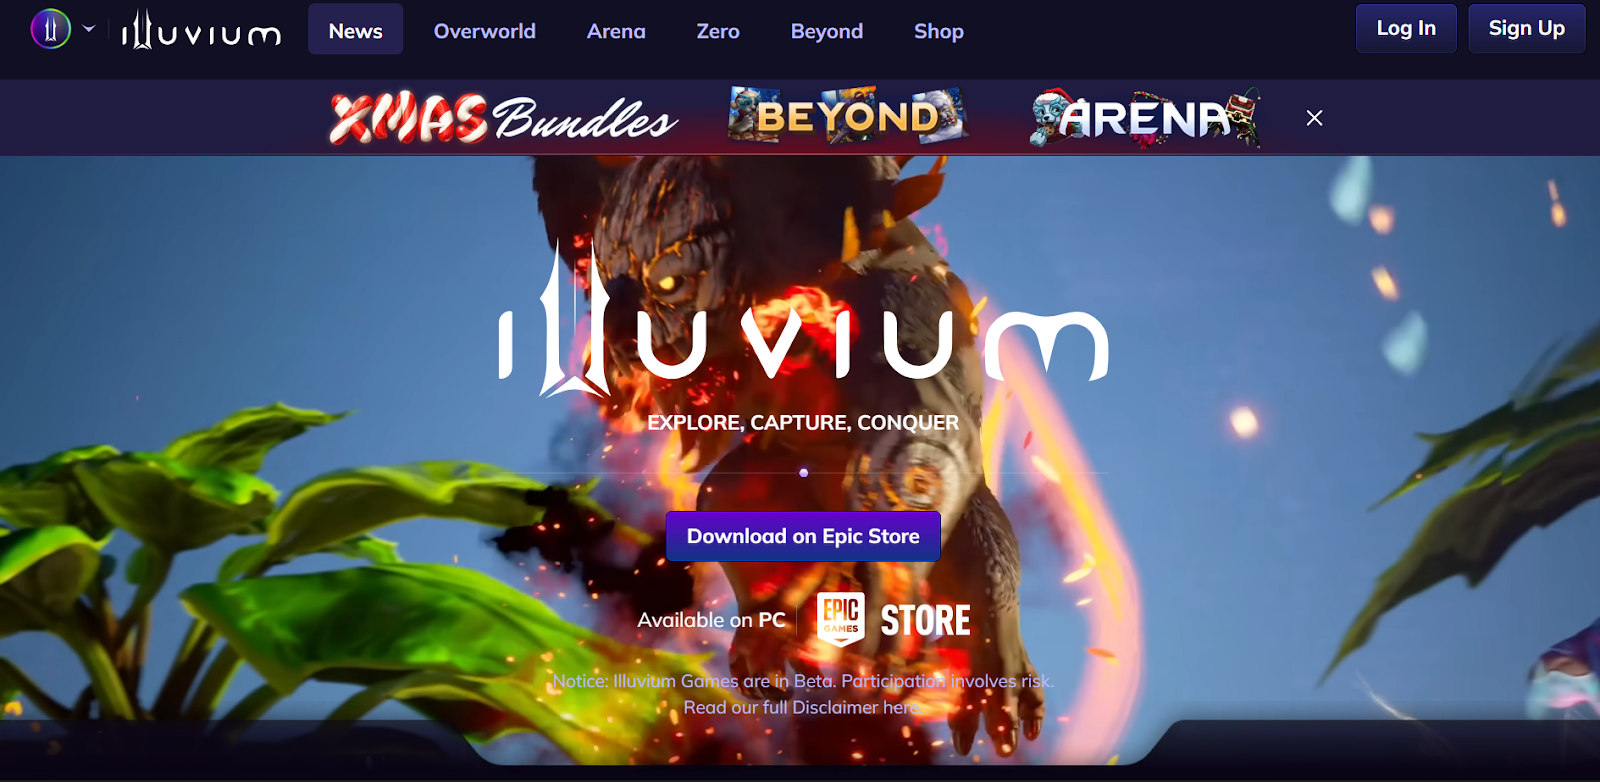
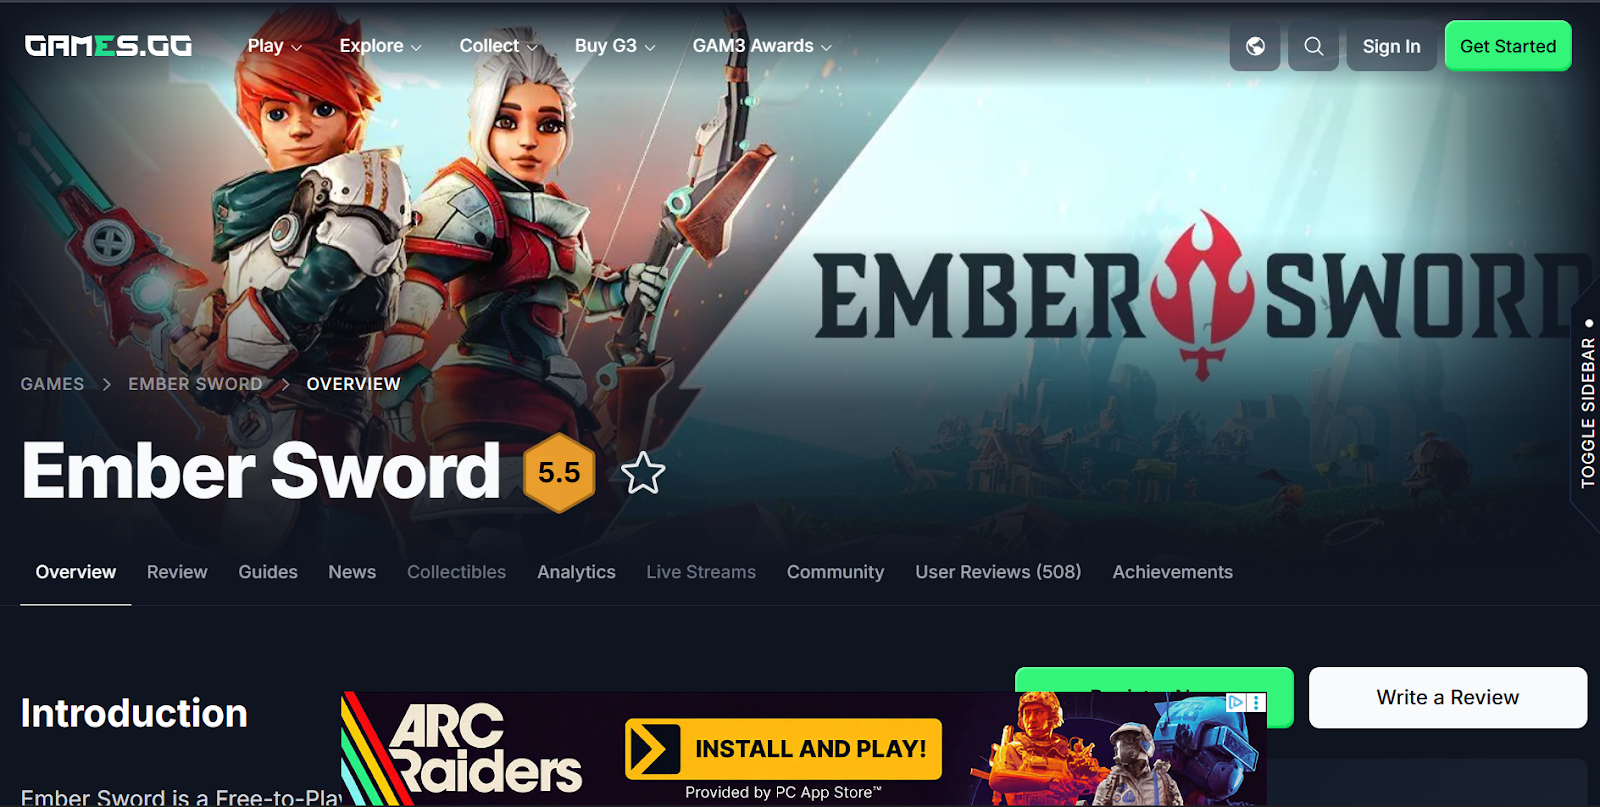
Illuvium
2024
A virtual metaverse where players can build, own, and monetize gaming experiences.
AAA RPG, capture/battle Illuvials (NFT creatures), auto‑battler, open world, DAO governance, IlluviDEX
Immutable X (Ethereum Layer 2)
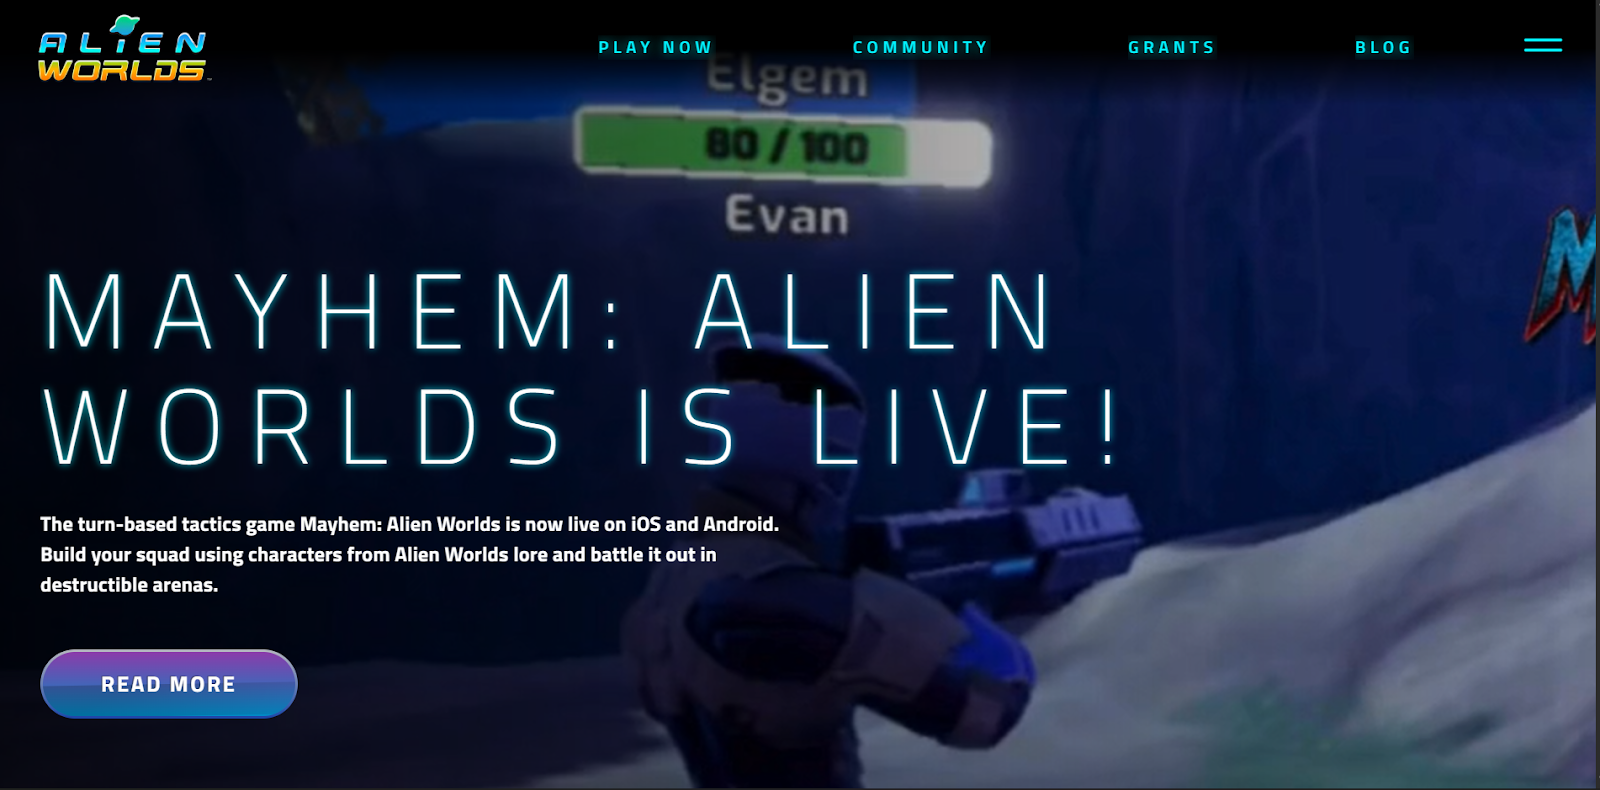
Alien Worlds
2020
Open-world RPG where players capture creatures called Illuvials.
Web, PC, Mobile (coming)
WAX, Ethereum, BNB Chain
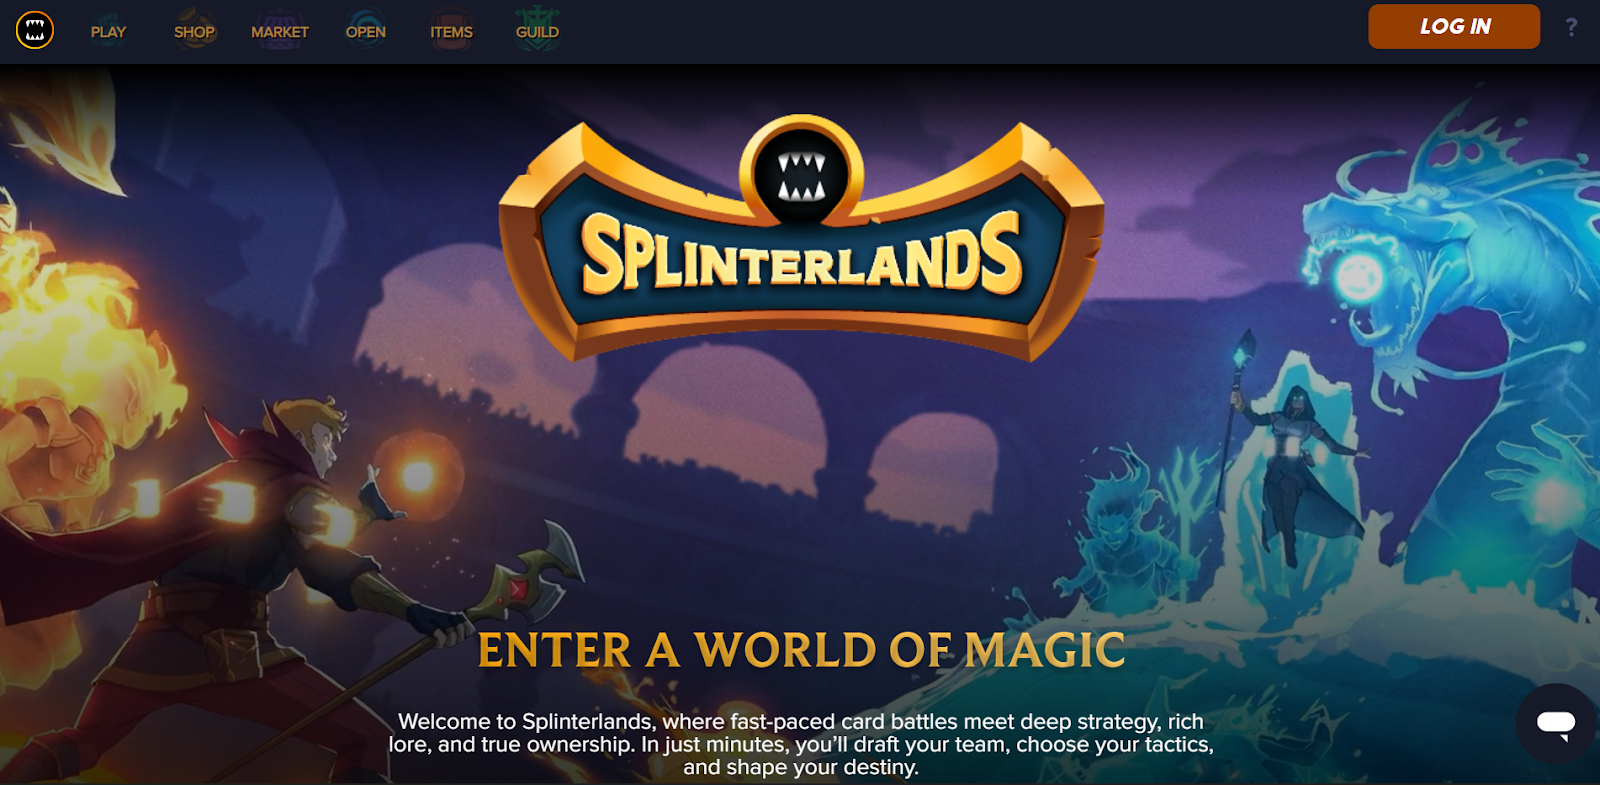
Splinterlands
2018
Collectible card game with automated battles.
Web Browser, Mobile
Hive
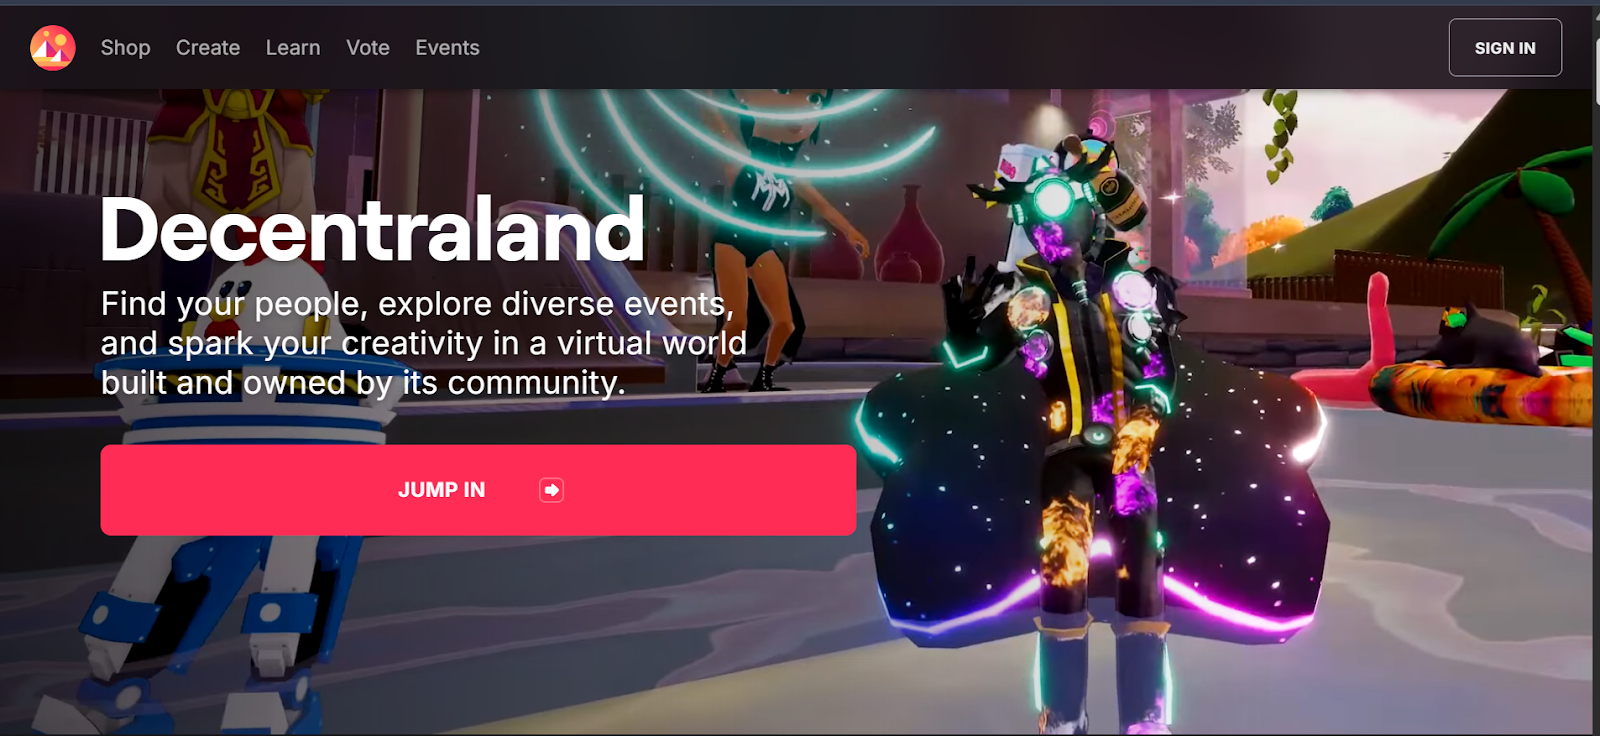
Decentraland
2020
Decentralized 3D virtual reality platform with land ownership as NFTs.
Web Browser, PC, Mac
Ethereum
Nifty Island
2024
Social gaming platform with customizable islands and NFT interoperability.
AAA first-person shooter with player-created assets.
PC
Avalanche
10 Best NFT Games to Play and Earn in 2026
NFT gaming in 2026 is more mature, more stable, and more focused on real player value than it was a few years ago. You are no longer choosing between fun and earning potential. The best NFT games now combine engaging gameplay with systems that reward time, skill, and smart decisions. Some titles focus on competition, others on strategy or collecting, but all of them give you a chance to earn assets you can actually own. Below, we start with a game that helped define the play to earn games space and still sets the standard for how players can make money playing games.
1. Axie Infinity
Axie Infinity remains one of the most recognized NFT video games because it blends strategy, ownership, and a working player economy. In the game, you build a team of creatures called Axies, each with unique abilities that affect how they perform in battles. These Axies are NFTs, which means you fully own them and can trade them with other players on the marketplace.
Gameplay revolves around turn based combat, daily tasks, and competitive matches against other players. Winning battles and staying active allows you to earn in game tokens that can be used inside the game or exchanged outside of it. Another major part of the experience is breeding. You can combine Axies to create new ones, then sell those Axies to other players who want specific traits or stronger teams. This makes trading nfts a central part of how players earn.
Axie Infinity runs on the Ronin blockchain, which was built to support fast transactions and low fees. This makes it easier for you to manage assets without losing value to high costs. In addition, the game also uses Axie Infinity Shards, known as AXS, which lets players take part in governance and long term decisions around the project.
If your goal is to profit from playing Axie Infinity, there are multiple earning paths. You can focus on competitive play, smart breeding, or marketplace activity. Success takes learning and patience, but for players who invest time into understanding the system, Axie Infinity continues to be one of the strongest earning focused NFT games available in 2026.
2. The Sandbox
The Sandbox is a crypto gaming platform for players who enjoy creativity and ownership. Instead of focusing on combat or progression, this game centers on building, designing, and trading digital experiences. You explore a virtual world made up of land parcels, known as LAND, which are NFTs owned by players. Each piece of land can be developed into exciting games, social spaces, or interactive experiences that other players can visit.
Gameplay in The Sandbox revolves around creation and participation. You can design characters, objects, and environments using the game’s tools, then turn those creations into NFTs. These assets can be sold or traded in the marketplace, giving you a clear path to earning through creativity rather than competition. Many players focus on designing popular experiences or rare items that attract demand from other users.
Understanding how to buy nft assets is key to getting started. Typically, you need a crypto wallet and the platform’s native token to buy items from the marketplace. Once purchased, these NFTs belong to you and can be held, traded, or used to build experiences inside the game. Ownership is recorded on the blockchain, which helps keep transactions transparent and secure.
The Sandbox uses its own token to handle in game activity, rewards, and governance. This allows players to take part in decisions that shape the platform’s future. Strong partnerships with brands, artists, and creators have helped keep the ecosystem active and relevant.
3. Illuvium
When you think about combining stunning visuals with the chance to generate profit through gameplay, Illuvium stands out as a top contender. This open-world role-playing game (RPG) immerses you in a beautifully designed alien planet where you can explore, battle, and collect creatures known as Illuvials. Each Illuvial is a unique NFT, giving you full ownership and the ability to trade them on some of the best NFT marketplaces.
Illuvium’s gameplay is a mix of exploration and strategy. You’ll venture across diverse landscapes, capturing Illuvials and assembling a powerful team to compete in battles. They’re NFTs that you can sell or trade, offering a real opportunity to earn. The game operates on the Ethereum blockchain, ensuring secure transactions and ownership of your digital assets.
To get started, you’ll need a crypto wallet and some Ethereum to participate in the game’s economy. Illuvium also features its own token, ILV, which can be used for staking, governance, and rewards. The game’s marketplace is a hub for trading Illuvials, weapons, and other in-game items, making it one of the best NFT marketplaces for players looking to profit from their gaming efforts.
Illuvium’s combination of high-quality graphics, engaging gameplay, and financial opportunities has made it a favorite among gamers and crypto enthusiasts alike. Whether you’re exploring the alien world or trading NFTs, Illuvium offers a unique blend of entertainment and earning potential, making it a must-try for anyone interested in the future of gaming.
4. Alien Worlds
Alien Worlds is a blockchain based game that places you inside a virtual metaverse built around exploration and resource collection. The game is set across multiple planets, each with its own economy, rules, and community. As a player, you choose a planet to align with and take part in activities that help you earn rewards while shaping how that planet develops.
Gameplay in Alien Worlds is simple to understand, which makes it accessible to new players. You mine for resources using tools that exist as NFTs. Each tool has different strengths, and choosing the right one affects how often and how much you earn. The resources you collect are tokens that can be used within the game or traded outside of it. This structure allows you to earn value through consistent participation rather than complex mechanics.
What makes Alien Worlds stand out is how it blends governance with gameplay. Planets are controlled by decentralized organizations, which means players can vote on decisions that affect rewards, rules, and future game development. This creates a sense of shared ownership inside the virtual metaverse and gives players a voice beyond just playing the game.
NFTs in Alien Worlds include tools, land, and other assets that can be traded with other players. For example, land owners earn rewards when players mine on their land, which opens another path for earning through ownership instead of active play. This adds depth to the economy and rewards long-term planning.
5. Splinterlands
Splinterlands is a captivating card-based strategy game that has gained immense popularity among fans of free NFT games. This blockchain-powered game allows you to collect, trade, and battle with digital cards, each of which is a unique NFT. The game’s focus on strategy and skill makes it an engaging experience for players of all levels.
In Splinterlands, you will build a deck of cards featuring various characters, abilities, and stats. These cards are not just in-game assets. They are NFTs that you fully own and can trade or sell on the game’s marketplace. The battles are fast-paced and require careful planning, as each match is influenced by the unique abilities of your cards and the rules of the game.
One of the standout features of Splinterlands is its accessibility. It is one of the few free NFT games that allows you to start playing without a significant upfront investment. While you can purchase additional cards to enhance your deck, the game offers plenty of opportunities to earn rewards through gameplay. Completing daily quests, winning battles, and participating in tournaments can earn you valuable in-game assets and cryptocurrency.
Splinterlands operates on the Hive blockchain, ensuring fast and secure transactions. The game’s marketplace is a hub for trading cards, where you can buy, sell, or rent cards to other players. This creates a dynamic economy that adds depth to the gameplay and provides opportunities to earn.If you are looking for a free NFT game that combines strategy, ownership, and earning potential, Splinterlands is a fantastic choice. Its engaging mechanics and player-driven economy make it a standout title in the world of blockchain gaming.
6. Decentraland
Decentraland is a virtual world that redefines the concept of free NFT games by offering a platform where you can create, explore, and trade within a decentralized metaverse. Built on the Ethereum blockchain, Decentraland allows you to own virtual land, design unique experiences, and monetize your creativity through NFTs.
In Decentraland, you can purchase virtual plots of land, known as LAND, which are represented as NFTs. These plots can be developed into anything you imagine, from interactive games to virtual art galleries or even digital storefronts. The platform’s user-friendly tools make it easy to bring your ideas to life, whether you are a seasoned developer or a beginner exploring the world of NFTs.
What sets Decentraland apart is its thriving marketplace, where you can trade LAND, wearables, and other digital assets. These NFTs are fully owned by you, giving you the freedom to sell or trade them as you see fit. The platform uses its native cryptocurrency, MANA, for transactions, which you can acquire through exchanges or earn by participating in the ecosystem. Decentraland also offers a social aspect, allowing you to interact with other players, attend virtual events, and explore user-generated content. It is a community-driven metaverse where creativity and ownership take center stage.
7. Nifty Island
Nifty Island is a social focused NFT game that blends creativity, exploration, and ownership in a way that feels accessible to both gamers and creators. The game centers on player owned islands, which act as personal spaces you can build, customize, and share with others. These islands are NFTs, meaning you fully own them and control how they are used inside the platform.
Gameplay in Nifty Island revolves around interaction and creation rather than combat. You can design your island using assets, games, and interactive elements, then invite other players to visit. Many players earn by hosting experiences, showcasing digital art, or building mini games that attract traffic. The more engaging your island is, the more opportunities you have to earn through rewards and marketplace activity.
Nifty Island also connects closely with the broader NFT ecosystem. You can display NFTs you already own from other collections, turning your island into a personal gallery or social hub. This makes the game appealing if you are active in NFT communities and want a space that reflects your identity. Assets created or used on the platform can be traded, giving players flexibility in how they approach earning.
From an earning perspective, Nifty Island appeals to players who want options beyond grinding or competition. You can earn through island ownership, event participation, and creative contributions. This makes it attractive to players who enjoy social interaction and long term building rather than fast paced gameplay.
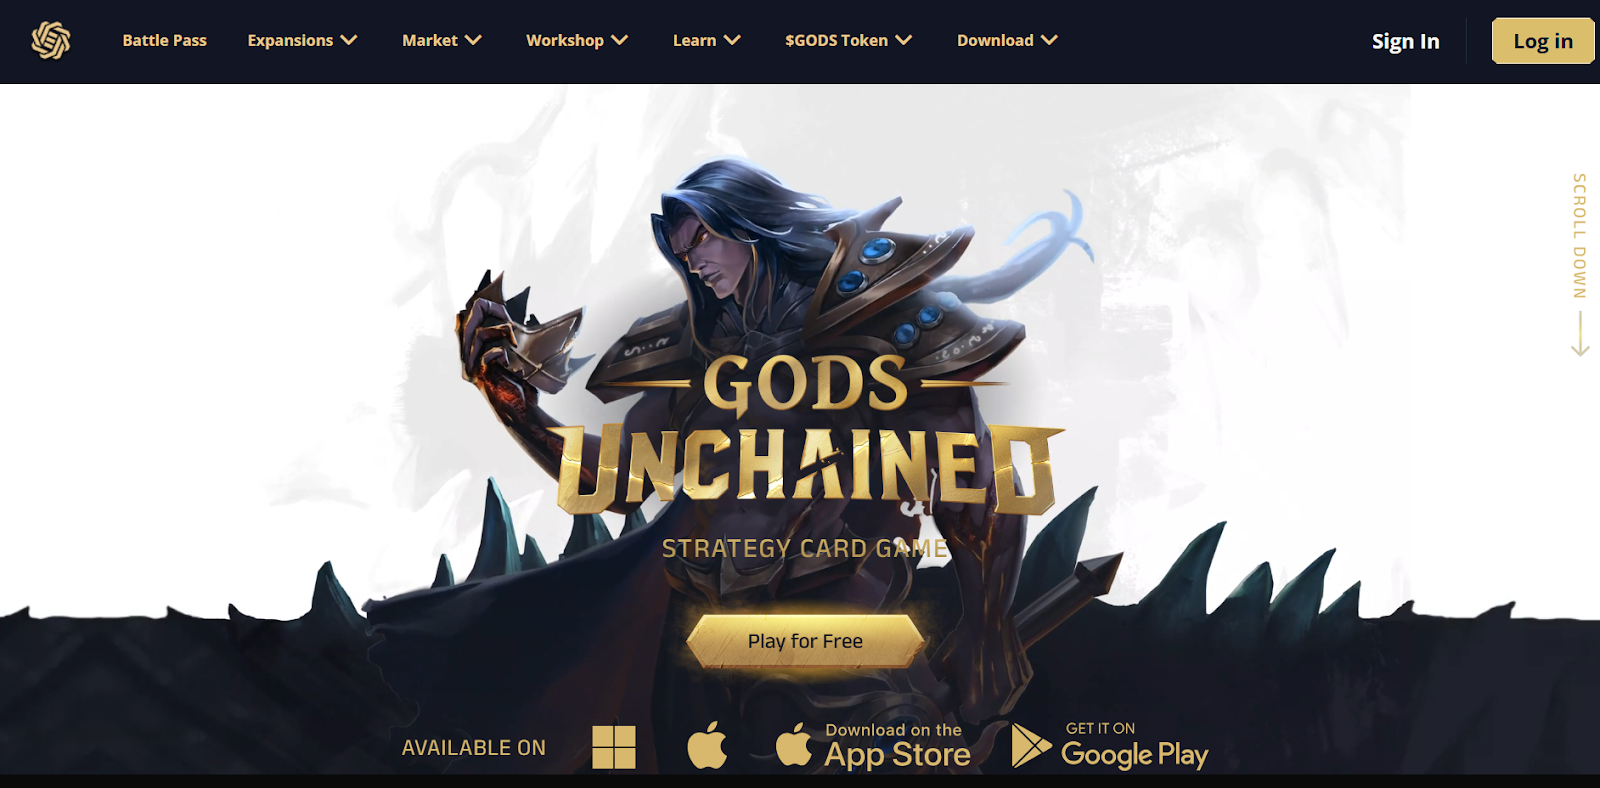
8. God Unchained
Gods Unchained is a competitive card game that has carved its place among the most popular NFT video games. Designed for players who enjoy strategy and skill-based gameplay, this blockchain-powered game allows you to collect, trade, and battle with digital cards, each of which is a unique NFT. The game’s focus on ownership and fair play has made it a favorite among gamers and crypto enthusiasts alike.
In Gods Unchained, you build a deck of cards featuring gods, spells, and creatures, each with unique abilities. Every card is an NFT that you fully own, giving you the freedom to trade or sell them on the game’s marketplace. Winning battles and completing challenges can earn you additional cards and rewards, adding depth and excitement to the gameplay.
The game operates on the Ethereum blockchain, ensuring secure transactions and true ownership of your digital assets. Gods Unchained also uses Immutable X, a layer-2 scaling solution, to provide gas-free transactions, making it easier for you if you are getting started with Gods Unchained. This seamless integration of blockchain technology enhances the gaming experience. What sets Gods Unchained apart is its emphasis on fair play. Matches are skill-based, ensuring that your success depends on strategy rather than the size of your wallet. This approach has attracted a dedicated community of players who value both the competitive aspect and the opportunity to own and trade NFTs.
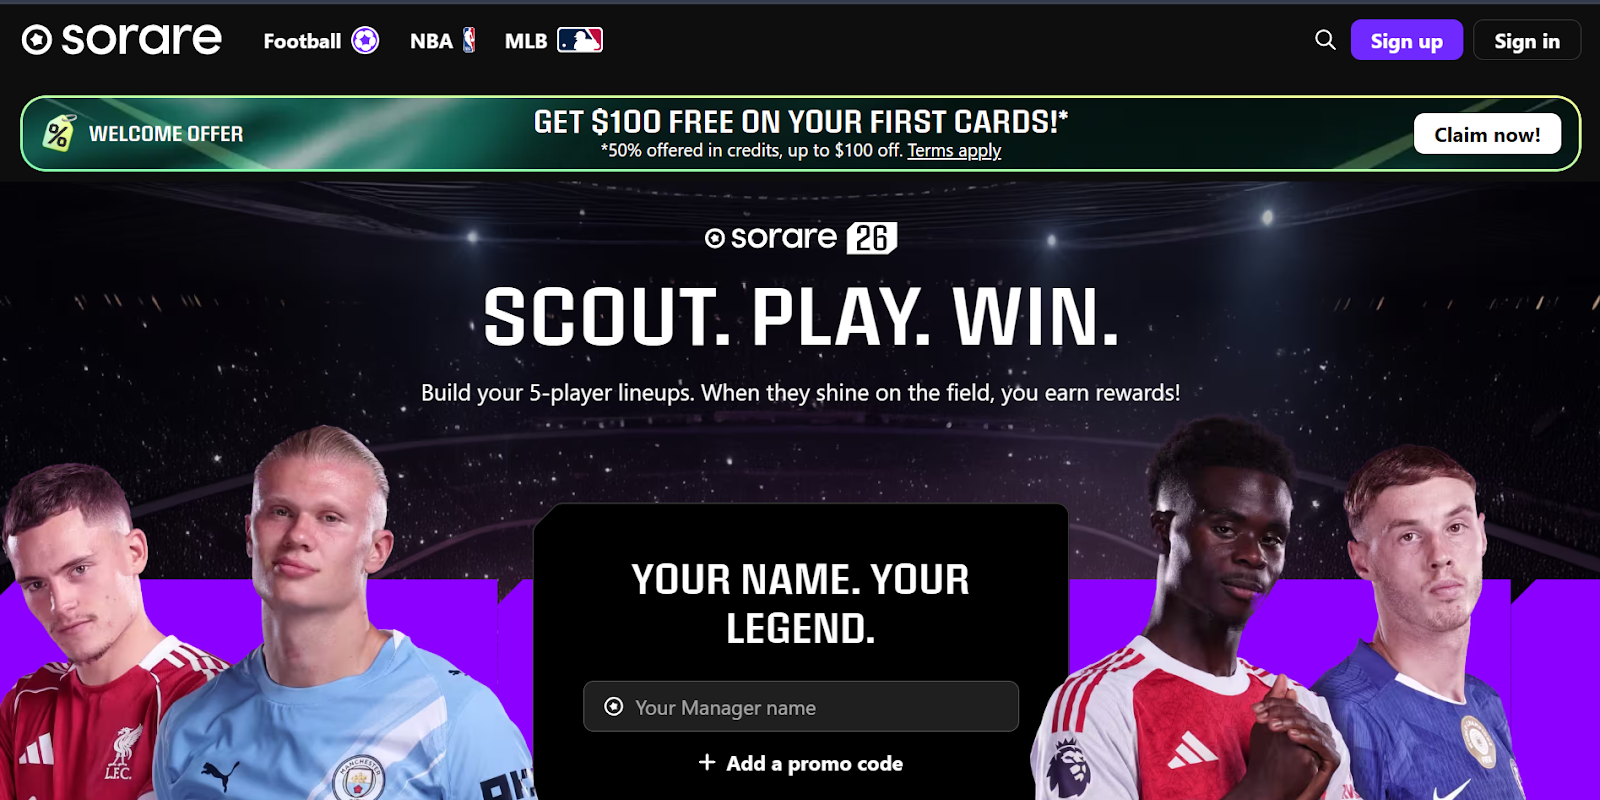
9. Sorare
Sorare is a sports focused NFT game built around real world football, baseball, and basketball. Instead of controlling characters in a virtual world, you collect digital player cards that are tied to real athletes and their actual performance. Each card is an NFT with different levels of rarity, which affects how competitive and valuable it can be.
Gameplay is based on fantasy style tournaments. You create teams using your cards and earn points based on how those athletes perform in real matches. Strong performance leads to rewards, which can include new cards or digital prizes with real value. This structure rewards knowledge, research, and smart decision making rather than fast reflexes.
Trading plays a major role in Sorare. You can buy, sell, or trade cards on the marketplace, and many players focus on spotting undervalued players early. Because the cards are limited and tied to licensed teams and leagues, demand stays consistent. This makes Sorare appealing to sports fans who enjoy strategy and long term planning.
Sorare is easy to understand and does not rely on complex mechanics. When you enjoy sports analytics and collecting, it offers a clear and skill driven way to earn through NFT ownership without needing to grind gameplay for hours.
10. Shrapnel
Shrapnel is a tactical first person shooter built around blockchain technology and player owned items. The game puts you in fast paced combat scenarios where gear, weapons, and cosmetic items are NFTs you can buy, sell, or trade. Instead of simply earning points or achievements, you earn assets that have real world demand because other players want them.
Gameplay in Shrapnel focuses on skill and strategy. You complete matches, earn rewards based on performance, and unlock rare items that can be listed on NFT marketplaces. Because these assets are blockchain based, you truly own what you earn. This approach gives you a clear path for earning through competitive play and trading NFTs rather than only through in game progression.
Buying and selling NFTs in Shrapnel is straightforward once you connect a digital wallet. The marketplace lets you see what items are listed, compare prices, and choose when to trade. This makes it easier for you to turn your in game success into tangible value outside the game world.
Shrapnel also emphasizes community and competition. Events, tournaments, and seasonal content keep the gameplay fresh and give players more chances to earn valuable rewards. After seeing what some of the top NFT games look like, it’s time to think about what fits you best. Your goals, budget, and playing style should guide your choice more than hype or trends.
How Do NFT Games Work?
NFT games are digital games that let you own in game items instead of just using them. In NFT video games, things like characters, skins, weapons, or land exist as non fungible tokens, also called NFTs. These NFTs exist on a blockchain, which is a shared digital record that shows who owns what. Because of this, the items you earn are yours, not the game company’s. You can keep them, trade them, or sell them if other players want them.
When you play NFT games, you interact with both gameplay and an economy. You complete tasks, win matches, explore worlds, or build assets, and the game rewards you with NFTs or crypto tokens. These rewards have value because they can be used in game or traded outside the game. This is why many NFT video games are known as top play-to-earn games. Your time and effort can lead to real rewards, not just progress on a screen.
Behind the scenes, NFT games use smart contracts, which are automatic programs that run on the blockchain. Smart contracts control how items are created, how rewards are given, and how ownership is tracked. When you earn an NFT, the blockchain records it under your digital wallet. This makes ownership clear and hard to fake. Games that manage this well often become the most profitable NFT games to earn money because players trust the system, and the market stays active.
Most NFT games follow similar working mechanics, even though the gameplay styles differ.
You connect a digital wallet to the game to store NFTs and tokens
You play the game by completing missions, battling, or trading assets
You earn NFTs or tokens based on skill, time, or strategy
You sell, trade, or reuse those assets to earn or improve gameplay
How to Choose the Best NFT Game
With the growing popularity of NFT games, choosing the right one can feel like navigating a maze. Your choice not only determines your entertainment but also your potential to earn. To make the most of your time and resources, it is essential to evaluate a few critical factors before diving in.
1. Gameplay Quality
The first thing to consider is the quality of the gameplay. A game should be engaging and enjoyable, offering more than just financial incentives. Look for games with immersive storylines, strategic depth, or unique mechanics that keep you coming back. A well-designed game ensures a loyal player base, which is crucial for the long-term value of its NFTs.
2. Earning Potential
For those aiming to profit from NFT assets, the earning potential of a game is a key factor. Investigate the play-to-earn model, how rewards are distributed, and what activities generate income. Some games offer rewards for completing tasks, while others provide passive income through asset ownership like virtual land. Understanding the game’s tokenomics is vital to assess its sustainability.
3. Community Engagement
A strong and active community often reflects the health of an NFT game. Check the game’s social media presence, forums, and Discord channels. A vibrant community not only enhances the gaming experience but also indicates the project’s credibility and potential for growth. Developers who actively engage with players are a big plus.
4. Blockchain and Wallet Compatibility
The blockchain on which the game operates plays a significant role in its performance. Games built on reliable blockchains like Ethereum, Solana, or Polygon offer better security and scalability. Additionally, ensure the game supports popular crypto wallets and has low transaction fees, as these factors directly impact your experience and earnings.
5. Marketplace Activity
An active marketplace is essential for trading and liquidating your NFTs. Before committing, explore the game’s marketplace to check transaction volumes and liquidity. A bustling marketplace ensures you can easily buy, sell, or trade assets, turning your in-game achievements into real-world financial gains.
How to Start Playing NFT Games
Getting started with NFT games is straightforward. Here are the key steps to help you start playing NFT games with clarity.
Step 1. Create a Digital Crypto Wallet
The first step is setting up a digital crypto wallet, which acts as your identity and bank account in the gaming ecosystem. It stores your cryptocurrencies and NFTs. Popular wallets include MetaMask for Ethereum-based games or Phantom for Solana. Always secure your recovery phrase offline to protect your assets.
Step 2. Choose the Right Game for You
Select a game that matches your interests. Whether you enjoy strategy, role-playing, or trading card games, there’s something for everyone. Research games with active communities and sustainable economies. You might wonder who blockchain games are designed for ; the answer is everyone, from casual players to hardcore strategists.
Step 3. Understand the Game Mechanics
Before investing, take time to understand the game’s rules, tokenomics, and reward systems. Many games offer tutorials or free-to-play modes, which are great for learning the basics without financial risk.
Step 4. Acquire Necessary NFTs or Tokens
Most NFT games require an initial investment, such as purchasing characters, land, or starter packs. You’ll need to buy the game’s native token or a major cryptocurrency like Ethereum, transfer it to your wallet, and use it to acquire assets from the game’s marketplace.
Step 5. Connect Your Wallet and Start Playing
Once you have your assets, connect your wallet to the game’s official website. This step usually involves clicking a Connect Wallet button and approving a request in your wallet app. After connecting, you can start playing, completing quests, or earning rewards.
Step 6. Engage with the Community
Join the game’s community on platforms like Discord or Twitter. Engaging with other players provides valuable tips, strategies, and updates. Active participation can also lead to exclusive events or drops that enhance your gaming experience.
Key Trends of NFT Games
NFT games continue to evolve as players demand better value, clearer ownership, and experiences that last beyond a single title. In 2026, the focus has shifted from short term hype to systems that reward commitment and creativity. Understanding these trends helps you spot games with real potential and avoid projects that lack direction. The most important changes center on how players earn, what they own, and how assets move across games.
Play to Earn (P2E)
Play to earn, often shortened to P2E, is one of the strongest forces shaping NFT gaming today. In P2E games, your time and skill translate into rewards you can actually use or trade. Instead of grinding for points that reset every season, you earn tokens or NFTs that hold value outside the game. This model attracts players who want their effort to matter. Game developers are also refining P2E systems to avoid inflation and burnout by rewarding smart play, competition, and long term participation rather than endless repetition.
Asset Ownership
Asset ownership is a core reason players choose NFT games over traditional ones. When you earn or buy an item, you own it fully. That ownership lives on the blockchain, not on a company server. You can trade items, sell them, or hold them for future use. This shift gives you control and flexibility. It also encourages healthier game economies, since players care more about assets they truly own.
Cross Game Utility
Cross game utility is becoming more important as the space matures. Some NFT games now design assets that work across multiple experiences. A character, item, or token earned in one game may unlock features or value in another. This approach protects your investment of time and money by extending the life of your assets. As more developers collaborate, cross game utility helps create connected ecosystems instead of isolated games.
Conclusion
The world of NFT games in 2026 offers a diverse range of opportunities for gamers, blending entertainment with the potential for real-world rewards. From strategy-based card games to immersive metaverse experiences, these games cater to various interests and skill levels. Choosing the right game involves evaluating factors like gameplay quality, earning potential, and community engagement. As blockchain technology continues to evolve, NFT games are set to become even more innovative and accessible. Gamers who embrace this trend can enjoy not only engaging gameplay but also the chance to own and trade unique digital assets, making the experience both fun and rewarding.
FAQs
NFT games can be profitable, but success depends on several factors, including the game’s economic model, your level of engagement, and market conditions. Many players earn through reward systems, where completing tasks or winning battles rewards them with tokens or NFTs. These assets can often be sold or traded for real money. However, profitability is not guaranteed, as the value of NFTs and tokens can fluctuate based on demand, game popularity, and broader cryptocurrency market trends.
The No. 1 NFT game is subjective and depends on what players value most, such as gameplay, earning potential, or community size. Axie Infinity is often regarded as a leading NFT game due to its robust play-to-earn model and active player base. Other popular contenders include The Sandbox, which focuses on virtual land ownership and creativity, and Gods Unchained, a strategy card game with competitive elements. The top game for you will depend on your interests and goals within the NFT gaming space.
Yes, it is possible to lose money playing NFT games. Many games require an initial investment in NFTs or tokens, and the value of these assets can decrease due to market volatility, changes in the game’s economy, or reduced player interest. Additionally, transaction fees for buying, selling, or trading NFTs can add up, further impacting your financial outcomes. It’s important to research the game thoroughly and only invest what you can afford to lose.
Yes, there are free NFT games that allow players to start without any upfront investment. These games often provide free starter characters, cards, or resources to help new players get started. Examples include Gods Unchained, which offers free card packs, and Splinterlands, where players can earn rewards without purchasing assets initially. While free NFT games can be a great way to explore blockchain gaming, earning potential may be limited compared to games that require an investment.
NFT games generate income through various revenue streams, including in-game purchases, transaction fees, and marketplace activity. Developers earn when players buy NFTs, such as characters, skins, or virtual land, directly from the game. Additionally, many games charge a percentage fee on transactions made in their marketplaces. Some games also generate revenue through tokenomics, where players use the game’s native cryptocurrency for purchases or staking. These mechanisms create a sustainable ecosystem that benefits both developers and players.
EQT Corp shares finished the first trading day of 2026 lower after U.S. natural gas futures slipped on forecasts for milder weather across the country. The largest U.S. gas producer closed down 0.3% at $53.46 on Friday. Baird Maritime / Work Boat World
The move matters because January is the heart of the U.S. heating season, when small shifts in temperature forecasts can swing demand and, by extension, gas prices and producer margins. Traders are also weighing record supply against the export pull from LNG terminals. Baird Maritime / Work Boat World
Gas prices set the revenue baseline for Appalachia-focused producers like EQT, which sell much of their output against the Henry Hub benchmark in Louisiana. That makes weather, storage and export flows immediate drivers for gas-linked equities heading into Monday’s reopen. Baird Maritime / Work Boat World
Front-month natural gas futures for February delivery fell 9.6 cents, or 2.6%, to $3.59 per million British thermal units (mmBtu) on Friday, Reuters reported. An mmBtu is a standard unit used to price gas. Baird Maritime / Work Boat World
Meteorologists see warmer-than-normal temperatures nationwide through Jan. 16, Reuters reported, pushing down “heating degree days,” a measure of how much energy is needed to heat buildings. Heating degree days fell from 413 earlier in the week to 369 by Friday, according to the report. Baird Maritime / Work Boat World
On the supply side, financial firm LSEG estimated average Lower 48 output rose to 110 billion cubic feet per day (bcfd) in December, topping a November record, Reuters said. LSEG also put December feedgas flows to the eight largest U.S. LNG export plants at a record 18.5 bcfd. (A bcfd is a daily volume measure.) Baird Maritime / Work Boat World
Gas-heavy peers moved unevenly with the commodity. Antero Resources fell 0.7% and Range Resources was little changed on Friday, while LNG exporter Cheniere Energy rose 1.8%.
Phil Flynn, senior analyst at Price Futures Group, pointed to shifting weather signals and a softer international backdrop for LNG. “There’s also some concern internationally… talk of a potential glut,” Flynn said. Baird Maritime / Work Boat World
But the downside case for producers is straightforward: if the warm pattern holds, futures can keep sliding as storage draws shrink. Ritterbusch Associates said February futures risk slipping back toward pre-Christmas lows around $3.47, while a colder-than-expected turn would tighten balances quickly and reverse the trade. Baird Maritime / Work Boat World
Investors’ next hard read is U.S. storage data: the Energy Information Administration’s weekly natural gas storage report is scheduled for Jan. 8, and the agency’s Henry Hub spot price series is next slated for an update on Jan. 7. Weather model runs into mid-January will remain the swing factor between those releases. U.S. Energy Information Administration
As the digital asset market moves deeper into 2026, scalability, speed, and real-world usability are defining which projects remain relevant. Solana continues to command attention due to its high-performance blockchain and expanding ecosystem, while Blazpay ($BLAZ) is emerging as a powerful presale token built to redefine how users interact with decentralized finance. Together, these narratives are shaping discussions around Crypto Presale 2026, especially as demand grows for platforms that combine infrastructure strength with advanced DeFi tools.
Solana’s price movements are often viewed as a benchmark for high-throughput networks, while Blazpay represents the next evolution of DeFi interaction through multi-chain efficiency and advanced trading capabilities. Blazpay is a next-gen DeFi platform redefining how users interact with decentralized finance. Designed for both everyday users and businesses, Blazpay combines powerful multi-chain capabilities, real-time trading, NFT support, and unified portfolio management, all through an intuitive, AI-powered interface.
For those tracking a presale token that aligns with the broader momentum of ecosystems like Solana, Blazpay’s ongoing presale is becoming one of the most discussed opportunities within Crypto Presale 2026.
Blazpay Phase 6 Crypto Presale Sets a New Market Benchmark
Blazpay Presale Phase 5 has officially concluded, and Phase 6 is now live with strong momentum. The Phase 6 price for Blazpay is $0.0155, with 253.24M tokens sold out of 271.04M, bringing the sale to 93.4% completion. So far, $2.25M has been raised, reflecting sustained confidence as the presale advances.
This rapid progression positions Blazpay as one of the best crypto presales currently active. As Solana’s market movements continue to influence broader sentiment, Blazpay’s presale performance demonstrates how a well-structured presale token can capture attention through measurable traction rather than speculation alone. Details are available on the official Blazpay Presale page at www.blazpay.com.
Blazpay’s Multi-Chain Native architecture enables seamless DeFi interactions across multiple blockchain networks. This allows users to move assets, interact with protocols, and execute strategies without being confined to a single chain. In a market where ecosystems like Solana coexist with other high-performance networks, multi-chain accessibility is essential. This utility strengthens Blazpay’s position among ai crypto coins and advanced DeFi platforms.
Blazpay’s Perpetual Trading utility introduces flexible leverage trading with instant execution and built-in risk controls. This feature supports dynamic market participation while maintaining operational efficiency. As Solana continues to influence high-speed trading environments, Blazpay’s Perpetual Trading capability enhances how users engage with volatile markets, reinforcing its relevance as a forward-looking presale token.
$1000 Investment Scenario for Blazpay Phase 6
At the Phase 6 price of $0.0155, a $1000 allocation into Blazpay would secure approximately 64,516 $BLAZ tokens (excluding applicable fees). With Phase 6 already over 93% complete, this scenario highlights limited remaining access to a rapidly closing presale token opportunity.
This level of exposure allows participants to align with Blazpay’s expanding DeFi ecosystem at a stage where infrastructure development and user adoption are converging.
Price Prediction for the $1000 Blazpay Allocation
As Crypto Presale 2026 continues, platforms that deliver multi-chain flexibility and advanced trading tools are expected to gain broader traction. If Blazpay’s ecosystem adoption grows in parallel with its presale momentum, the projected value of a $1000 allocation could scale alongside platform usage rather than short-term market cycles.
Compared to Solana’s infrastructure-driven price movements, Blazpay’s growth narrative is tied to service adoption and cross-chain utility, positioning it among ai crypto coins and best crypto presales with practical use cases.
How to Buy $BLAZ: Step-by-Step Guide
Follow the steps below to buy Blazpay during Presale Phase 6:
– Visit the Official Presale Page: Navigate to the Blazpay presale platform at www.blazpay.com to begin.
– Connect a Compatible Wallet: Securely connect your Web3 wallet to the interface.
– Choose a Payment Method: Select from supported digital assets.
– Enter the Allocation Amount: Specify how much you want to participate with.
– Confirm the Transaction: Review details and approve the on-chain transaction.
– Receive Token Allocation: $BLAZ tokens are assigned according to presale terms.
Access the official Blazpay Presale to get started.
Solana Price Prediction and Current Market Outlook
Solana remains one of the most closely watched Layer-1 blockchains in the market. In 2026, the current outlook for Solana reflects renewed confidence driven by ecosystem growth, increased developer activity, and expanding DeFi and NFT use cases. Solana’s price prediction is often linked to its ability to maintain network stability while supporting large-scale adoption.
As faster blockchains gain relevance, Solana continues to set performance expectations for the industry. This performance-driven narrative complements the rise of platforms like Blazpay, which are building advanced DeFi layers that can interact seamlessly across ecosystems. Together, Solana and Blazpay highlight why many market participants are evaluating crypto coins to buy that balance infrastructure strength with next-generation functionality.
Blazpay and Solana: Best Coins to Buy in 2026
Blazpay and Solana represent two distinct yet complementary roles in the crypto market. Solana focuses on high-speed blockchain infrastructure, while Blazpay enhances how users interact with DeFi across multiple networks. Together, they illustrate why many market participants are exploring crypto coins to buy that combine performance with advanced functionality.
This pairing highlights how a strong Layer-1 ecosystem and a utility-driven presale token can coexist within broader Crypto Presale 2026 strategies.
Conclusion
As Crypto Presale 2026 evolves, the contrast between Solana’s high-performance blockchain and Blazpay’s utility-driven DeFi ecosystem is shaping market expectations. Blazpay ($BLAZ) stands out through its Multi-Chain Native design, Perpetual Trading capabilities, and strong Phase 6 presale performance.
For those evaluating a presale token that aligns with scalable infrastructure and advanced DeFi interaction, Blazpay offers early access to a platform built for the next stage of Web3 adoption. Learn more about the project, its roadmap, and ongoing presale directly on Blazpay website and understand how it complements the evolving Solana market narrative in 2026.
Join the Blazpay Community
Website: www.blazpay.com
Twitter: @blazpaylabs
Telegram: t.me/blazpay
FAQs
Q1: Why is Blazpay considered a strong presale token in Crypto Presale 2026?
Blazpay offers multi-chain access and advanced trading tools, making it a presale token with real DeFi functionality in Crypto Presale 2026.
Q2: How does Solana price prediction influence crypto coins to buy in 2026?
Solana’s price prediction reflects infrastructure demand, which increases interest in crypto coins to buy that complement high-performance ecosystems.
Q3: Is Blazpay among the best crypto presales currently active?
With Phase 6 nearing completion and strong capital raised, Blazpay is widely discussed among the best crypto presales of 2026.
Q4: How does Blazpay compare with Solana among ai crypto coins?
Solana delivers blockchain speed, while Blazpay enhances DeFi interaction through intelligent tools, making both relevant ai crypto coins narratives.
Q5: Why are AI crypto coins and presale tokens gaining traction globally?
Automation, efficiency, and early access are driving global interest in ai crypto coins and utility-focused presale tokens.
Panama City
0830
Plaza 2000 Tower, 10th Floor, 50th Street, Panama, Republic of Panama
Blazpay is a next-generation DeFi platform built for both users and businesses, blending multi-chain access, perpetual trading, portfolio management, and AI automation in one interface. With over 1.2 million early community members, 10 million processed transactions, and 100+ integrations across blockchain ecosystems, Blazpay is preparing to scale as one of the most anticipated token launches of 2026.
Important DisclaimersFXEmpire is owned and operated by Empire Media Network LTD., Company Registration Number 514641786, registered at 7 Jabotinsky Road, Ramat Gan 5252007, Israel. The content provided on this website includes general news and publications, our personal analysis and opinions, and materials provided by third parties. This content is intended for educational and research purposes only. It does not constitute, and should not be interpreted as, a recommendation or advice to take any action, including making any investment or purchasing any product. Before making any financial decision, you should conduct your own due diligence, exercise your own discretion, and consult with competent advisors. The content on this website is not personally directed to you, and we do not take into account your individual financial situation or needs. The information contained on this website is not necessarily provided in real time, nor is it guaranteed to be accurate. Prices displayed may be provided by market makers and not by exchanges. Any trading or other financial decision you make is entirely your own responsibility, and you must not rely solely on any information provided through the website. FXEmpire does not provide any warranty regarding the accuracy, completeness, or reliability of any information contained on the website and shall bear no responsibility for any trading losses you may incur as a result of using such information. The website may include advertisements and other promotional content. FXEmpire may receive compensation from third parties in connection with such content. FXEmpire does not endorse, recommend, or assume responsibility for the use of any third-party services or websites. Empire Media Network LTD., its employees, officers, subsidiaries, and affiliates shall not be liable for any loss or damage resulting from your use of the website or reliance on the information provided herein.Risk DisclaimersThis website contains information about cryptocurrencies, contracts for difference (CFDs), and other financial instruments, as well as about brokers, exchanges, and other entities trading in such instruments. Both cryptocurrencies and CFDs are complex instruments and involve a high risk of losing money. You should carefully consider whether you understand how these instruments work and whether you can afford to take the high risk of losing your money. FX Empire encourages you to conduct your own research before making any investment decision and to avoid investing in any financial instrument unless you fully understand how it works and the risks involved.
The Masked Singer aired its second episode of the seventh series on Sunday night and one huge music star was unveiled as Tea Bag in the early stages of the competition
19:57, 04 Jan 2026Updated 20:05, 04 Jan 2026
Teabag performed for the first and last time on Sunday edition of The Masked Singer(Image: ITV)
A major music star was unmasked on Sunday night’s edition of The Masked Singer. The secret celebrity had only just made their debut on the hit ITV singing competition, in which famous faces conceal their identity whilst performing pop classics as the viewers and judges Davina McCall, Jonathan Ross, Maya Jama and Mo Gilligan try to work out who they are.
In the new episode of the seventh series of the hit programme, fresh characters Arctic Fox, Conkers, Monkey Business Teabag, Toastie and Yak all prepared to take to the stage for the first time. After performing Breakfast At Tiffany’s by Deep Blue Something, Tea Bag ended up in the bottom two along with Yak and when the judges decided to save the latter, it was time for the famous unmasking.
After showing his face to viewers for the first time, it was revealed that the secret star was none other than Professor Green, the legendary rapper who has sold millions of albums and worked with fellow musicians like Emeli Sande, Lily Allen, and Example over the course of his career in the industry.
Upon the unmasking, he told host Joel Dommett: “I can’t believe it, well I can believe it, but I can’t believe it. I thought people would have enjoyed the Tea-Bag. It was quite scary.” When asked how he felt about going out so early, Pro Green, whose real name is Stephen Manderson, admitted he was quite shocked because he knew most of the panel and still none of them guessed who he was.
He said: “Do you know what, I know four of the panel over the last fifteen years. I’ve seen all of them multiple times, and quite regularly at times, and none of them were anywhere near [guessing it was me].
“I was laughing behind the mask. I just thought surely one of them is going to get it. But no one guessed. I got a judge, a rugby player, Sir Trevor McDonald, but I think that was because of the clock; they thought The Ten O’clock News. “
Upon her unmasking, she told host Joel Dommett and the judges: “I have had a lot of fun. We love this programme, as a family, and I just thought, it would be a lot of fun and that to do it for my children would be wonderful. And it’s the most bizarre experience of my life! Thank you.” Emotionally dedicating her time on the programme, Alex, who is married to Charlie Thomson, said: “Teddy, Kit and Annie, this was for you. I hope that you’ve loved it.”
The former Strictly Come Dancing star, 48, then closed out her time on the competition with an unmasked rendition of Pink Pony Club to massive applause from the studio audience. Following her exit from the show, Alex admitted she wanted her performance to serve as an inspiration to her children.
She said: “I want them to know that overcoming fear is a good thing. I am not a singer but I gave it a go, and I think that’s the take home for them. I won’t be able to bear it but they will be so excited, hopefully it will be something special they remember when they grow up. They’ll think ‘God, our mother, do you remember when she dressed as a disc jockey and she sang on national television without any sort of voice?’”
As well as Gargoyle, other stars still in the competition include Red Panda, Can of Worms, Moth, and Sloth. On Sunday night, Monkey Business, Teabag, Toastie, Yak, Arctic Fox, and Conkers will perform for the first time.
It all came after Anne-Marie had been unmasked as Goldfish, having been performing as the lead singer of a group called No Trout in a first for the programme. After performing as Bruno Mars and Rose hit APT, the judges correctly guessed the identity of the singer.
Following her unmasking, the songstress said: “When I was at school, I had a very short attention span! I’m used to the voice just going that way [in front of me] but in the thing, it was like ‘Oh, that’s what I sound like!” She then gave her first unmasked performance for the studio audience of her signature track 2002, which famously references music icons like Britney Spears, Jay-Z and NSYNC.
Altcoin Year Index near 75 suggests XRP price could benefit from a rotation away from Bitcoin.
Whale wallets reduced exchange supply as XRP price stabilized near $1.80–$1.90.
XRP’s 2025 structure mirrors a pre-2017 consolidation before a major breakout.
A weekly close above $2.00 would confirm bullish continuation into 2026.
Ripple’s (XRP) price is drawing renewed attention as market indicators point to a potential shift toward altcoin leadership. Cycle data, on-chain metrics, and long-term chart structures suggest that XRP may be approaching a decisive phase, with analysts watching for confirmation of a broader breakout setup.
Altcoin Cycle Metrics Hint at Renewed XRP Price Strength
According to analyst Steph Is Crypto, the Altcoin Year Index provides important context for current market rotation. Historical data shows three major periods of altcoin outperformance since 2018, each following a phase of Bitcoin consolidation. The index currently sits near 75, while the Bitcoin Year Index remains subdued near 31.
This positioning suggests that altcoin momentum has cooled but may be stabilizing. Previous cycles saw renewed upside once the index reversed from similar levels. XRP, as one of the largest altcoins by market capitalization, is often among the primary beneficiaries during such transitions.
Moreover, the index reflects relative performance rather than price alone. A recovery in altcoin dominance would favor assets with high liquidity and established use cases. However, continued Bitcoin dominance remains a key risk if rotation fails to materialize.
XRP Price Supply Data Shows Whale Accumulation Trend
Meanwhile, on-chain data from Santiment highlights notable changes in large XRP holder behavior. Wallets holding between one million and over ten million XRP saw aggregate balances decline from roughly 25.34 billion to 24.75 billion in December 2025. This shift coincided with price stabilization near the $1.80 to $1.90 range.
The reduction suggests that a significant amount of supply moved off exchanges. Analysts interpret this trend as potential whale accumulation rather than broad distribution. Historically, similar contractions in circulating supply have preceded periods of upward price pressure.
Additionally, the data implies reduced immediate sell-side liquidity. If large holders continue absorbing supply, XRP price could benefit from tighter market conditions. However, sustained accumulation remains necessary to offset market volatility.
XRP Price Fractal Mirrors Pre-2017 Breakout Setup
Furthermore, analyst Maxi compared weekly XRP price charts from 2017 and 2025, identifying notable structural similarities. Both periods show ascending channels followed by corrective phases before major expansions. In 2025, XRP price retraced from highs near $2.50 to around $1.80, aligning with the historical pattern.
In 2017, a comparable consolidation preceded a sharp upside move once resistance levels broke. The current structure suggests that XRP price may be forming a similar base. A decisive weekly close above the $2.00 level would be a key technical confirmation.
$XRP is about to explode, just like it did in 2017.
At the same time, historical comparisons carry limitations. Market conditions, liquidity, and regulatory frameworks differ from prior cycles. Still, the recurring structure provides a reference point for assessing risk and reward as the market moves into 2026.
Overall, XRP price sits at a technically sensitive level shaped by cycle data, supply dynamics, and long-term chart patterns. Confirmation of altcoin rotation and sustained accumulation could support further upside, while failure to hold current levels would delay the bullish thesis.