Iron poisoning is a leading cause of fatal poisoning in children under 6.
IRVINE, Calif. — Supplement company iHerb has recalled about 60,000 iron-containing dietary supplements under the California Gold Nutrition label because their packaging violates federal child-resistant requirements, posing a deadly poisoning risk to young children.
The recall, announced June 26, affects three products: Daily Prenatal Multi, Ultamins Women’s Multivitamin, and Ultamins Women’s 50+ Multivitamin. The supplements were sold online through Amazon.com, Walmart.com, Target.com and other websites from January 2019 through April 2025 for $8 to $18.
The recalled supplements contain iron, which federal law requires to be packaged in child-resistant containers under the Poison Prevention Packaging Act. The bottles and blister packs fail to meet these standards, creating a risk of fatal poisoning if swallowed by young children.
No injuries have been reported in connection with the recall.
The Daily Prenatal Multivitamin comes in white bottles with white lids and gold border labels, containing 60 fish gelatin softgel supplements. The Women’s Multivitamin and Women’s 50+ Multivitamin feature dark purple packaging with gold border labels, each containing 60 capsules in foil packaging.
Consumers should immediately secure the recalled supplements away from children and contact iHerb for refunds. To receive a refund, customers should email ProductRecall@iherb.com with the subject line “Iron Supplement Refund” and include their name, product names and quantities, and photographic evidence of destruction showing their initials and date.
The manufacturer, iHerb LLC, doing business as Madre Labs LLC of Irvine, California, is contacting all known purchasers directly.
Iron poisoning is a leading cause of fatal poisoning in children under 6. The Consumer Product Safety Commission requires iron-containing supplements with 30 milligrams or more of iron per dosage unit to be packaged in child-resistant containers.
ChatGPT is a generative AI model developed by OpenAI, built on the GPT‑4 architecture. It’s designed to generate human-like responses across a wide range of topics, using knowledge drawn from an enormous training set of text, books, code and online content.
When it comes to cryptocurrency, ChatGPT doesn’t have real-time access to Bitcoin BTCUSD price feeds or live market charts, but that doesn’t mean it’s useless for traders. With the right inputs — historical price data, sentiment indicators and technical metrics — ChatGPT becomes a powerful analytical tool.
It can help structure Bitcoin price forecasts, identify trends or even simulate crypto trading strategies when paired with the right data.
This is where ChatGPT Bitcoin analysis becomes useful. Its strength lies in interpreting context: combining past performance, technical indicators and market sentiment to support better decision-making.
Did you know? In 2025, around 77% of consumer devices already use some form of AI.
How to predict Bitcoin with AI
How exactly do traders predict Bitcoin with AI, specifically, with ChatGPT?
Many begin by feeding it structured prompts that include market sentiment, on-chain metrics and technical analysis indicators.
For instance, crypto trend prediction with GPT might start by parsing news headlines, sentiment on X, Reddit discussions or expert commentary. This allows ChatGPT to gauge whether the overall mood is bullish or bearish, a key insight in a market where Bitcoin volatility trends often follow shifts in narrative.
When given technical indicators such as the relative strength index (RSI), moving average convergence/divergence (MACD), moving averages or trading volume, ChatGPT financial tools can contextualize them using historical relationships. For example, if RSI exceeds 70 and volume surges, ChatGPT might flag the market as overbought — a classic signal of potential pullback based on Bitcoin price history.
Integrating onchain analytics like whale wallet activity, hashrate trends or exchange inflows/outflows can enhance this picture. ChatGPT can help interpret such data and suggest whether accumulation or distribution phases are forming, especially when paired with external tools like TradingView or LunarCrush.
From bots to AI agents: Evolving Bitcoin trading with ChatGPT
Some advanced traders build AI Bitcoin trading strategies that combine ChatGPT with APIs or dashboards.
These setups let ChatGPT pull from multiple data sources — like social sentiment APIs, technical indicators or trading signals — and generate backtestable models or even functional code for ChatGPT trading bots and ChatGPT-powered AI agents.
In this setup, the trader becomes the architect while ChatGPT acts as the signal synthesizer, combining disparate data points into actionable insights.
This type of workflow sits at the cutting edge of AI in cryptocurrency, where trading bots vs. AI becomes a question of adaptability: Traditional bots follow rules, while ChatGPT can evolve strategies in response to shifting conditions.
What the research says about ChatGPT crypto trading insights
Multiple studies suggest that AI — and even ChatGPT-enhanced systems — can outperform both manual and conventional machine learning models in predicting crypto price movements.
A peer-reviewed study published in Frontiers in Artificial Intelligence compared various forecasting models for Bitcoin from 2018 to 2024.
The machine learning Bitcoin forecast using a neural ensemble strategy returned a staggering 1,640%, compared to just 305% for standard machine learning models and 223% for a buy-and-hold approach.
Even after applying a 1% per-trade cost, the net return was over 1,580%, showcasing the edge of dynamic, AI-driven strategies.
Transformer-based architectures (akin to GPT) that fuse onchain analytics with Bitcoin market sentiment from social data have also outperformed legacy models in both return and risk control. These tools reduce drawdowns by anticipating volatility through real-time sentiment and technical signals.
But here’s the key: These results don’t come from ChatGPT alone. Instead, they reveal the potential of using ChatGPT for crypto trading insights when it’s embedded in a broader system — one that includes real-time data, prompt logic and post-analysis validation.
Real‑world machine learning Bitcoin forecast: How traders predict Bitcoin with AI
Some of the most compelling ChatGPT crypto trading insights come from real setups used by active traders.
For instance, a case study on TradingView used OpenAI’s GPT-based “o3 Pro” model to assess the Sui (SUI) token. The system analyzed 38 real-time indicators — covering technical metrics, Binance order-book flows, on-chain usage and social sentiment — to produce a structured, real-time forecast. It flagged breakout compression near key support and resistance levels, offering a valuable AI crypto forecast.
These setups are increasingly common. Traders input screenshots of candlestick charts, readouts from indicators like RSI or Bollinger Bands and API-based data sets from platforms like LunarCrush or TradingView. ChatGPT trading bots built around these workflows can then draft buy/sell signals, PineScript strategies or even generate tailored MQL5 code (the programming language used to build custom trading algorithms for MetaTrader 5).
Some communities now maintain prompt libraries that walk users through nine distinct workflows, ranging from strategy development and backtesting to journaling trades or detecting fakeouts across multiple timeframes.
By combining human intuition with AI tools for traders, these hybrid environments demonstrate how predicting Bitcoin with AI doesn’t mean full automation — it means deeper, faster synthesis of data and sentiment.
Did you know? AI models like ChatGPT organize meaning across 66 dimensions, forming mental “maps” of ideas, much like the human brain groups related concepts. That’s how they know an “apple” is closer to “fruit” than to “laptop,” even though both might show up in your shopping cart.
Limits of ChatGPT in Bitcoin price prediction
Despite its strengths, ChatGPT Bitcoin analysis is fundamentally constrained by design.
Because ChatGPT lacks direct access to real-time data, it cannot deliver live market calls or react instantly to volatile swings. Bitcoin market sentiment, order book data, macroeconomic news — none of it is streamed directly into the model. Instead, all insights depend on the user’s ability to feed in structured data from external sources.
This limitation also means ChatGPT cannot reliably detect market manipulation. Sophisticated schemes like spoofing, wash trading or flash crashes often unfold too quickly and subtly for a text-based model to identify, especially without live onchain analytics or real-time feeds.
Another well-documented issue is overconfidence. In several cases, users report that ChatGPT will initially resist making predictions until given exhaustive prompts, but once it does respond, it might deliver outputs that sound authoritative yet remain untested or speculative. This can lead to hallucinations, fabricated but plausible-sounding insights that carry risk if acted upon blindly.
Finally, broader research from BCG and Harvard Business School warns against overreliance on generative AI. In high-stakes tasks requiring strategic judgment, GPT-4 users sometimes performed 23% worse than control groups — a cautionary tale for crypto traders considering replacing intuition with automation.
Bitcoin price prediction: ChatGPT is a tool, not a prophet
Can ChatGPT predict Bitcoin’s next move? Not directly. But it can help you become a better analyst.
With properly structured prompts and high-quality inputs, ChatGPT can surface patterns, interpret sentiment, decode technical signals and accelerate strategy development. It bridges the gap between intuition and data, but it doesn’t eliminate the need for human oversight.
In the debate of trading bots vs. AI, ChatGPT doesn’t replace bots — it helps you build smarter ones. It won’t deliver absolute answers, but it can offer structured, explainable perspectives, especially when used alongside traditional crypto technical analysis methods.
When trading on today’s volatile markets, ChatGPT financial tools are best viewed as part of a broader arsenal — where AI helps parse complexity but doesn’t shoulder responsibility alone.
Web3 gaming is one of the most active fields on crypto Twitter. On July 4, 2025, Phoenix Group together with LunarCrush published its new data highlighting the most active gaming projects on the blockchain front.
Projects were ranked by the number of engaged posts and total interactions based on metrics gathered in a 24-hour period, which demonstrates how Web3 gaming tokens are dominating the community with activity on digital platforms.
These interactions are recorded across likes, retweets, upvotes, and comments, which provide an indication of which gaming ecosystems are resulting in the most real-time discussion and interaction.
FLOKI Surges to the Top in Interactions
Though APE Coin stands as the king in terms of engaged posts (5.3K), the greatest number of interactions belonged to FLOKI (429.8K), outlining the tremendous results of this token (the highest out of all mentioned tokens). The good performance of FLOKI is a sign of its growing popularity due to the new marketing campaign, listing on the exchange, and an active community of fans.
FLOKI landed 4.9K engaged posts, slightly behind APE but beating all other competitors accordingly, signifying the quality and quantity of its traction on social media.
APE and GALA Maintain High Engagement Post Volume
APE Coin is another web3 gaming project that still remains on top alongside a robust and stable online community of 5.3K engaged posts and 215.4K interactions. Immediately after APE comes GALA, which achieved 4.7K engaged postings and 219.3K interactions, which means that it remains relevant in Web3 games, particularly with its growing ecosystem of NFT-based games and collaborators.
VRA and RENDER Strengthen Mid-Table Presence
Verasity (VRA) and Render Network (RENDER) showed considerable activity as well in the web3 gaming list. VRA reached 4.4K engaged posts and 321.6K interactions, whereas Render reached 3.8K posts with 372.0K interactions, proving one of the most interaction-dense projects despite the lower number of posts. A high engagement ratio shows that people in the community are interested in Render because of its GPU cloud rendering in the metaverse.
ZENT and DG: Underdogs with Surprising Performance
DG (Decentral Games) and ZENT are not likely to dominate the headlines, but their performance can be noted. ZENT had 3.5K effective posts and 217.4K interaction, whereas DG had 3.2K and 80.5K interaction. These metrics result in ZENT taking a spot in the upper half of the chart, indicating a consistently increasing, interested user base, which may be attributed to newly added features or updates in the game.
AXS, BEAM, IMX Round Out the Top 10 Web3 Gaming Projects
One of the most recognizable web3 gaming projects, Axie Infinity (AXS), received 2.7K engaged posts and 149.1K interactions, which is an indicator that this project is not losing its appeal to the audience despite the emergence of new projects competing with it.
BEAM, which is the native coin of the Merit Circle DAO ecosystem, also performed well with 2.6K posts and 212.6K interactions that indicate revived interest in the community, which can be related to the latest protocol updates.
Immutable X (IMX), the popular Ethereum Layer-2 game platform, completed the list with 2.3K involved posts and a solid 286.3K interactions, showing that it continues to lead in infrastructure-centered game development.
Key Insights: Interaction Over Post-Volume
Among the major lessons learned in the July 4 report is that when it comes to interactions, it’s not always proportional to the number of posts being done. e.g., Render and IMX recorded much higher interactions per post, which implies that the quality of the content and the sentiment of the user play a significant role in community engagement.
With over five years of experience in crypto, blockchain, and tech content, Ishtiyaq makes complex topics easy to understand. He simplifies blockchain and digital currency concepts for a wide audience, ensuring that beginners and experts alike can grasp key ideas. His clear and engaging writing helps readers stay informed about the latest trends, developments, and innovations in the crypto space. Whether explaining blockchain technology, digital assets, or DeFi, Ishtiyaq breaks down complicated ideas into simple, digestible content. His goal is to help people navigate the fast-changing world of cryptocurrency with confidence, clarity, and a deeper understanding.
Ever wondered if your cup of green tea could be the secret weapon in your fat loss arsenal? I spent 30 days testing this ancient beverage as a pre-workout supplement, and the results were eye-opening. Let’s dive into the science and real-world effects of sipping green tea before hitting the gym.
The science behind green tea’s fat-burning potential
Green tea contains potent compounds called catechins (particularly EGCG) and a moderate amount of caffeine that work synergistically to enhance fat metabolism. Research suggests these bioactive compounds can increase your body’s ability to burn fat during exercise by stimulating your sympathetic nervous system.
“The combination of caffeine and catechins in green tea creates a metabolic environment that favors fat oxidation during physical activity,” explains Dr. Michael Chen, sports nutritionist at the Austin Fitness Research Institute. “It’s not a miracle solution, but the evidence points to modest yet meaningful benefits when timed correctly.”
My 30-day green tea experiment
I consumed one cup of freshly brewed green tea 30 minutes before my workouts for a month. The routine was simple: steep high-quality green tea for 3-4 minutes, let it cool slightly, then drink it before heading to the gym. My exercise routine included a mix of strength training and cardio sessions.
What happened to my fat burning capacity?
By the second week, I noticed several changes during my workouts:
Increased endurance during cardio sessions
Less fatigue during high-intensity intervals
Slightly more energy throughout my workouts
Better mental focus and motivation
While I can’t measure my exact fat oxidation rates without laboratory equipment, the scale showed a modest 1.5-pound additional weight loss compared to my previous month’s progress, despite maintaining the same calorie intake and exercise volume.
The timing sweet spot for maximum benefits
Research suggests that the optimal timing for green tea consumption is 30-60 minutes pre-workout. This allows the catechins and caffeine to reach peak blood concentration during your exercise session, potentially maximizing fat oxidation during activity.
“Think of green tea as kindling for your metabolic fire,” notes fitness physiologist Dr. Amanda Roberts. “When consumed before exercise, it helps your body more efficiently tap into fat stores for fuel, especially during moderate-intensity workouts where fat oxidation is already naturally higher.”
Not all green tea is created equal
During my experiment, I discovered significant differences between green tea varieties. Matcha provided the strongest effects, likely due to its higher concentration of catechins. Brewed loose-leaf tea outperformed bagged varieties, while bottled green tea had minimal impact on my workout performance.
Quality matters tremendously – just as you wouldn’t fuel a high-performance car with low-grade gasoline, your body responds best to premium green tea sources with maximum bioactive compounds.
Combining green tea with other fat-burning strategies
I found that green tea worked particularly well when paired with morning rowing sessions and fasted cardio. Adding more fiber to my diet seemed to enhance the effects, possibly by improving digestion and nutrient absorption.
Pair with moderate-intensity cardio (60-70% max heart rate)
Consider fasted morning workouts for enhanced fat oxidation
Stay consistent with daily consumption
Potential downsides and considerations
Green tea isn’t without drawbacks. I experienced mild jitters on days when I consumed coffee shortly after my pre-workout tea. The caffeine content, while lower than coffee, can still affect sleep if consumed late in the day. Consider switching to decaffeinated green tea for evening workouts.
Those with sensitive stomachs might experience mild digestive discomfort when drinking green tea on an empty stomach. Try having a small protein snack alongside your tea if this occurs.
Is green tea worth adding to your pre-workout routine?
Based on my experience and the research, green tea offers a gentle, natural boost to fat metabolism without the harsh side effects of many commercial fat burners. It won’t replace proper nutrition or consistent training, but it can provide that extra edge for those looking to optimize their fat loss efforts.
Consider it less like a magic potion and more like a supportive friend on your fitness journey – one that gently enhances your body’s natural fat-burning capabilities while providing numerous other health benefits. Why not brew a cup before your next workout and see if you notice the difference?
Dogecoin (DOGE) is once again grabbing attention in the crypto space as recent chart patterns and a broader market recovery boost investor optimism.
Now ranked 9th by total market capitalization, this popular meme coin shows a level of resilience that suggests it has moved beyond its novelty status.
Dogecoin Price Analysis
DOGE currently trades at $0.17, up 7.7% today. The price had previously hovered around $0.14—a level that many analysts marked as a key breaking point. Long-term traders often viewed dips toward $0.10 as a strong entry opportunity for accumulation.
Although past performance doesn’t guarantee future results and this isn’t financial advice, the recent push from $0.14 may offer solid gains for those who bought at that range.
One major reason for the current enthusiasm is a double bottom pattern forming on Dogecoin’s chart. This bullish setup shows two similar lows with a peak between them, indicating that sellers are losing steam while buyers step in.
The latest double bottom appeared around the $0.157–$0.158 zone in early July, accompanied by above-average volume—strengthening the signal. This pattern matches the broader market’s recovery, especially with Bitcoin (BTC) pushing back toward the $110,000 level.
Historically, Dogecoin often mirrors Bitcoin’s movement. The macro momentum, along with easing global trade tensions and geopolitical risks, sets a more optimistic backdrop for DOGE and similar assets.
Analysts are closely tracking indicators like the Simple Moving Average (SMA). A 50-day SMA crossing above the 200-day SMA—often a lagging but reliable bullish sign—may be on the horizon if current trends continue.
Dogecoin Price Prediction
While some broader indicators still show downward pressure, the case for a bullish DOGE outlook keeps building. The coin repeatedly finds support near $0.16 and doesn’t hold below $0.13 for long.
Earlier rebounds pushed DOGE to $0.19 and even $0.25, making today’s $0.17 price a potentially strategic entry point ahead of a possible run toward $0.20 resistance.
Sentiment is clearly shifting. The “Fear and Greed Index” sits around 50, reflecting a balanced market with bulls and bears in a standoff.
Still, the technical picture and external trends suggest DOGE may stand at a crucial turning point. Many traders are now asking if this level marks the lowest price DOGE will see for a while.
Dogecoin could be regaining momentum, and the market is watching to see whether this rally marks the start of a longer bullish run.
Based on the 7-day price chart, Dogecoin (DOGE) appears to be forming a bullish structure following a clear double bottom pattern that developed around July 2 near the $0.158 level.
After touching this local low, the price rebounded sharply, climbing above $0.175 before retracing slightly to the $0.165 range. This upward surge, combined with elevated volume during the breakout, signals renewed buying interest.
If DOGE holds above the $0.162–$0.165 support zone in the coming days, the chart suggests a possible retest of the $0.175 resistance. A breakout above that level could open the path toward $0.18 or even $0.20 in a bullish scenario.
However, if price falls below $0.16 again, short-term momentum may fade. The outlook remains cautiously optimistic as long as DOGE sustains higher lows and broader market sentiment stays positive.
Next Meme Coin to Explode
BTC Bull Token (BTCBULL), a Bitcoin-themed meme coin, just burned 7.35 billion tokens—cutting 35% from its total 21 billion supply. This big burn has sparked bullish energy just days before the official launch.
The presale has already raised over $8 million. The claim phase begins in just few days, and many are calling $BTCBULL the “official Bitcoin meme coin.” It mixes the fun of meme coins with real use cases designed for Bitcoin fans.
One of its standout features is the Bitcoin airdrop. Holders will receive free Bitcoin in their wallets when BTC hits major price milestones. A large airdrop will go out when Bitcoin reaches $250,000, with more set for higher prices.
$BTCBULL also follows Bitcoin’s deflationary style. It plans more token burns at key Bitcoin levels—$125,000, $175,000, and $225,000—with bigger burns ahead. These burns aim to reduce the token supply and possibly increase value through scarcity.
Holders can also stake their tokens during the presale and earn up to 51% APY—a strong incentive to grow their holdings.
BTC Bull Token teamed up with Best Wallet, a secure and private crypto wallet. This partnership makes it easy to receive Bitcoin airdrops. Best Wallet doesn’t ask for ID or verification and supports many chains and wallets.
With less than 3 days left in the presale, now is the chance to grab $BTCBULL at its current price. To buy, connect your wallet (Best Wallet is suggested for airdrops, but MetaMask and others work too) and swap USDT, BNB, or ETH for $BTCBULL.
This article has been provided by one of our commercial partners and does not reflect Cryptonomist’s opinion. Please be aware our commercial partners may use affiliate programs to generate revenues through the links on this article.
The EURJPY pair formed a new bullish attack, taking advantage of the repeated positive pressure, to attack the resistance of the bullish channel’s resistance at 170.60, achieving the suggested target in the previous report.
The price might be forced to provide mixed trading due to the strength of the current resistance besides stochastic attempt to exit the overbought level, to increase the chances of activating the attempts of gathering the gains by targeting 169.20 and 168.60 level, while breaching the resistance and holding above it will open the way for recording new gains that might extend to 171.10 and 171.60.
The expected trading range for today is between 169.20 and 170.60
Trend forecast: Fluctuated within the bullish track
You’ll also notice that over the last couple of months, we’ve gradually seen higher levels. So, it’ll be interesting to see if we can build up enough pressure to finally break out as the interest rate differential continues to favor the United States.
AUD/USD Technical Analysis
The Australian dollar has dropped a bit as we continue to sit just above that crucial 0.6550 level, which is an area that I’ve been talking about for what seems like a lifetime now. This is a market that just simply doesn’t have anywhere to be, but it is slowly grinding higher. And that’s probably what you need to pay the most attention to.
If we do break down below the 0.6550 level, then we could see this market drop down to the 50-day EMA. But really, I think at that point, you’d just be looking at a value play. We’ve been in this very tight channel that’s been ascending since the middle of April. At this point, there’s nothing on this chart that tells me things are changing.
For a look at all of today’s economic events, check out our economic calendar.
Iron poisoning is a leading cause of fatal poisoning in children under 6.
IRVINE, Calif. — Supplement company iHerb has recalled about 60,000 iron-containing dietary supplements under the California Gold Nutrition label because their packaging violates federal child-resistant requirements, posing a deadly poisoning risk to young children.
The recall, announced June 26, affects three products: Daily Prenatal Multi, Ultamins Women’s Multivitamin, and Ultamins Women’s 50+ Multivitamin. The supplements were sold online through Amazon.com, Walmart.com, Target.com and other websites from January 2019 through April 2025 for $8 to $18.
The recalled supplements contain iron, which federal law requires to be packaged in child-resistant containers under the Poison Prevention Packaging Act. The bottles and blister packs fail to meet these standards, creating a risk of fatal poisoning if swallowed by young children.
No injuries have been reported in connection with the recall.
The Daily Prenatal Multivitamin comes in white bottles with white lids and gold border labels, containing 60 fish gelatin softgel supplements. The Women’s Multivitamin and Women’s 50+ Multivitamin feature dark purple packaging with gold border labels, each containing 60 capsules in foil packaging.
Consumers should immediately secure the recalled supplements away from children and contact iHerb for refunds. To receive a refund, customers should email ProductRecall@iherb.com with the subject line “Iron Supplement Refund” and include their name, product names and quantities, and photographic evidence of destruction showing their initials and date.
The manufacturer, iHerb LLC, doing business as Madre Labs LLC of Irvine, California, is contacting all known purchasers directly.
Iron poisoning is a leading cause of fatal poisoning in children under 6. The Consumer Product Safety Commission requires iron-containing supplements with 30 milligrams or more of iron per dosage unit to be packaged in child-resistant containers.
Cardano is showing rising bullish sentiment near $0.50, hinting at a potential breakout as key resistance levels come into focus.
Cardano is trading near $0.58, and there’s growing interest starting to form around it. While the price remains steady, sentiment is quickly shifting.
Cardano’s current price is $0.58, down -3.65% in the last 24 hours. Source: Brave New Coin
Cardano Sentiment Hits 30-Day High
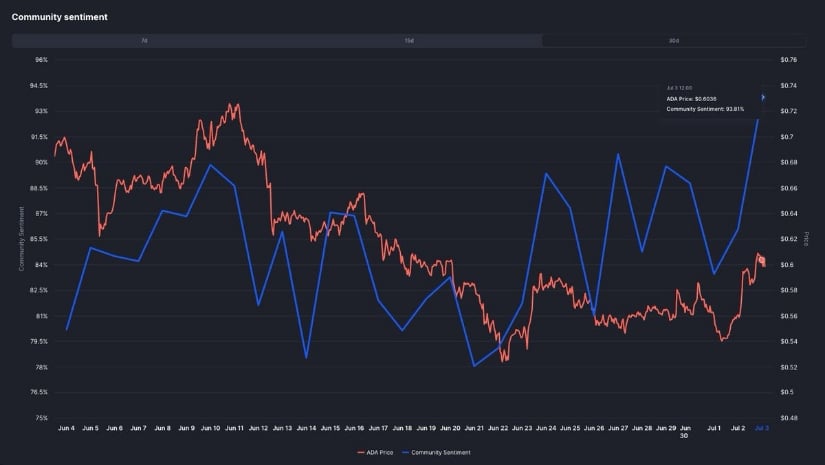
Cardano might not be making huge moves on the charts right now, but under the surface, confidence is quietly building. According to TapTools, ADA’s community sentiment on CoinMarketCap just surged to a 30-day high, with 93.8% of voters currently bullish. That’s a sharp rise considering the recent price weakness.
Cardano sentiment hits a 30-day high with 93.8% bullish votes, signaling growing confidence. Source: TapTools via X
The sentiment spike comes at a time when Cardano price remains stuck in a tight range between $0.50 and $0.80. If this confidence continues to hold up, it could pave the way for a more meaningful move once volatility returns to the broader market.
ADA’s Past Rally Sparks Fresh Comparison to Today’s Market
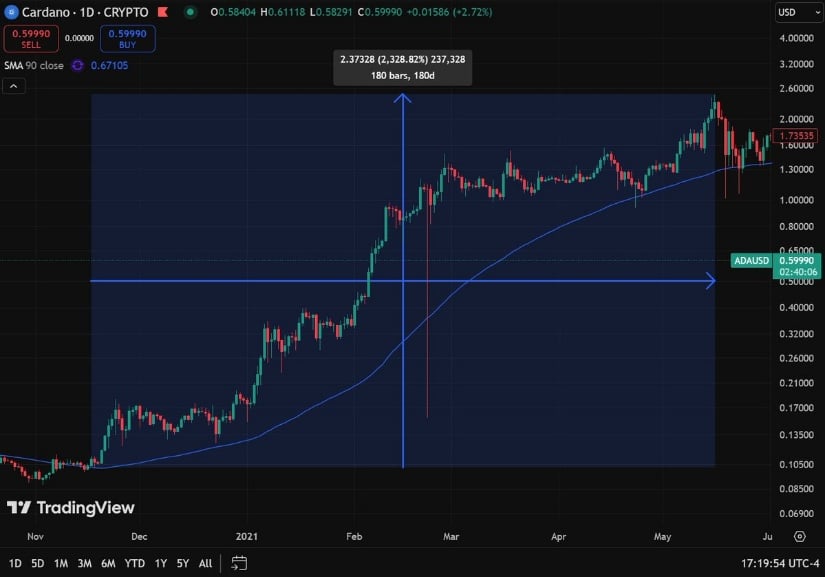
Back in 2020, ADA price went on a historic run, rising from $0.10 to $2.50 in just 180 days. That +2,300% surge was on the back of strong fundamentals, growing ecosystem interest, and, importantly, surging sentiment.
Cardano’s current sentiment surge draws fresh comparisons to its explosive 2020 rally. Source: Goofycrisp via X
Now, with current bullish sentiment nearing 94%, Goofycrisp is starting to wonder if Cardano will be seeing the early echoes of that same setup forming again. While today’s market doesn’t guarantee a repeat performance, the sentiment-to-price setup is starting to rhyme. If ADA Cardano price begins to push above the $0.80 resistance levels, things can turn in the bulls’ favor.
Cardano Price Prediction Targets $1.35, $2.00, and $3.20
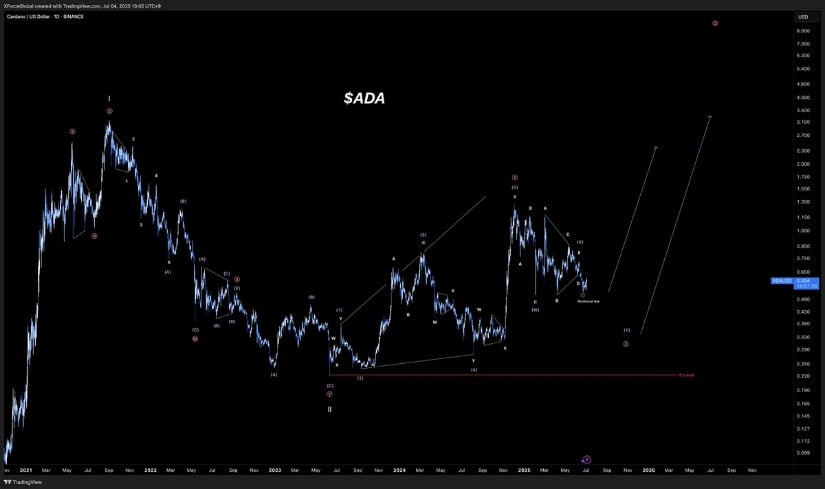
Following possible 2020 scenarios, Cardano, in a recent report shared by XForceGlobal, ADA’s price action is framed within a refined Elliott Wave structure that shows the asset possibly concluding its corrective phase. The drawn-out ABC correction seems to be completing, with multiple tests of the lower demand zone around $0.45–$0.50. That zone has acted as a soft floor for months, and now, the structure hints at the early stage of a motive wave building up.
Elliott Wave analysis points to a potential bullish breakout for ADA, with price targets at $1.35, $2.00, and $3.20. Source: XForceGlobal via X
The chart presents two potential bullish scenarios: a more gradual grind upward or a sharper impulsive breakout. Medium timeframes, in particular, show a coiling pattern, with each low getting absorbed, and could lead to a quick reversal. If this structure plays out, the Elliott Wave projections from XForceGlobal suggest potential upside targets at $1.35, $2.00, and eventually $3.20, mirroring ADA’s previous cycle behavior of 2020 up to some extent.
Cardano Positioning for a Breakout
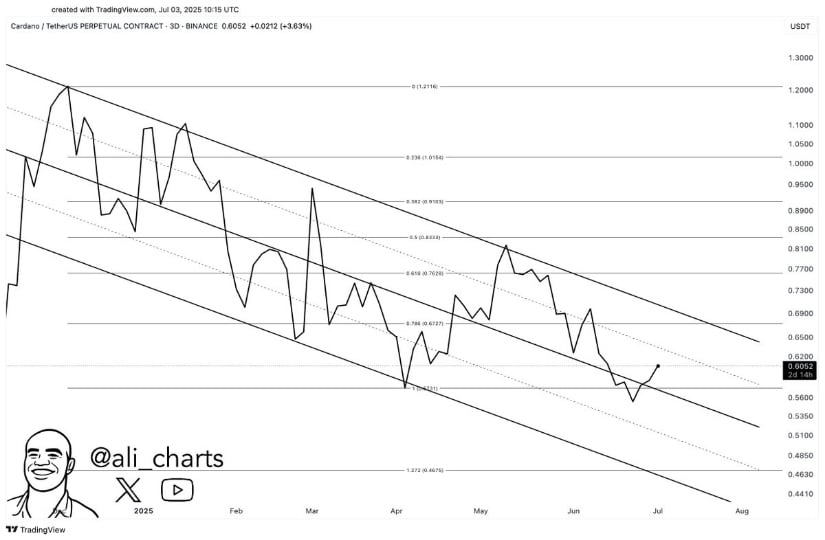
Famous crypto chartist Ali Martinez’s chart brings focus to a long-standing descending channel that defined Cardano’s trend for much of 2025. ADA price has consistently respected the boundaries of this pattern, but momentum appears to be tightening. A daily close above $0.67 is the level to watch; a breakout here could clear the way for a move toward $0.83 and even $0.91, aligning with mid-channel Fibonacci extensions.
Ali Martinez highlights a tightening descending channel on ADA, with a breakout above $0.67 potentially opening the door to $0.83 and $0.91. Source: Ali Martinez via X
Now that Cardano is starting to see shorter and shorter dips, this suggests selling pressure is on the decrease. If buyers can flip $0.67 with conviction, it would mark ADA’s first meaningful breakout in weeks, potentially shifting short-term market structure and momentum.
Final Thoughts: Cardano Price Picking Momentum
Cardano may be flying under the radar right now, but momentum is clearly starting to build. Sentiment is strong, technicals are tightening, and key resistance levels are coming into focus. A breakout above $0.67 could be the spark that shifts ADA price into a higher gear.
With historical patterns and wave structures hinting at a bigger move, ADA’s current setup is one worth watching closely. If buyers step in with conviction, we could be looking at a bullish Cardano price prediction in the making.
Silver consolidates just below its highest level in more than two weeks set on Thursday.
The mixed technical setup warrants some caution before placing fresh directional bets.
Any corrective slide might still be seen as a buying opportunity and remain cushioned.
Silver (XAG/USD) holds steady below the $37.00 mark during the Asian session on Friday and remains within striking distance of over a two-week high touched the previous day. Meanwhile, the constructive technical setup suggests that the path of least resistance for the white metal remains to the upside.
The daily Relative Strength Index (RSI, 14) remains above 50 and validates the positive outlook for the XAG/USD. However, the Moving Average Convergence Divergence (MACD) histogram and the signal line on the daily chart are yet to confirm bullish bias, suggesting that any subsequent move up could stall near the $37.30-$37.35 region, or the highest level since February 2012 touched earlier this month. Some follow-through buying, however, would set the stage for an extension of a nearly three-month-old uptrend.
On the flip side, the $36.50-$36.45 area now seems to protect the immediate downside, below which the XAG/USD could slide to the $36.15-$36.10 region. A further decline below the $36.00 mark could extend towards the $35.50-$35.40 horizontal zone. The latter should act as a key pivotal point and a convincing break below would shift the near-term bias back in favor of bearish traders. The white metal might then accelerate the corrective fall towards the next relevant support near the $35.00 psychological mark.
Some follow-through selling below the latter should pave the way for deeper losses and drag the XAG/USD to an intermediate support near the $34.75 en route to the $34.45 region.
Silver 4-hour chart
Silver FAQs
Silver is a precious metal highly traded among investors. It has been historically used as a store of value and a medium of exchange. Although less popular than Gold, traders may turn to Silver to diversify their investment portfolio, for its intrinsic value or as a potential hedge during high-inflation periods. Investors can buy physical Silver, in coins or in bars, or trade it through vehicles such as Exchange Traded Funds, which track its price on international markets.
Silver prices can move due to a wide range of factors. Geopolitical instability or fears of a deep recession can make Silver price escalate due to its safe-haven status, although to a lesser extent than Gold’s. As a yieldless asset, Silver tends to rise with lower interest rates. Its moves also depend on how the US Dollar (USD) behaves as the asset is priced in dollars (XAG/USD). A strong Dollar tends to keep the price of Silver at bay, whereas a weaker Dollar is likely to propel prices up. Other factors such as investment demand, mining supply – Silver is much more abundant than Gold – and recycling rates can also affect prices.
Silver is widely used in industry, particularly in sectors such as electronics or solar energy, as it has one of the highest electric conductivity of all metals – more than Copper and Gold. A surge in demand can increase prices, while a decline tends to lower them. Dynamics in the US, Chinese and Indian economies can also contribute to price swings: for the US and particularly China, their big industrial sectors use Silver in various processes; in India, consumers’ demand for the precious metal for jewellery also plays a key role in setting prices.
Silver prices tend to follow Gold’s moves. When Gold prices rise, Silver typically follows suit, as their status as safe-haven assets is similar. The Gold/Silver ratio, which shows the number of ounces of Silver needed to equal the value of one ounce of Gold, may help to determine the relative valuation between both metals. Some investors may consider a high ratio as an indicator that Silver is undervalued, or Gold is overvalued. On the contrary, a low ratio might suggest that Gold is undervalued relative to Silver.