The main category of Crypto News.
You can use the search box below to find what you need.
[wd_asp id=1]
The main category of Crypto News.
You can use the search box below to find what you need.
[wd_asp id=1]
Terraform co-founder Do Kwon has been sentenced to 15 years in prison after pleading guilty to wire fraud charges. The news has left the crypto community divided, as many expected more years.
Meanwhile, Solana price prediction discussions have reduced given the current correction. Only a few altcoins like DeepSnitch AI have defied the downtrend, giving investors up to 81% in returns.
Many people still believe DeepSnitch AI has the potential to climb higher given its AI utility and massive adoption. With January on the way, you can take advantage of the 50% and 100% bonus codes.
U.S. District Court Judge Paul Engelmayer has sentenced Do Kwon, the co-founder of Terraform Labs, to 15 years in prison. The sentence comes after the crypto entrepreneur pleaded guilty to wire fraud and conspiracy to commit fraud.
The crash that took place in 2022 erased around $40 billion from the crypto market. Meanwhile, Kwon will be credited with time spent in the U.S and 17 months in pre-extradition custody. Kwon noted that he would love to serve the remainder of his sentence in his home country, close to his family.
DeepSnitch AI is one of the most talked-about projects in the market right now. Whether you are a newcomer or a professional, the platform is offering you institutional-grade tools that can give you a competitive advantage over other traders.
With its AI-driven monitoring system and live dashboard already operational, the project is helping everyday traders make sharper decisions long before information becomes public. Three of its AI agents and the dashboard are currently live.
Also, you can earn rewards by staking your coins and be part of those who will enjoy the platform’s dynamic staking system. This combination of live features and early growth makes DeepSnitch AI a good crypto to buy right now before prices skyrocket.
The DSNT coin is currently priced at $0.02735, an 81% increase since launch. On Telegram and X, there are discussions about a potential Tier-1 and Tier-2 exchange listing in early 2026. If this happens, the value of DeepSnitch AI could soar by more than 100X.
Solana has been trading sideways in the past week, owing to the downtrend in the market and likely selloffs by profit takers. On December 11th, the Solana coin was trading at $136.12.
Despite the downside, a SOL bull-case scenario is still possible. However, bulls have to break past the 50-SMA ($153.72) first. Crossing this level could attract more buyers to the market, which in turn may lead to a sustained uptrend. Meanwhile, CoinCodex’s Solana price prediction shows a target of $151 in the coming months.
The Zcash price has been on an upward trajectory since the beginning of December. Data shows the value of the privacy coin has increased by 26.2% on the weekly chart but remains bearish on the monthly timeframe.
If bulls continue to maintain the uptrend, Zcash could soar to $500 soon. As of December 11th, the Zcash price was valued at $454.34. CoinCodex forecasts that the Zcash price could climb to $651 in the coming month.
While the Solana price prediction making the rounds in the market shows promise, SOL is a high-cap coin. If you are looking for a crypto that has a high chance of growth, utility projects like DeepSnitch AI might be among the best to consider.
DeepSnitch AI is currently trading at $0.02735, which allows you to accumulate a large amount of tokens with small capital. A slight increase in price could push the DSNT coin to a high market cap, giving buyers up to 100X returns.
To reward committed purchasers, DeepSnitch AI offers a 50% bonus on purchases above $2,000 using the code DSNTVIP50. Purchases above $5,000 can get a 100% bonus with the code DSNTVIP100.
Visit the official website for more information, and join X and Telegram for community updates.
CoinCodex’s Solana price prediction displays a minimum target of $130.16 and a maximum price of $139.13 in 2026. However, high Solana adoption growth could push the SOL price higher.
A Solana future value of $1,000 is a long shot given its current price. The altcoin’s price would have to increase by about 7x to reach that mark, a move that is unlikely given its large market cap. Meanwhile, a low-cap utility-driven coin like DeepSnitch AI may reach this mark with massive adoption.
While Solana might be a good investment for old investors, new investors who are yet to cash out from the market are better off investing in low-cap gems like DeepSnitch AI, which have enough room for expansion.
Disclaimer: This is a Press Release provided by a third party who is responsible for the content. Please conduct your own research before taking any action based on the content.

BitcoinWorld
Polygon MATIC Price Prediction 2025-2030: Will This Explosive Crypto Reach $1?
As the cryptocurrency market continues to evolve, Polygon (MATIC) stands out as a layer-2 scaling solution that has captured significant attention. Investors and enthusiasts alike are asking the crucial question: Will MATIC price surge to $1 and beyond in the coming years? This comprehensive analysis explores Polygon MATIC price prediction from 2025 through 2030, examining the factors that could drive this cryptocurrency’s future valuation.
Polygon, formerly known as Matic Network, is a protocol and framework for building and connecting Ethereum-compatible blockchain networks. The native token, MATIC, serves multiple purposes within the ecosystem including payment for transaction fees, staking, and governance. Understanding the Polygon MATIC price prediction requires examining both the technical fundamentals and market dynamics.
Before diving into future predictions, let’s examine MATIC’s current market position. As of [current date], MATIC trades at approximately [current price], with a market capitalization ranking it among the top 20 cryptocurrencies. The Polygon network has demonstrated remarkable growth in several key areas:
Several critical elements will shape the Polygon MATIC price prediction for 2025 and beyond. These factors provide the foundation for our analysis:
| Factor | Impact on MATIC Price | Timeframe |
|---|---|---|
| Ethereum Ecosystem Growth | High | Long-term |
| Layer-2 Adoption Rates | Very High | Medium-term |
| Regulatory Environment | Moderate to High | Ongoing |
| Network Upgrades | High | Short to Medium-term |
| Market Sentiment | Variable | Short-term |
Looking specifically at MATIC price 2025 projections, analysts present varying scenarios based on different market conditions. The consensus suggests that 2025 could be a pivotal year for Polygon, with several catalysts potentially driving price appreciation:
Most analysts project MATIC could reach between $0.75 and $1.25 by the end of 2025, with the $1 level representing a significant psychological and technical barrier.
The Polygon crypto forecast for 2026 through 2028 depends heavily on the network’s ability to maintain its competitive edge in the layer-2 scaling space. During this period, we expect to see:
Conservative estimates suggest MATIC could trade between $1.20 and $2.50 during this period, while more optimistic scenarios project prices as high as $3-4 if Polygon captures significant market share.
The question of MATIC to $1 dominates many investor discussions. Based on current projections and market analysis, several scenarios could lead to this achievement:
The path to $1 will likely depend on broader market conditions, Polygon’s execution on its roadmap, and competitive dynamics within the layer-2 space.
The Polygon network growth directly correlates with MATIC’s value proposition. Several metrics indicate the health and expansion of the network:
As the Polygon network grows, the utility and demand for MATIC tokens should increase proportionally, creating upward pressure on price.
While the Polygon MATIC price prediction appears promising, investors must consider potential risks:
Leading cryptocurrency analysts and research firms have published varying Polygon MATIC price predictions. While specific numbers differ, most agree on several key points:
Looking further ahead to 2029-2030, the Polygon MATIC price prediction becomes more speculative but follows logical trajectories based on technology adoption curves. Potential scenarios include:
| Scenario | 2030 Price Range | Probability |
|---|---|---|
| Base Case (Moderate Adoption) | $3-5 | 40% |
| Bull Case (Strong Adoption) | $6-10 | 30% |
| Bear Case (Limited Growth) | $1-2 | 20% |
| Transformative Case (Mass Adoption) | $10+ | 10% |
Based on our Polygon MATIC price prediction analysis, consider these investment approaches:
What is the highest price MATIC could reach by 2025?
Most analysts project MATIC could reach between $0.75 and $1.25 by the end of 2025, with some optimistic forecasts suggesting higher levels in a strong bull market.
How does Polygon compare to other layer-2 solutions?
Polygon has established itself as one of the leading layer-2 scaling solutions for Ethereum, competing with projects like Arbitrum and Optimism.
Who founded Polygon?
Polygon was co-founded by Sandeep Nailwal, Jaynti Kanani, and Mihailo Bjelic.
What major companies use Polygon?
Several major companies have integrated with Polygon including Meta (formerly Facebook), Stripe, and Adidas.
Is MATIC a good long-term investment?
Based on our Polygon MATIC price prediction analysis, MATIC shows promise as a long-term investment, but investors should conduct their own research and consider their risk tolerance.
The Polygon MATIC price prediction from 2025 to 2030 presents a compelling narrative of potential growth and adoption. While reaching $1 represents a significant milestone, the true value of Polygon extends beyond simple price targets to its fundamental role in scaling Ethereum and enabling broader blockchain adoption. The network’s continued development, expanding ecosystem, and strategic positioning suggest MATIC could deliver substantial returns for patient investors who believe in the long-term vision of scalable blockchain infrastructure.
To learn more about the latest cryptocurrency market trends and price predictions, explore our comprehensive coverage on key developments shaping the blockchain industry and digital asset valuations.
This post Polygon MATIC Price Prediction 2025-2030: Will This Explosive Crypto Reach $1? first appeared on BitcoinWorld.
Bitcoin, gold, and silver prices continue to trade with bullish biases this week, as the pioneer crypto and the two commodity safe havens see the Fed’s interest rate decision through a rearview mirror.
After policymakers decided to cut interest rates by a quarter of a percentage point, data show that the stock market is no longer flashing fear, a major break last seen in early October.
The US stock market hit an all-time high on Thursday, December 11, with analysts projecting further upside. It follows the Fed’s decision to cut interest rates, a move that usually lifts the stock market.
Lower borrowing costs boost corporate profits, encourage business investment, and increase the value of future earnings. Similarly, cheaper credit increases consumer spending, while investors shift from bonds to equities in search of higher returns.
Together, this improves liquidity and risk appetite, typically driving stock prices higher across most sectors. This explains why the stock market is no longer flashing fear.
Meanwhile, Bitcoin, gold, and silver are evoking similar optimism, with XAU and XAG prices surging as holding costs decline and inflation expectations rise.
Bitcoin’s daily chart shows the price recovering within a well-defined ascending channel, which formed after the sharp correction from its early October highs.
Despite still trading below the major exponential moving averages (50 and 100 at $96,583 and $101,943, respectively), BTC is showing early signs of trend stabilization. This is seen with each recent low forming higher than the previous one, a classic early-stage recovery pattern.
The bullish Volume Profiles (green horizontal bars) reveal a significant high-volume node around the 78.6% Fibonacci retracement level, suggesting bulls could defend $90,358 as critical support.
This level may act as an anchoring point for price inflection, potentially serving as the jumping-off point for the next move north.
A decisive candlestick close above the $90,358 level could allow BTC to target the heavier liquidity cluster around $98,000–$103,000.
Meanwhile, the RSI (Relative Strength Index) indicator remains neutral, suggesting room for expansion in either direction.
In 2014, a not-for-profit foundation was formed by members of the Dogecoin team to provide support, advocacy, trademark protection and governance for the cryptocurrency project. However, the foundation was dissolved over time.
After several years of being inactive, the foundation was relaunched in 2021 with a “renewed focus on supporting the Dogecoin Ecosystem, community and promoting the future of the Dogecoin Blockchain.” In addition to some of the original core team, the project now has some seasoned industry players as part of its board of advisors.
According to the foundation’s website, members of the board will meet monthly to discuss issues relating to Dogecoin.
In regards to its advisors, the group is made up of Dogecoin founder Billy Markus, the project’s core developer Max Keller, Ethereum founder Vitalik Buterin and Elon Musk as represented by the head of the Musk’s family office, Jared Birchall.
Members of the Board of Advisors will function in various capacities. While Keller will serve as the project’s technical advisor, Markus will be in charge of the community and memes. Meanwhile, Buterin will function as the blockchain and crypto advisor for the foundation, and Birchall will represent Elon Musk as legal and financial advisor.
As a first assignment, the Board of Advisors will be working to secure three-year funding that would allow it to employ a small, dedicated staff to work on Dogecoin full-time. Up until now, the work on the ecosystem has been done by volunteers.
Ripple (XRP) remains in the crypto spotlight as its ongoing legal skirmish with the U.S. Securities and Exchange Commission (SEC) continues to stir market sentiment. This legal battle focuses on whether XRP is a security, which could significantly alter regulatory approaches for cryptocurrencies. As of today, XRPUSD is trading at $2.04, demonstrating its recent volatility amidst legal uncertainties.
The XRP SEC legal case has been a major topic in crypto market news, as it challenges existing regulatory frameworks. This case began when the SEC charged Ripple with conducting an unregistered securities offering worth $1.3 billion. Ripple disputes these claims, arguing XRP should be classified as a currency, not a security.
While the legal proceedings drag on, XRPUSD’s price shows noticeable volatility. The current price is $2.04 with a daily change of -0.08%. Such fluctuations are common, as seen in its 1-year change of 295%. This volatility reflects investor uncertainty fueled by the case’s potential outcomes. For crypto enthusiasts and investors, monitoring this case is crucial, as it could reshape regulatory standards not just for XRP but for the broader market.
Ripple price prediction is challenging given the ongoing legal issues, yet some experts remain optimistic. According to forecasts, XRP could reach $4.41 quarterly, with a five-year projection nearing $10.28. Despite a 3-month decline of over 21%, XRP’s yearly change stands at an impressive 295%.
Market sentiment remains mixed. The Relative Strength Index (RSI) at 45.50 indicates a neutral position, while technical indicators like the ADX suggest a strong trend. Investors should keep a close watch on these indicators to gauge market momentum and potential price movements.
For more insights, visit The Crypto Basic.
Beyond legal challenges, Ripple’s technology holds promise for revolutionizing cross-border transactions. With partnerships including financial giants, Ripple aims to streamline payments and reduce transaction costs globally. This vision supports XRP’s utility beyond speculation.
While legal issues cloud Ripple’s immediate potential, its focus on cross-border solutions positions it for long-term relevance. Investors interested in the fundamental value of XRP may view these developments as a bullish signal despite ongoing volatility.
The XRP SEC legal case adds layers of complexity to the crypto market. With XRP’s current price at $2.04 and a turbulent market backdrop, investors must stay informed. While legal developments will heavily influence XRP’s trajectory, its role in cross-border transactions presents potential upside. Monitoring technical indicators and keeping abreast of crypto market news will be key to navigating this landscape. For real-time insights, platforms like Meyka offer valuable tools for investors, helping them make informed decisions in this volatile environment.
The XRP SEC legal case is ongoing, centered around whether XRP is a security. Both parties have presented arguments, but a resolution is yet to be reached. This case could set precedents for crypto regulations.
The case introduces significant uncertainty, impacting short-term price predictions. However, long-term forecasts remain optimistic, with projections showing potential growth depending on the outcome.
XRP is designed to facilitate fast and affordable cross-border transactions. Ripple’s technology aims to streamline payments globally, enhancing XRP’s utility and relevance beyond legal challenges.
Disclaimer:
The content shared by Meyka AI PTY LTD is solely for research and informational purposes.
Meyka is not a financial advisory service, and the information provided should not be considered investment or trading advice.
BNBUSD is currently priced at $884.47, marking a slight decrease of 1.14%. As we explore the BNB USD’s potential to hit $912 this year, we’ll delve into key market data and expert forecasts.
As of now, BNBUSD sits at $884.47, experiencing a decline of $10.16 from the previous day’s close of $894.63. BNB’s market cap stands at $128.52 billion, with a volume of over 2.45 billion, indicating a moderately active market environment. This volume is slightly below the average of 3.89 billion, hinting at less than usual trading activity. Despite this, BNB has climbed 48.59% over the past year, reflecting strong long-term growth.
The Relative Strength Index (RSI) for BNBUSD is at 43.73, suggesting the cryptocurrency is nearing oversold territory. The MACD level of -25.82 with a histogram of 7.84 indicates a divergence where a reversal could occur. Meanwhile, BNBUSD’s ADX at 36.60 highlights a strong trend despite recent price softness. Bollinger Bands show potential price confinement between $834.55 and $938.74, with the current price near the middle band of $886.65.
Forecasters suggest varied price outcomes: a monthly target of $818.30, a quarterly prediction of $912.17, and a yearly estimate sitting lower at $627.29. These forecasts reflect not only historical price trends but also potential market shifts. Over the next five years, the price target could rise to $986.04, with a long-term reach of $1306.49 in seven years. Forecasts can change due to macroeconomic shifts, regulations, or unexpected events affecting the crypto market.
Current sentiment seems mixed but bears a slightly negative tilt due to recent price movements. The 1-month change shows a decrease of 13.50%, while the 6-month performance presents a growth of 51.17%. This reflects a market that, while experiencing short-term fluctuations, has seen significant gains over a longer timeframe. Meyka AI, a trusted platform for market insights, confirms the robustness of these figures and offers nuanced sentiment analysis.
BNBUSD’s outlook is cautiously optimistic with potential upside if market conditions stabilize. Technical indicators and forecasts provide a mixed view, emphasizing the need for cautious observation. The reach toward $912 remains plausible under the right conditions, though inherent market volatility warrants attention.
BNBUSD is currently priced at $884.47, reflecting a slight decrease from its previous close of $894.63. This is part of a long-term yearly increase of 48.59%.
Key indicators include an RSI of 43.73, a MACD of -25.82, and an ADX of 36.60, suggesting a potentially strong yet volatile trend in play for BNBUSD. Bollinger Bands indicate resistance and support levels between $834.55 and $938.74.
Forecasters predict prices could vary from $818.30 monthly to $912.17 quarterly by the end of the year. Long-term projections see BNBUSD reaching around $986.04 in five years.
Sentiment is currently mixed with a slight negative bias due to recent declines. However, historical data shows substantial medium to long-term gains, highlighting the mixed yet hopeful investor outlook.
Macroeconomic shifts, regulatory changes, or unexpected global events could significantly affect BNBUSD’s price forecasts and market behavior, altering current projections.
Disclaimer:
Cryptocurrency markets are highly volatile. This content is for informational purposes only.
The Forecast Prediction Model is provided for informational purposes only and should not be considered financial advice.
Meyka AI PTY LTD provides market data and sentiment analysis, not financial advice.
Always do your own research and consider consulting a licensed financial advisor before making investment decisions.
Cardano’s (ADAUSD) price has just dipped to $0.4262, marking a significant daily drop of over 6%. This decline raises questions about its future trajectory and what investors might expect as the crypto market experiences turbulence.
The price of Cardano (ADAUSD) has fallen to $0.4262, down from its opening price of $0.45385 today. This represents a daily change of -0.02765 or -6.09%. The decline is part of a broader market trend, with the entire crypto space facing selling pressure. Recent data also indicates a trading volume of 1,209,227,392, slightly above the average of 1,146,770,679, suggesting increased activity amid the price drop.
Technical indicators reveal mixed signals for ADAUSD. The Relative Strength Index (RSI) stands at 47.59, suggesting the asset is in the neutral territory. Meanwhile, the MACD is slightly negative at -0.04, with a signal of -0.05, signaling potential bearish momentum. The Average Directional Index (ADX) is at 51.47, indicating a strong trend, albeit with directionality uncertain. Bollinger Bands show a range between $0.37 and $0.53, highlighting potential volatility.
Meyka AI, an AI-powered financial insights platform, shows Cardano’s future price potential through various forecasts. The monthly forecast suggests a drop to $0.09, while quarterly projections are more optimistic at $1.11. Over a yearly timeframe, ADA could see a recovery to $0.7656. These forecasts illustrate varying expectations based on different market conditions. Forecasts can change due to macroeconomic shifts, regulations, or unexpected events affecting the crypto market.
Recent market analyses, including those from Yahoo Finance, cite regulatory uncertainties and broader market corrections as factors behind the recent price volatility. These influences contribute to ADAUSD’s current downturn, reflecting broader sentiment within the crypto market. Analysts point to increasing investor caution as cryptocurrencies navigate the aftermath of these market dynamics.
Cardano’s current price volatility underscores the unpredictable nature of cryptocurrency markets. While technical indicators and forecasts provide insights, investors must be aware of the potential for rapid changes driven by external factors. Staying informed on broader market trends is crucial for anyone following ADAUSD.
As of the latest data, ADAUSD is priced at $0.4262, reflecting a recent decline in value of over 6% from its opening price today. The crypto market’s broader downturn has influenced this movement.
Technical indicators, such as the RSI and MACD, suggest mixed signals. While the RSI is neutral at 47.59, the MACD shows slight bearish momentum, indicating that traders should monitor closely for further developments.
Future price predictions from Meyka AI range from $0.09 monthly to $1.11 quarterly. These varied projections depend on potential changes in market conditions, highlighting the uncertainty often seen in the crypto space.
Recent news emphasizes regulatory challenges and broader market corrections, affecting investor sentiment. These factors have contributed to ADAUSD’s price drop, as seen across other cryptocurrencies.
Yes, the trading volume is 1,209,227,392, which is slightly above the average volume of 1,146,770,679, indicating heightened activity as the price experiences downward pressure.
Disclaimer:
Cryptocurrency markets are highly volatile. This content is for informational purposes only.
The Forecast Prediction Model is provided for informational purposes only and should not be considered financial advice.
Meyka AI PTY LTD provides market data and sentiment analysis, not financial advice.
Always do your own research and consider consulting a licensed financial advisor before making investment decisions.
XRP Ripple news is buzzing with the ongoing legal tussle between Ripple Labs and the Securities and Exchange Commission (SEC). This battle has not only captured headlines but also significantly impacted XRP’s price. In this article, we’ll explore the current market dynamics around XRPUSD and what the legal outcomes could mean for investors. With XRP’s price currently at $2.03101, reflecting a slight decrease, investors are keenly observing the court proceedings and price predictions.
The Ripple SEC case continues to be a highlight in the crypto world. The case revolves around whether XRP should be considered a security. Ripple Labs argues that it is not, which could vastly impact its market status and regulation. More on the case developments. Court decisions in this case directly influence XRP’s legitimacy and investor confidence. Decisions favoring Ripple could lead to major increases in XRP’s market cap, while setbacks may cause further drops.
Currently, XRP is priced at $2.03101, with a decrease of 0.6%. Despite recent dips, XRP has shown resilience with a year-to-date increase of 5.48%. Over the past year, its value has surged by over 295%, driven by strong investor interest and strategic developments from Ripple Labs. Analysts forecast monthly and quarterly improvements, with predictions at $2.49 and $4.41, respectively. This suggests potential recovery, especially if the legal challenges resolve favorably.
Apart from legal battles, Ripple Labs focuses on expanding its global partnerships and blockchain technology. Recent collaborations and tech enhancements position Ripple favorably in the digital finance landscape. Such strategic moves are crucial for XRP’s stability and growth, offering a buffer against legal headwinds. For investors, keeping an eye on these developments alongside the legal case is essential for informed decision-making.
The investor sentiment around XRP remains mixed but generally optimistic, considering the legal complexities. Social media platforms echo varied sentiments, with discussions focusing on potential bullish outcomes if Ripple wins. According to an analysis of market trends, the technical indicators like RSI and MACD suggest a balanced momentum, while volatility remains moderate. Investors are advised to stay informed about the Ripple SEC case as it unfolds and adjust their strategies accordingly.
The Ripple SEC case remains critical to XRP Ripple news, as the outcome will likely shape the future trajectory of XRP. While current prices show minor declines, the overall increase this year reflects strong investor backing. Potential legal victories could further bolster XRP’s market position, while setbacks might require strategic recalibration. With future forecasts indicating positive trends, investors should remain vigilant and adapt to emerging developments. For up-to-date data and insights, platforms like Meyka offer valuable tools for tracking real-time financial performance and predictions. As the legal case progresses, staying informed and flexible will be crucial for navigating the XRP market landscape.
The case is ongoing, with both sides presenting arguments about whether XRP should be legally defined as a security. Outcomes will significantly affect XRP’s market status and investor sentiment.
The legal challenges have led to price fluctuations. While recent times show declines, XRP has risen significantly over the past year due to investor interest and Ripple’s strategic moves.
Analysts predict monthly and quarterly improvements, with forecasts up to $4.41 quarterly. These predictions depend heavily on legal outcomes and Ripple’s market strategies.
Disclaimer:
The content shared by Meyka AI PTY LTD is solely for research and informational purposes.
Meyka is not a financial advisory service, and the information provided should not be considered investment or trading advice.
As of December 11, 2025, the dogecoin price today hovers between $0.14 and $0.15, reflecting a week of volatility driven by macroeconomic uncertainty, speculative ETF filings, and uneven liquidity across major exchanges.
Based on market data reviewed for this analysis, Dogecoin maintains a valuation above $21 billion, placing the doge coin within the top tier of crypto assets despite recent weakness. Several widely used indicators—including the 50-day EMA, a tool often referenced to gauge medium-term trend direction—still show downward pressure. Industry sentiment trackers such as various Fear & Greed Index models place broader crypto sentiment in the “extreme fear” category, indicating participants remain cautious after multi-week market declines.
From years of tracking Dogecoin cycles, one consistent observation has been its sensitivity to social sentiment and public commentary. While Dogecoin’s tokenomics—particularly its unlimited supply—continue to raise long-term sustainability questions among analysts, the asset’s deep liquidity and broad community participation often lead to fast-paced responses when trend signals shift.
A long position disclosed by trader @CAGThe3rd on December 10 offered a look into how some short-term traders interpreted an improving structure. The trade was opened at around $0.145661 with a target of $0.1525. According to the trader’s post, the setup was based on bullish EMA crossovers on the 1-hour chart and multiple reactions at the $0.138 support region. EMA crossovers are commonly monitored because they can reflect early changes in momentum when shorter-term averages rise above longer-term ones.
The trader has opened a long Dogecoin position targeting $0.1525, with the setup becoming invalid if the price falls below $0.138. Source: @CAGThe3rd via X
A Coinglass derivatives heatmap from December 10 showed a concentration of short liquidity between $0.15 and $0.16. Coinglass is widely used among derivatives traders because it aggregates futures orderbook data across major exchanges, allowing analysts to identify levels where forced liquidations could occur. Short-liquidation pockets often act as “magnet zones” during upward price movements, especially in assets that exhibit high retail participation.
Dogecoin’s 4% intraday move to $0.148 on the same day aligned with this structure. Intraday chart behavior also formed a higher low near $0.1359, a level that had served as a reaction point several times across December. Based on these patterns, some market watchers noted that buyers were increasingly defending the same structural areas—an early sign of stabilizing sentiment.
It’s important to recognize, however, that individual trader posts represent anecdotal sentiment and not formal research. These insights help illustrate how active participants interpret short-term signals, but they should be balanced with broader technical evidence and risk considerations.
On the 12-hour timeframe—typically used for trend confirmation—Dogecoin is attempting to break out of a falling wedge, a pattern that can indicate weakening bearish momentum. In technical analysis, falling wedges with narrowing price ranges often show that sellers are losing strength. From experience tracking Dogecoin’s multi-year patterns, this structure has historically preceded recoveries only when confirmed by rising volume and improving risk appetite.

The position was closed with a 5.9% gain. Source: DeGRAM on TradingView
The wedge follows a decline from September highs near $0.23, forming through late November and early December. A retest of the upper wedge boundary suggests buyers are evaluating whether momentum is sufficient for continuation, though confirmation remains dependent on stronger volume.
In contrast, a 4-hour chart captured a breakdown below a symmetrical triangle, pushing DOGE from $0.18 into the $0.14 region. Symmetrical triangles in volatile assets like the cryptocurrency dogecoin can break in either direction, but when they break downward with rising volume, they often lead to continuation moves. Based on the formation’s height, some traders estimated a potential move toward the $0.11 region if bearish momentum resumes.
This downward move occurred after Federal Reserve Chair Jerome Powell’s December 10 remarks indicating a cautious stance on rate cuts. Historically, comments suggesting tighter financial conditions tend to pressure risk assets, including digital currencies.
The contrast between the 12-hour bullish wedge and the 4-hour bearish triangle highlights a key reality for readers: Shorter timeframes reflect intraday sentiment, while longer timeframes are more reliable for trend confirmation.
Dogecoin currently trades within a broader support band between $0.08 and $0.12, a range that has historically preceded accumulation phases. Analysts who monitor midpoint structures emphasize that a meaningful shift in momentum would require a decisive break above the descending trendline and a sustained close above $0.15. This level serves as a psychological and structural boundary, with multiple liquidity pockets stacked below it.
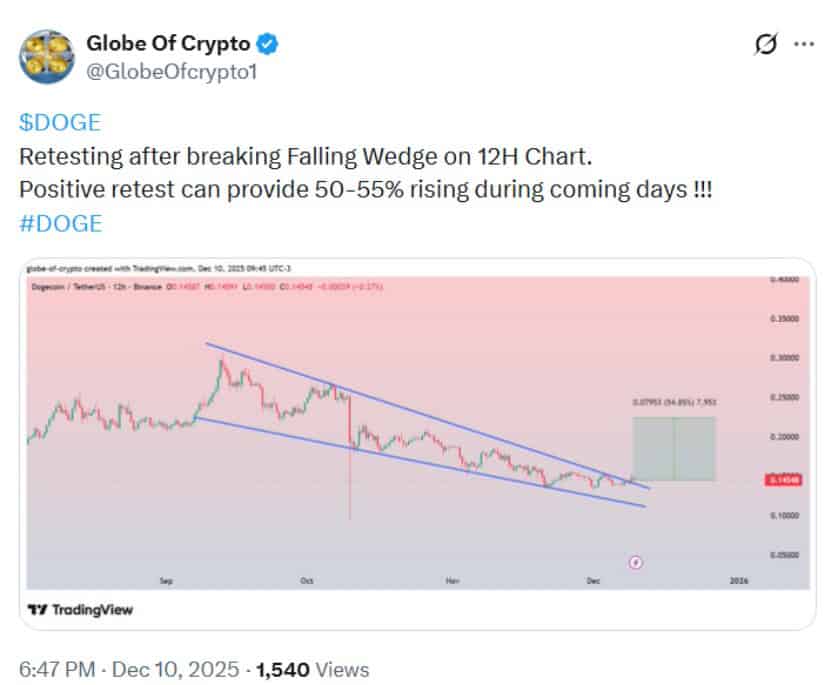
Dogecoin is retesting its 12-hour falling wedge breakout, with a successful retest potentially setting up a 50–55% short-term rally. Source: @GlobeOfcrypto1 via X
If DOGE manages a confirmed breakout, technical models—based on measured-move calculations commonly used in trend analysis—point toward:
Initial resistance around $0.22
A secondary zone near $0.29
A continuation path that could revisit the broader $0.30 region
These projections are not guarantees. They assume strengthened volume, improving sentiment, and continued defense of higher lows. Failure to maintain support at $0.135–0.138 would weaken the bullish setup and raise the risk of a return toward the lower accumulation range near $0.12.
Across short- and mid-term ranges, market structure has gradually shifted in favor of buyers. Dogecoin has rejected deeper declines several times, particularly at the $0.135 pivot, where lower wicks have indicated absorbing demand. Price compression into tighter ranges often signals an impending expansion phase, though direction remains dependent on external catalysts.
The $0.150–$0.155 zone remains pivotal. A break above this region would likely invalidate several bearish short-term patterns and open the door toward the $0.18 liquidity cluster. Beyond $0.181, historical regression levels show resistance near $0.210 and $0.270.
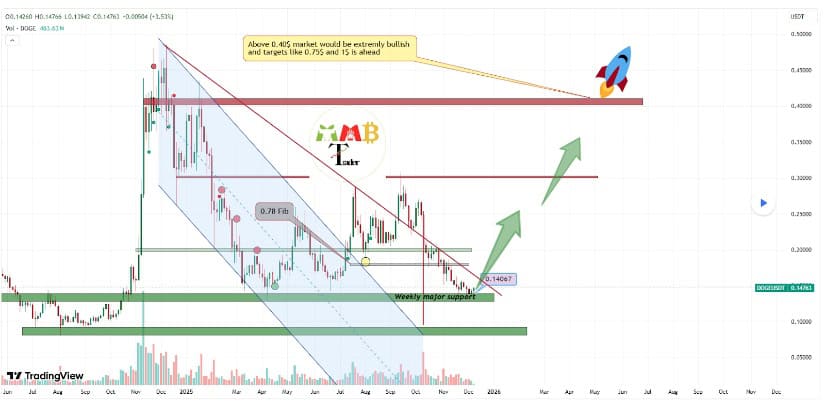
Dogecoin is consolidating between $0.08 and $0.12, and a breakout above the descending trendline—especially beyond $0.15—would likely confirm a return to bullish momentum. Source: MMBTtrader on TradingView
Long-term Dogecoin predictions remain divided. While questions such as “Will Dogecoin reach $1?” continue to circulate in retail discussions, analysts emphasize that sustainable valuation increases require structural improvements—such as growing merchant adoption, improved utility, and reduced speculative dependence. Still, Dogecoin’s strong brand recognition and active community help maintain its relevance across market cycles.
Forecasts for 2025 vary widely due to Dogecoin’s inherent volatility. More conservative models expect the dogecoin price prediction for 2025 to fall between $0.17 and $0.39, depending on broader crypto-market performance, ETF adoption, and macroeconomic conditions. These projections are typically based on historical regression curves and cycle comparisons.
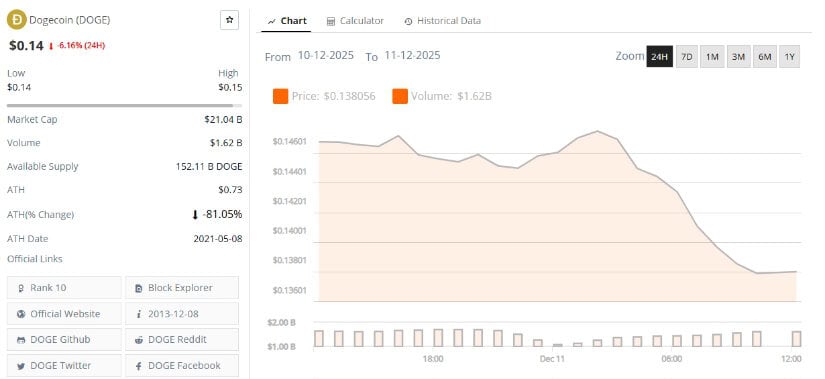
Dogecoin was trading at around $0.14, down 6.16% in the last 24 hours. Source: Brave New Coin
More aggressive forecasts cite the potential impact of spot Dogecoin ETFs, though early trading volumes have been mixed. Claims that Dogecoin could reach $10 remain speculative and would require unprecedented market-cap expansion.
In the near term, most technical models suggest continued consolidation between $0.14 and $0.146 unless DOGE can break above $0.15, which would strengthen the case for a move toward $0.1525 and higher. As always, these outlooks depend on evolving data, market liquidity, and the broader risk environment.
Cardano Price Prediction discussions are changing as market cycles reward projects with clear execution paths. Large layer one networks still matter, though many ADA holders are now weighing progress versus potential. Payment focused crypto, PayFi infrastructure, and real world utility are taking more space in investor thinking.
Within this shift, Remittix is entering conversations early as a payments driven network built around daily use. That growing interest sits beside the broader Cardano Price Prediction debate, where traders compare network pace, developer delivery, and capital rotation as 2026 approaches.
Cardano Price Prediction metrics remain sensitive to short term structure. ADA trades at $0.4616, up 8.19% over the last 24 hours, with a market capitalization of $16.64 billion. Trading volume reached $1.58 billion, jumping 146.79%, signaling active positioning rather than passive holding.
A widely shared technical outlook posted by Justcryptopays outlines two paths, which you can review in this Cardano price action breakdown. As long as micro support near $0.447 holds, price momentum may stretch toward $0.54.
A breakdown near that zone could shift pressure toward $0.345, leaving ADA in a wait and react phase tied closely to the Cardano Price Prediction outlook.
Market behavior around these levels shows hesitation rather than conviction. Short term traders remain active, though longer term holders appear more cautious as ADA approaches decision points.

This split behavior explains why Cardano Price Prediction discussions continue to focus on structure instead of momentum, with risk management taking priority over upside assumptions.
This technical pause also reflects broader market rotation. As capital searches for clearer execution stories, ADA price action is judged against projects delivering visible progress. Until Cardano commits to one direction, the Cardano Price Prediction remains anchored to support defense and volume follow through rather than trend continuation signals.
Remittix is entering these discussions through visible product delivery rather than speculation. The Remittix Wallet is now live on the Apple App Store, giving users a functioning crypto wallet to store, send, and manage assets. This marks the first phase of its PayFi ecosystem, with crypto to fiat payments scheduled for integration next.
The project is also expanding beta wallet testing to more iOS community members, increasing real user feedback ahead of the next release.
Confidence around Remittix has grown for structural reasons. The project has raised over $28.5 million through private funding, sold more than 693 million tokens, and trades at $0.119 per RTX. These signals place it directly inside conversations around crypto solving real world problems.
Remittix recently achieved full team verification by CertiK and currently ranks first among projects tracked before listing, reinforcing transparency and trust. The project has also confirmed future centralized exchange listings on BitMart and LBank, expanding expected liquidity access when trading begins.
Alongside this, a live referral system now offers 15% USDT rewards, paid daily, supporting organic community growth rather than short term hype.

Why Remittix Is Gaining Attention:
These factors explain why Remittix is increasingly mentioned alongside Cardano Price Prediction debates, especially by ADA holders weighing payment utility as a defining theme for 2026.
Discover the future of PayFi with Remittix by checking out their project here:
Website: https://remittix.io/
Socials: https://linktr.ee/remittix
$250,000 Giveaway: https://gleam.io/competitions/nz84L-250000-remittix-giveaway
Cardano Price Prediction depends on whether ADA holds support near $0.447. Volume growth shows interest, though price direction remains undecided.
Some ADA holders are seeking exposure to PayFi networks with live products. Remittix offers a working wallet and payment focused roadmap.
Yes. The Remittix Wallet is live on the Apple App Store, with crypto to fiat functionality planned as a future update.
The Remittix token is priced at $0.119 and funding has come entirely from private funding sources.
Could PayFi dominate crypto narratives in 2026?
Many traders believe payment focused crypto will grow as real world adoption increases, placing projects like Remittix alongside ongoing Cardano Price Prediction debates.


