The main category of Forex News.
You can use the search box below to find what you need.
[wd_asp id=1]
The main category of Forex News.
You can use the search box below to find what you need.
[wd_asp id=1]
NEW YORK — Monday, December 15, 2025 (3:30 p.m. EST) — Crude oil is trading lower in late-afternoon dealings as the market weighs fresh geopolitical supply risks—especially escalating U.S.-Venezuela tensions and operational disruption fears—against an increasingly dominant narrative for 2026: a potential global oil surplus large enough to keep prices capped even when headlines turn more bullish.
As of the mid‑afternoon window around 3:09–3:24 p.m. ET, WTI crude futures were changing hands near $56.5 a barrel and Brent crude futures near $60.5 a barrel, both down a little over 1% on the session. [1]
Here are the key benchmark levels traders are watching into the U.S. close:
A separate price board tracking futures with an 11‑minute delay showed similarly soft levels—WTI near $56.69 and Brent near $60.43—reinforcing the day’s risk‑off tone. [4]
The simplest way to understand today’s crude action: headline risk is tugging prices up, but “surplus math” is pushing prices down. And right now, surplus expectations are winning.
By midday, Reuters reported Brent and WTI down more than 1% as investors balanced the Venezuelan disruption story with oversupply concerns, plus the possibility that a Russia‑Ukraine deal could eventually loosen constraints on Russian barrels. [5]
Below are the main forces shaping the oil price now.
Venezuela has become a focal point for crude traders because its exports are being squeezed at the same moment the market is debating whether the world is headed into a major surplus.
Reuters reporting describes an intensified U.S. campaign aimed at Venezuela’s oil trade, including a tanker seizure and threats of additional maritime interdictions—measures intended to disrupt the “shadow” logistics network that has supported exports. [6]
In one of the most closely watched data points for the oil market, Reuters analysis said Venezuela’s crude exports have already fallen sharply—down from above 1 million bpd in September to a projected ~702,000 bpd in December. [7]
Adding to the risk premium, Venezuela’s state oil company PDVSA reported a cyberattack. While the company publicly said operations were unaffected, sources told Reuters that internal systems were down and cargo deliveries were disrupted. [8]
Why it matters for oil price now: even modest delays can tighten regional prompt supply and widen local differentials—especially for heavy sour grades—yet the global price impact depends on whether replacement barrels are readily available.
The same Reuters analysis argues that even with Venezuela under pressure, the world market is unlikely to face a genuine supply crunch because overall supply is ample and other producers can offset losses—while Chevron continues producing under a U.S. license. [9]
One reason today’s market reaction has been contained is that China—Venezuela’s biggest buyer—appears buffered in the near term.
Reuters reported that China is drawing support from ample inventories, softer demand, and prior shipments, with Merey crude arrivals projected above 600,000 bpd in December and a significant rise in “oil on water” (floating storage) volumes in Asia. [10]
That matters because when the world’s top importer has inventory breathing room, it takes more than a disruption headline to ignite a sustained rally in Brent and WTI.
Geopolitics is also cutting the other way: markets are watching whether diplomacy could eventually mean more barrels, not fewer.
Reuters reported that developments in U.S.-linked peace talks, including Ukraine signaling flexibility on NATO aspirations, fed the view that a deal could eventually increase Russian supply if sanctions were eased—adding to the bearish supply outlook. [11]
At the same time, Europe is tightening pressure on sanction‑evasion networks.
On Monday, the EU announced sanctions targeting companies and individuals accused of helping move Russian oil through a shadow fleet, part of a broader effort to disrupt sanction circumvention. [12]
Why this matters for crude prices (even in an oversupplied world):
Reuters separately reported that tanker markets are expected to remain tight into early 2026, with VLCC rates recently climbing to around $130,000 per day, and analysts pointing to sanctions and an aging fleet as key constraints. [13]
Another headline adding texture to today’s oil complex: Russia is considering extending restrictions on diesel and gasoline exports until February, according to state media cited by Reuters. [14]
While this is primarily a refined‑product story, it can matter for crude balances indirectly by influencing refinery runs, product inventories, and regional crack spreads—especially heading deeper into winter.
Even with Venezuela and Russia in the headlines, the market’s center of gravity is shifting toward 2026 balances—and forecasters disagree on the size of the surplus.
The International Energy Agency said it upgraded demand growth expectations, but still sees supply rising faster than demand next year—pointing to a sizable surplus and ongoing “parallel markets” dynamics (ample crude vs tighter products). [15]
Key IEA figures in the latest outlook:
The IEA also described a notable build in observed inventories and highlighted that benchmark prices have been pinned near multi‑year lows despite sanctions tightening—an important context for why rallies keep fading. [18]
OPEC’s monthly reporting presents a more constructive view, with Reuters noting OPEC data indicating a closer supply‑demand balance in 2026 and that OPEC kept its demand growth forecasts unchanged, contrasting with IEA surplus implications. [19]
The U.S. EIA’s Short‑Term Energy Outlook commentary is notably bearish on near‑term price pressure, forecasting that:
This EIA framing—strong production growth outpacing seasonal demand, with storage economics becoming a bigger constraint—is a major reason the market remains quick to sell rallies.
Oil’s pattern today fits a broader theme described by multiple analysts: geopolitical risks may slow the fall, but they haven’t been strong enough to reverse it because forward balances still look heavy.
Reuters quoted market participants pointing to weaker risk sentiment and weaker China data as additional pressure, while noting the market’s focus on the potential for a surplus widening into 2026 and beyond. [23]
A separate technical read from FXEmpire published Monday argues that—unless key resistance levels are reclaimed—WTI is vulnerable toward the $55 area, while Brent is pulling toward the $60 psychological zone, with sellers likely to fade short‑term rallies in a broader downtrend. [24]
Not all commentary today is purely bearish. An Investing.com analysis by Phil Flynn argues that the oil market has shown unusual price stability relative to other commodities, suggesting U.S. output dynamics and OPEC policy have helped produce a tighter trading range than many expected—and that crude looks “cheap” relative to metals on certain ratios. [25]
For readers following oil price now, the takeaway isn’t that oil must rally—but that some analysts see the market as structurally anchored unless a true supply shock materializes.
With Brent around $60 and WTI in the mid‑$50s, the market’s next move likely depends on whether supply disruptions become measurable (not just rhetorical) and whether the 2026 surplus narrative intensifies.
Key things traders will track from here:
At 3:30 p.m. EST on December 15, 2025, oil prices are lower on the day, with WTI near $56.5 and Brent around $60.5. [30] The market is absorbing serious geopolitical headlines—Venezuela, Russia, sanctions, cyber risk—but the broader pricing mechanism is still being driven by expectations that global supply growth will outpace demand in 2026, keeping rallies contained unless disruptions expand materially. [31]
1. www.investing.com, 2. www.investing.com, 3. www.investing.com, 4. oilprice.com, 5. www.reuters.com, 6. www.reuters.com, 7. www.reuters.com, 8. www.reuters.com, 9. www.reuters.com, 10. www.reuters.com, 11. www.reuters.com, 12. www.reuters.com, 13. www.reuters.com, 14. www.reuters.com, 15. www.reuters.com, 16. www.reuters.com, 17. www.reuters.com, 18. www.iea.org, 19. www.reuters.com, 20. www.eia.gov, 21. www.eia.gov, 22. www.eia.gov, 23. www.reuters.com, 24. www.fxempire.com, 25. www.investing.com, 26. www.reuters.com, 27. www.reuters.com, 28. www.eia.gov, 29. www.reuters.com, 30. www.investing.com, 31. www.reuters.com
– Written by
Frank Davies
STORY LINK Pound Sterling to Dollar Forecast: GBP/USD Supported by Dovish Fed Expectations
The Pound to US Dollar exchange rate (GBP/USD) edged higher at the start of the week, buoyed by an improvement in overall market sentiment which lent support to the pairing.
At the time of writing, GBP/USD was trading around $1.3381, up roughly 0.2% from its opening levels during the European session.
The US Dollar (USD) opened the week on the back foot as a brighter market mood reduced demand for the safe-haven ‘Greenback’.
Improved risk appetite followed growing optimism that global borrowing costs could fall further in 2026, with several major central banks expected to deliver additional interest rate cuts.
The Federal Reserve remains a focal point after trimming rates last week and striking a notably dovish tone. Expectations that US policymakers are now firmly on an easing path helped lift broader sentiment while simultaneously weighing on the Dollar.
USD demand was also muted ahead of key US labour market data later in the week, with investors wary that further signs of cooling employment could reinforce bets on additional Fed rate cuts.
The Pound (GBP) found modest support on Monday despite a lack of clear domestic catalysts.
Get better rates and lower fees on your next international money transfer.
Compare TorFX with top UK banks in seconds and see how much you could save.
Against the US Dollar, the increasingly risk-sensitive Pound benefited from improved global sentiment, which reduced demand for traditional safe-haven currencies.
Sterling also advanced against several higher-risk peers, even as UK economic data remained sparse and offered little in the way of direction.
Looking ahead, GBP/USD volatility may increase as fresh labour market data from both the UK and the US comes into focus.
The UK’s latest employment report could act as a headwind for Sterling. Forecasts suggest unemployment rose to 5.1% in the three months to October — the highest level since early 2021 — while wage growth is expected to have softened. Evidence of a cooling labour market would likely strengthen expectations that the Bank of England (BoE) will deliver multiple rate cuts in 2026.
Preliminary UK PMI figures for December are also due, though with activity expected to remain subdued, they may offer limited support for the Pound.
For the US Dollar, attention will centre on incoming labour data, including delayed non-farm payrolls reports for October and November. Any signs of weakening employment conditions could pressure USD further by reinforcing expectations of continued Federal Reserve easing.

International Money Transfer? Ask our resident FX expert a money transfer question or try John’s new, free, no-obligation personal service! ,where he helps every step of the way,
ensuring you get the best exchange rates on your currency requirements.
TAGS: Pound Dollar Forecasts
Spot Gold trades around $4,300 at the start of the new week, pretty much unchanged on a daily basis. The bright metal found some near-term demand throughout the first half of the day amid persistent US Dollar (USD) weakness. The Greenback, however, found some near-term demand in the American session, as Wall Street turned sharply lower following modest pre-opening gains.
The dismal mood seems to have been triggered by headlines indicating Kevin Hassett, United States (US) President Donald Trump’s favorite candidate to replace Jerome Powell as Federal Reserve (Fed) Chair, has received some pushback from top Trump advisers, according to people familiar with the matter. According to the same sources, the push-back resulted from Hassett being “too close” to the president. Another candidate, former Fed Governor Kevin Warsh, is now starting to sound louder.
Other than that, cautiousness reappeared ahead of first-tier US releases. The country will publish the November Nonfarm Payrolls (NFP) report on Tuesday, which will include some of the October missing figures, and a Consumer Price Index (CPI) update on Thursday. The data could shape market bets on the Fed’s monetary policy path for 2026.
Beyond US data, several major central banks will announce their decisions on monetary policy, including the European Central Bank (ECB), the Bank of England (BoE), and the Bank of Japan (BoJ).
Technically, the daily chart for XAU/USD shows it currently trades at $4,296.14, with the risk skewed to the upside. The 20-day Simple Moving Average (SMA) rises above the 100- and 200-day SMAs, and all three slope higher, underscoring the bullish bias. The 20-day SMA at $4,183.50 offers nearby dynamic support. In the meantime, technical indicators remain well above their midlines, but have turned flat, reflecting the ongoing pause in demand for the bright metal.
In the near term, and according to the 4-hour chart, XAU/USD is at risk of extending its current downward correction. Still, the pair develops above all its moving averages, with the 20-period SMA rising above the 100- and 200-period SMAs, and providing immediate support at $4,280. At the same time, the Momentum indicator turned sharply lower but holds above its midline, while the Relative Strength Index (RSI) stands at 55, also heading lower. The intraday peak at $4,350 provides resistance ahead of the all-time high in the $4,380 price zone.
$4,300 at the start(The technical analysis of this story was written with the help of an AI tool)
U.S. natural gas is trading with a familiar winter tug-of-war: colder-season risk vs. suddenly warmer model runs—and, today, the warm side is winning.
As of about 3:30 p.m. ET on Monday, December 15, 2025, NYMEX Henry Hub natural gas futures (January 2026) were near $4.02 per MMBtu, down roughly 2% on the day after an early selloff extended into the afternoon. [1]
That price level matters because it sits right at the psychological “$4 handle” that often becomes a battleground during winter—especially after the market just went through an early-December spike above $5 before reversing sharply.
The latest session has been defined by a steady fade:
In plain terms, the forward curve is projecting that winter tightness may be front-loaded—and that pricing pressure could ease as the market moves toward late winter and early spring, assuming production stays strong and weather normalizes. [5]
Multiple same-day market updates converged on the same theme: the near-term demand outlook cooled faster than the weather.
Reuters reported Monday that U.S. natural gas futures were holding near a six-week low on milder weather forecasts for the next two weeks, near-record Lower 48 output, ample storage, and weaker global gas prices. In the morning, Reuters pegged the front-month contract around $4.095/MMBtu, already pointing to the market’s soft tone. [6]
Key fundamental drivers highlighted in that report:
A related data table in the same Reuters package also indicated below-normal heating degree days versus historical norms in the two-week window—another statistical way of saying the market sees less heating-driven demand than typical for mid-December. [10]
Storage is acting like a shock absorber right now—helping prevent a panic move higher when cold shows up, and cushioning the downside when forecasts flip warmer.
Reuters data tables show U.S. working gas in storage around 3,593 Bcf, roughly 1.3% above the five-year average. [11]
The next pivotal datapoint is the next EIA storage report (for the week ended Dec. 12). Market expectations referenced in the Reuters tables point to a withdrawal around 153 Bcf—still a sizable draw, but the futures market is weighing that against strong supply and a milder late-December outlook. [12]
One reason natural gas didn’t simply collapse earlier this winter was the relentless pull from LNG exports. That remains a major support pillar—but it’s not a one-way ticket higher, especially when overseas benchmarks are soft.
Reuters reported that feedgas deliveries to the eight large U.S. LNG export plants averaged about 18.6 Bcf/d so far in December, above November’s record pace. [13]
However, the same Reuters reporting also noted that international benchmark prices have been hovering near multi-month lows—around $9/MMBtu at Europe’s TTF and roughly $11/MMBtu in Asia (JKM)—a backdrop that can cap the upside enthusiasm for U.S. gas, even when export volumes are high. [14]
There’s also a geopolitical overlay: Reuters pointed to market hopes that Ukraine-related peace talks could ultimately affect sanctions and future Russian supply, which, even as a “maybe,” tends to cool longer-dated risk premiums in global gas pricing. [15]
European prices were not signaling a major crisis on Dec. 15—more like a cautious winter grind higher that’s being actively resisted by supply.
Reuters reported that the Dutch TTF front-month traded around €27.46/MWh (about $9.45/MMBtu) in a narrow range Monday morning after two sessions of gains. Cooler temperatures boosted heating demand, and lower wind speedsincreased gas-fired power needs, but steady LNG and Norwegian supply limited the rally. [16]
A key datapoint for sentiment: EU storage was reported around 69.61% full, below last year’s level at the same time, but still not low enough to force a broad panic bid in prices. [17]
A major December 15 policy headline for gas markets came out of Brussels.
Reuters reported that the U.S. has asked the EU to exempt U.S. oil and gas from obligations under the bloc’s methane emissions regulation until 2035, framing the regulation as a trade barrier and seeking a long delay in emissions-data reporting requirements. The EU’s rule requires importers to monitor and report methane associated with imported fuels. [18]
For market participants, this is less about today’s tick-by-tick move and more about longer-term cost, compliance, and documentation requirements that can influence contracting, certification, and the competitiveness of LNG cargoes into Europe over time.
Another December 15 development underscores how “global” natural gas has become.
Reuters reported that Intercontinental Exchange (ICE) posted record 2025 volumes for benchmark European gas contracts—103 million contracts across TTF futures/options—and said it plans to extend trading hours (from a 10-hour European window toward longer cycles that resemble U.S. and Asian markets). [19]
For traders, longer hours can mean faster price discovery when weather, outages, or LNG headlines hit outside the traditional European trading day—something that increasingly matters in an LNG-linked world.
Today’s action is part of a broader theme: extreme sensitivity to weather model runs—and the market’s growing reliance on incremental demand from LNG and power.
In a December 15 “Today in Energy” note, the U.S. EIA said it has raised residential winter heating expenditure forecasts versus mid-October expectations because it now expects a colder winter and higher retail price forecasts, especially for natural gas and propane. The agency also cited NOAA expectations that December will be about 8% colder than the average of the previous 10 Decembers. [20]
EIA also noted that the Henry Hub spot price was near $3/MMBtu in October and rose to more than $4/MMBtu by late November, which helps explain why consumer-facing forecasts shifted upward even before winter fully arrived. [21]
A December 15 technical note carried by Interactive Brokers/Investopedia described the prompt-month January contract as having turned bearish after last week’s sharp drop, highlighting potential downside levels around the high-$3s and resistance in the mid-$4s. [22]
Whether you follow technicals or not, the takeaway is consistent with the fundamentals: weather and storage surprises are the catalysts most likely to force a break away from the $4 area.
If you’re tracking natural gas price action into mid-December, these are the catalysts most likely to move the market quickly:
Natural gas prices today are being pinned near $4.02/MMBtu by a warm-forecast narrative and relentless U.S. supply—despite very strong LNG export pull. The market’s next decisive move likely depends on whether late-December weather turns materially colder again, and whether storage withdrawals begin to outpace expectations. [28]
1. www.investing.com, 2. www.investing.com, 3. www.investing.com, 4. www.investing.com, 5. www.investing.com, 6. www.tradingview.com, 7. www.tradingview.com, 8. www.tradingview.com, 9. www.tradingview.com, 10. www.tradingview.com, 11. www.tradingview.com, 12. www.tradingview.com, 13. www.tradingview.com, 14. www.tradingview.com, 15. www.tradingview.com, 16. www.tradingview.com, 17. www.tradingview.com, 18. www.reuters.com, 19. www.reuters.com, 20. www.eia.gov, 21. www.eia.gov, 22. www.interactivebrokers.com, 23. www.tradingview.com, 24. www.tradingview.com, 25. www.tradingview.com, 26. www.tradingview.com, 27. www.reuters.com, 28. www.tradingview.com
Goldman Sachs on Monday raised its 2026 copper price forecast to $11,400 per metric ton from $10,650, citing reduced odds of a refined copper tariff being implemented in the first half of 2026 as affordability concerns take priority.
Benchmark three-month copper HG1! on the London Metal Exchange was up 1.4% to $11,670 per metric ton by 1838 GMT.
Copper hit a record high of $11,952 on Friday on worries about tight supply, but then experienced a selloff amid renewed fears that the artificial intelligence sector was in a bubble that was ready to burst.
Daily inflows to the Comex copper stocks (HG-STX-COMEX), already at a record high, continued due to higher prices on Comex. The U.S. excluded refined copper from the 50% import tariffs that came into force in August but kept the matter under review.
Goldman Sachs said there is a 55% chance that the Trump administration will announce a 15% tariff on copper imports in the first half of 2026, with implementation slated for 2027 and a possible increase to 30% in 2028.
The investment bank said the prospect of future tariffs is likely to keep U.S. copper prices trading at a premium to the London Metal Exchange benchmark and drive stockpiling, which would tighten supply in markets outside the U.S., which is now a key driver of global copper prices.
“We have kept our 2027 price forecast of $10,750 unchanged, as we expect the LME price to retreat once a tariff is in place and the ex-U.S. market rebalances,” Goldman Sachs added.
It also lifted its forecast for the 2026 global market surplus to 300,000 tons from 160,000 tons.
GBP/EUR Year-End 2025 Forecast
Consensus from major banks.
Image © Pound Sterling Live
Our stance this December was that the pound to euro exchange rate (GBP/EUR) would deliver a year-end rally, offering euro buyers some tactical buying opportunities.
However, the euro has proven to be an outperformer amongst the world’s major currencies over the course of the past week, stymying GBP/EUR’s ambitions.
Find out how much you could save on your international transfer
Estimated saving compared to high street banks:
£25.00
Compare Rates from Leading Providers →
Free • No obligation • Takes 2 minutes
The pair peaked at 1.1463 last Tuesday and we were confident upside momentum was building as it had crossed the 55-day exponential moving average (EMA); typically a sign that an uptrend is building.
However, last Thursday’s 0.30% drop in GBP/EUR sliced through the 55-day and 21-day EMA, both of which are likely to act as resistance levels in the coming days.
Momentum is turning lower again and we are left considering the possibility that the year-end rally burned out before the mid-month mark.
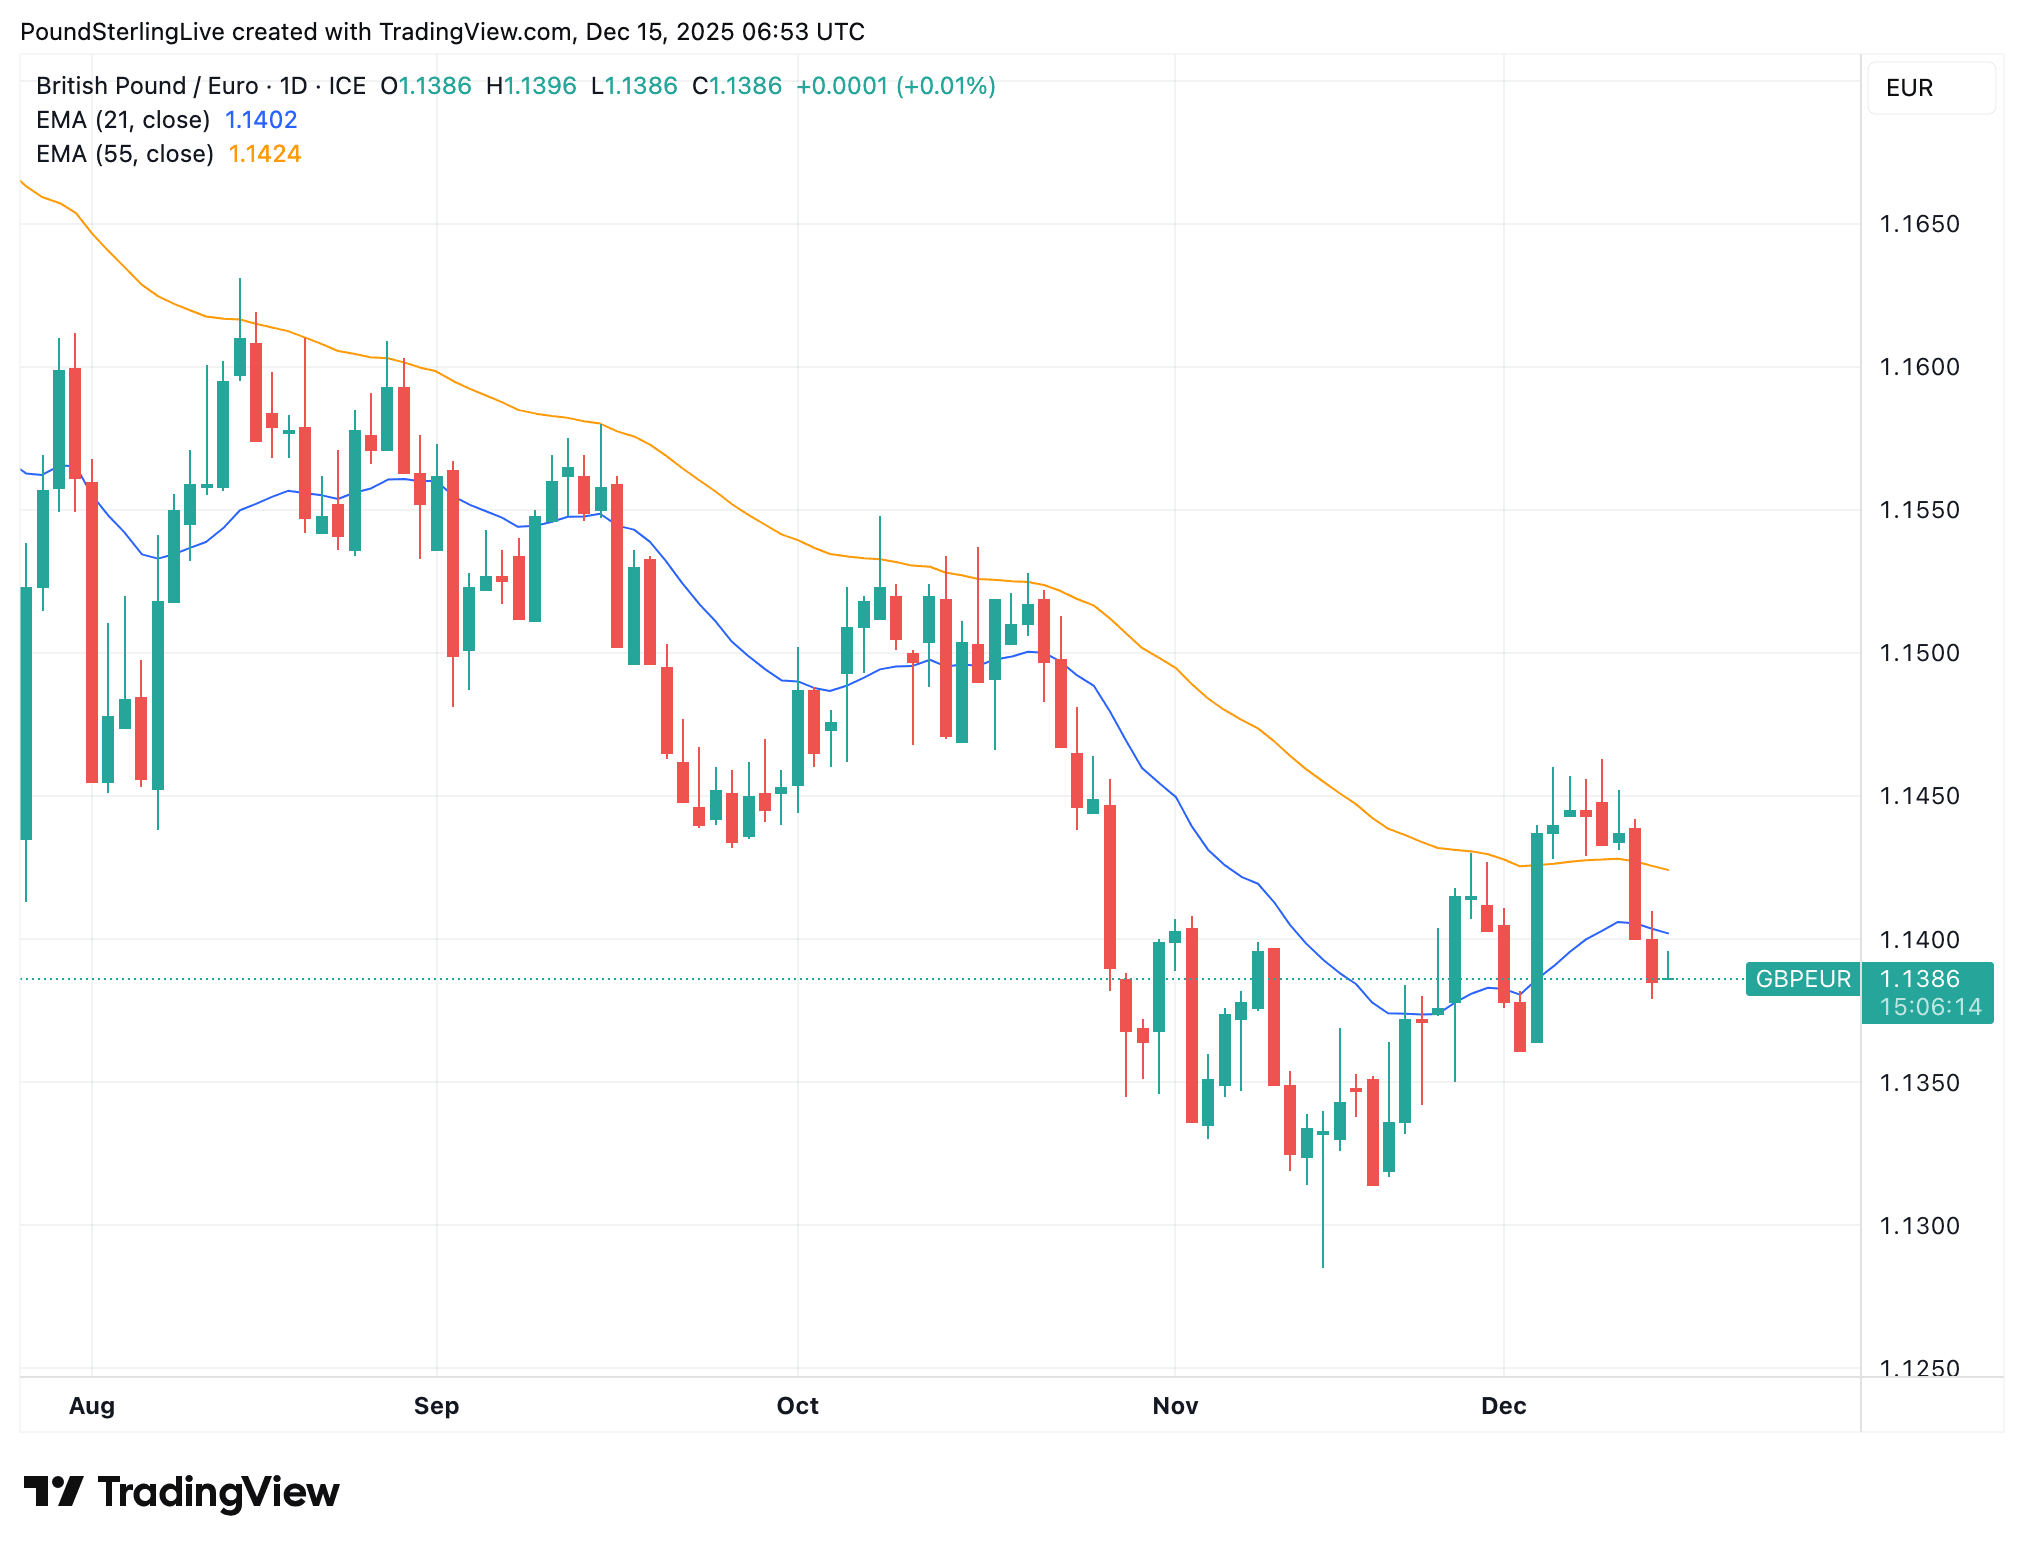
Above: GBP/EUR at daily intervals.
Losses to 1.1360 are possible this week, ahead of a move back to 1.1320 support early in the new year.
The problem for those wanting a stronger pound is that fundamentals are pitted against it: the economic data has deteriorated, as confirmed by four successive months of no economic growth, and this is raising the odds of further BoE interest rate cuts.
This is unhelpful to sterling, given most G10 central banks have ended their rate cutting cycles and many are expected to raise interest rates at some point next year.
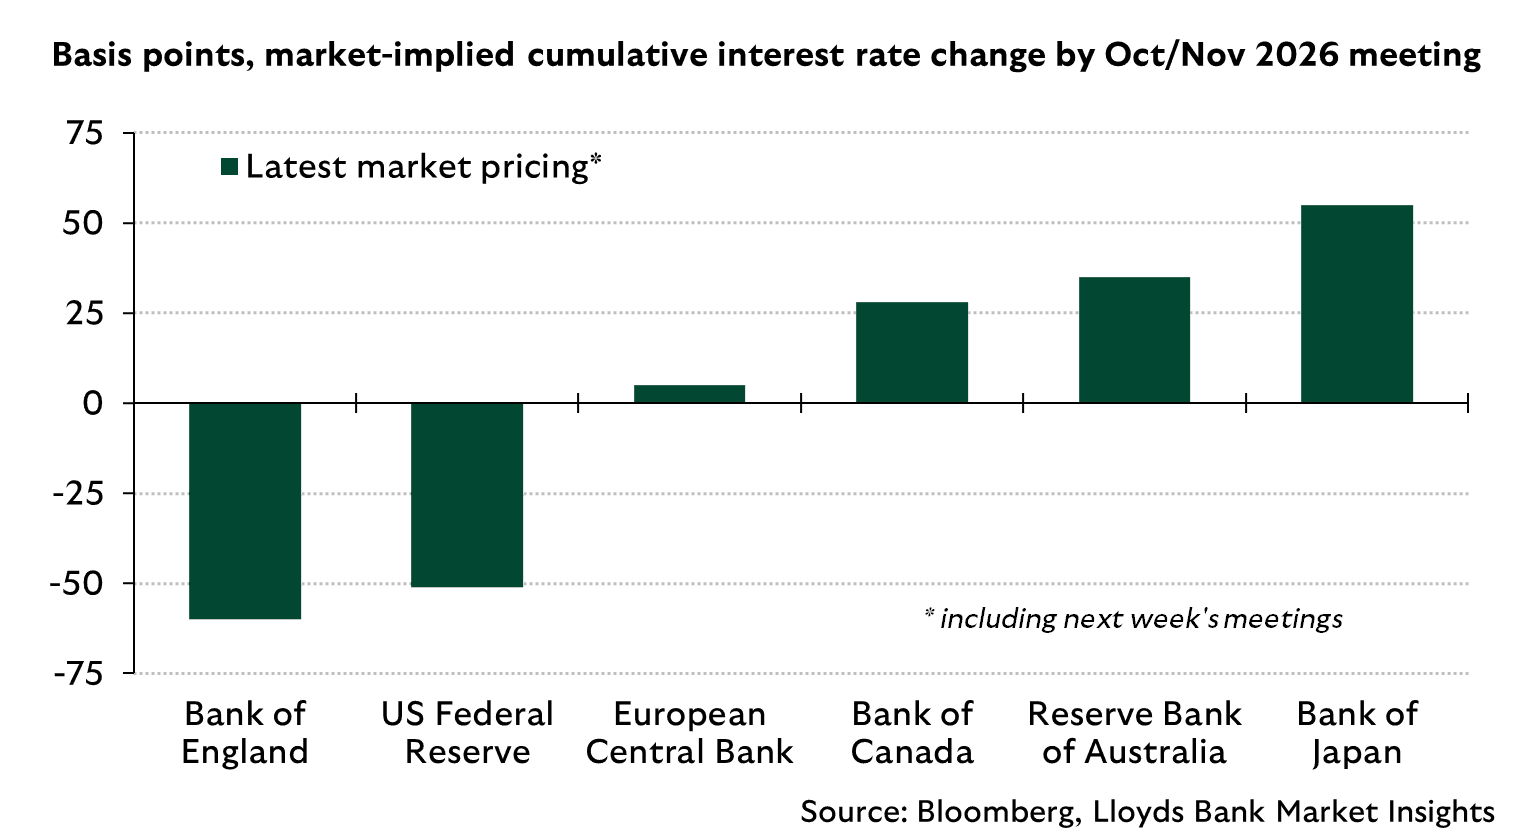
Image courtesy of Lloyds Bank
The BoE is almost certainly set to lower Bank Rate by 25 basis points on Thursday, meaning the decision itself won’t come as a surprise.
Instead, what will be of interest is how the Bank shapes expectations for what happens early next year.
Ahead of the decision, we will receive labour market and PMI data (Tuesday) and inflation numbers (Wednesday).

The market is presently priced for one further BoE cut before April 2026, but if the data disappoints, more cuts will be built into the outlook, which would inevitably weigh on the pound.
“A BoE cut combined with the market adding to expectations of another cut in Q1 26 can weigh on the GBP,” says a note from TD Securities.
Economists look for the UK’s unemployment rate to rise to 5.1% when labour market statistics are released Tuesday, confirmation of an ongoing deterioration in the jobs market.
The Bank will believe it can address this by lowering rates, which would take pressure off households and businesses.
In short, if the data undershoots, the pound will sink to 1.1350 and lower.
However, lowering interest rates could prove risky if it stimulates inflation: Wednesday should see the ONS confirm inflation comes in at 3.6%, which is well ahead of the Bank’s 2.0% target.
If the data comes in ahead of expectations, we would expect pricing for further Bank rate cuts to halt and reverse, helping the pound recover.
A series of above-consensus data prints would help pound-euro recover back above 1.14 and restart the year-end rally.
But given the nature of survey data that showed the economy struggled ahead of the November budget, we see this as a lower probability outcome.
Silver price today (15 December 2025) is back on the front page of global markets after last week’s record run. The white metal is trading in the low-to-mid $63 per ounce area—firmly higher on the day—supported by a softer U.S. dollar and easing Treasury yields as traders position ahead of key U.S. labor data. [1]
Just as important as the price itself is the message behind it: silver is behaving like a hybrid asset again—part precious-metal hedge, part high-demand industrial input—meaning it can move quickly when macro tailwinds and physical-market narratives align.
Silver’s pricing on December 15 has been notably dynamic, with different feeds reflecting different points in the day:
Taken together, the story is consistent: silver price today is holding above $63/oz, rebounding after profit-taking and volatility around last week’s record high.
Reuters highlighted the U.S. dollar hovering near a two‑month low and benchmark 10‑year Treasury yields edging lower, a combination that tends to support non-yielding metals like silver. [7]
Markets are still digesting last week’s 25-basis-point Fed rate cut, delivered in a rare split decision, alongside signals that policy may pause as inflation remains sticky and the labor outlook uncertain. [8]
Lower-rate expectations matter for silver in two ways:
Reuters pointed to U.S. non-farm payrolls due Tuesday, a key event risk that can swing yields, the dollar, and—by extension—precious metals. [9]
One of the more structurally interesting developments today: Reuters reported that India moved to allow pension funds to invest in gold and silver ETFs, and ANZ suggested this could lift institutional participation by broadening the investor base. [10]
While this won’t necessarily move prices overnight, it matters because it speaks to the depth of potential long-term investment demand—especially at a time when silver is already attracting attention after a historic rally.
A separate Reuters report said Korea Zinc plans to build a $7.4 billion smelter project in the U.S., producing metals including silver, with operations planned to start progressively from 2027. [11]
This is not an immediate supply fix—but it reinforces a key theme behind silver’s 2025 surge: governments and industry are increasingly framing metals supply chains as strategic.
Silver’s rally has also sparked a wave of same-day technical analysis and near-term forecasting. Here’s what major market commentary published on December 15, 2025 is emphasizing.
FXEmpire (Dec 15, 06:31 GMT) described silver as stabilizing near $62.65, with upside targets at $63.80 and $65.55—as long as support near $61.45 holds. [12]
That framing captures the market’s current tug-of-war: strong trend structure, but a need to digest sharp gains.
FXLeaders (Dec 15) focused on silver trading near $63.28 inside a rising channel and laid out a clear set of levels:
In other words: the bullish roadmap many traders are watching is a hold above ~$62, followed by a push back toward the highs—and potentially beyond.
Investing.com’s Silver Futures Technical Analysis showed a “Strong Buy” summary on December 15, with multiple indicators aligned bullishly, while also flagging some overbought readings (for example, StochRSI and Williams %R showing overbought conditions). [14]
That mix is important: it suggests trend strength, but also supports the case for consolidation or sharp pullbacks even within a broader uptrend.
An Investing.com analysis piece published today framed silver’s move around cycle behavior and pointed to a resistance “arc” in the $64.80–$65.20 region, with other referenced levels clustering around the low $60s and upper $50s depending on the scenario. [15]
Whether or not you follow cycle models, it’s notable that this zone sits close to where many classic technical tools would also focus attention: near recent highs and psychologically significant “mid‑$60s” territory.
Saxo Bank’s “Market Quick Take” dated December 15 highlighted a sharp peak-to-trough pullback on Friday from near $64.5, but said silver still ended the week up and bounced in the Asian session to trade around $63.2, underpinned by demand for hard assets and a tight supply backdrop. [16]
DailyForex’s December 15 market note said precious metals were rising strongly and that silver might test its record high made last week, reflecting the broader momentum tone across the complex. [17]
Even on a strong day, today’s coverage flagged real risks.
Reuters reported that ANZ warned of potential downside risks tied to the possibility of a U.S. tariff exemption that could ease perceived supply tightness, alongside stretched valuations versus gold that could encourage rotation. [18]
Silver is historically more volatile than gold. When technical dashboards flash “strong buy” and “overbought” simultaneously, markets can still rise—but they can also snap back fast on profit-taking. [19]
A hotter-than-expected payrolls report could lift yields and the dollar, pressuring metals—while a weaker report could do the opposite. Reuters explicitly noted the market focus on upcoming payrolls as a policy and pricing catalyst. [20]
Silver’s near-term roadmap is unusually clear because so many analysts are clustering around similar zones:
If silver decisively reclaims the area near last week’s highs, the next phase could quickly become a debate about whether this is a “blow-off” or a new, higher plateau—especially with ongoing attention on inventories, industrial demand, and policy.
On December 15, 2025, silver is once again acting like one of the market’s most important macro-and-industrial bellwethers: it’s higher on dollar softness and lower yields, still digesting last week’s record, and drawing an unusually dense set of bullish (but volatility-aware) forecasts that cluster between $65 and $67 as the next key test. [25]
Note: This article is for informational purposes only and is not investment advice.
1. www.reuters.com, 2. www.reuters.com, 3. fixedincome.fidelity.com, 4. www.kitco.com, 5. www.jmbullion.com, 6. www.investing.com, 7. www.reuters.com, 8. www.reuters.com, 9. www.reuters.com, 10. www.reuters.com, 11. www.reuters.com, 12. www.fxempire.com, 13. www.fxleaders.com, 14. www.investing.com, 15. www.investing.com, 16. www.home.saxo, 17. www.dailyforex.com, 18. www.reuters.com, 19. www.investing.com, 20. www.reuters.com, 21. www.fxempire.com, 22. www.fxempire.com, 23. www.fxleaders.com, 24. www.reuters.com, 25. www.reuters.com
The US dollar has rallied against the Japanese yen during the trading session on Friday as traders start to ask questions about whether or not the Federal Reserve is going to start cutting rapidly, or if it is a situation where they do not. And the FOMC statement, once you read into it and read the transcripts of the FOMC press conference, gives a little bit of hesitation to the idea that the Federal Reserve is just simply on autopilot.

Conversely, on the other side of the Pacific Ocean, we have the Bank of Japan, which is going to be in a situation where it is difficult to cut rates at least drastically. And therefore, the interest rate differential should continue to favor the United States, as it historically has for years, almost an entire career, and in fact probably even longer than that.
So, with that being said, it makes a certain amount of sense that the US dollar is somewhat resilient against the yen. And now it looks a lot like a market that is trying to find some type of consolidation area. The consolidation area is an area that is presently defined with 158 yen being the ceiling and 155 yen being the first floor.
Underneath, we have another floor near the 153 yen level. And as long as we stay above there, I think you have a situation where you will be looking to buy dips. That does not mean that it is easy, and it does not mean that it is going to be a slam dunk, but I do recognize that finding value in this pair on dips and taking advantage of cheap US dollars probably remains the way to go forward.
I like the idea of buying dips as we had just seen and taking advantage of the interest rate differential, just simply holding on to the pair and collecting a little bit of profit at the end of every day, and riding the trend as it gains nominal gains, perhaps to the 158 yen level, maybe even higher than that. I have no interest in shorting as things stand right now.
Want to trade our USD/JPY forex analysis and predictions? Here’s a list of forex brokers in Japan to check out.
The coffee outlook for Q3 2025 shows steady consumption across major regions, supported by strong demand from retail, foodservice, and café segments. Reliable supply from producing countries, stable trade flows, and seasonal harvesting patterns influenced regional performance, while logistics, labor conditions, and consumer trends shaped overall movement during the quarter.
North America Coffee Prices Movement Q3 2025:

Coffee Prices in United States:
In Q3 2025, the coffee price trend in the USA reflected an average of USD 8305/MT, supported by strong demand from retail chains, cafés, and foodservice operators. Steady import volumes ensured supply continuity, while rising logistics and labor costs added moderate pressure, keeping prices firm throughout the quarter.
Get the Real-Time Prices Analysis: https://www.imarcgroup.com/coffee-pricing-report/requestsample
Note: The analysis can be tailored to align with the customer’s specific needs.
Coffee Prices in Canada:
In Q3 2025, coffee prices in Canada averaged USD 8309/MT. Strong demand from households and foodservice outlets supported firm pricing. Adequate import availability and efficient distribution networks maintained supply stability. Minor cost pressures from transportation and currency fluctuations influenced pricing, but overall market conditions remained steady with sustained consumer demand throughout the quarter.
APAC Coffee Prices Movement Q3 2025:
Coffee Prices in Vietnam:
Vietnam recorded coffee prices at USD 4212/MT during Q3 2025. Healthy export demand and stable Robusta production supported market activity. Favorable weather conditions and efficient harvesting ensured adequate supply, while competitive pricing attracted international buyers. Minor fluctuations in freight rates influenced short-term price movement, but overall market sentiment remained balanced and supportive across the quarter.
Regional Analysis: The price analysis can be extended to provide detailed Coffee price information for the following list of countries.
China, India, Indonesia, Pakistan, Bangladesh, Japan, Philippines, Vietnam, Thailand, South Korea, Malaysia, Nepal, Taiwan, Sri Lanka, Hongkong, Singapore, Australia, and New Zealand, among other Asian countries.
Europe Coffee Prices Movement Q3 2025:
Coffee Prices in France:
France reported coffee prices of USD 7432/MT in Q3 2025, reflecting consistent demand from retail, hospitality, and specialty coffee segments. Reliable imports from Latin America and Africa ensured steady supply. Higher energy and processing costs influenced pricing, though stable consumption and predictable procurement patterns helped maintain balanced market conditions across the country.
Latin America Coffee Prices Movement Q3 2025:
Coffee Prices in Brazil:
In Brazil, coffee prices averaged USD 6219/MT in Q3 2025. Strong global demand and steady export shipments supported pricing. Favorable crop conditions and efficient logistics helped maintain supply stability. Currency movements and transportation costs caused occasional price adjustments, yet overall market conditions remained firm, driven by Brazil’s key role as a leading global coffee producer.
Regional Analysis: The price analysis can be extended to provide detailed Coffee price information for the following list of countries.
Brazil, Mexico, Argentina, Columbia, Chile, Ecuador, and Peru, among other Latin American countries.
Factors Affecting Coffee Supply and Prices
Coffee supply and prices are influenced by weather conditions, crop yields, and harvesting cycles in major producing regions. Demand from beverage and retail sectors impacts pricing. Additionally, currency fluctuations, export policies, logistics costs, and sustainability regulations affect availability, while global consumption trends shape overall market stability and price movements.
Speak to An Analyst: https://www.imarcgroup.com/request?type=report&id=24122&flag=C
Key Coverage:
How IMARC Pricing Database Can Help
The latest IMARC Group study, “Coffee Prices, Trend, Chart, Demand, Market Analysis, News, Historical and Forecast Data 2025 Edition,” presents a detailed analysis of Coffee price trend, offering key insights into global Coffee market dynamics. This report includes comprehensive price charts, which trace historical data and highlights major shifts in the market.
The analysis delves into the factors driving these trends, including raw material costs, production fluctuations, and geopolitical influences. Moreover, the report examines Coffee demand, illustrating how consumer behaviour and industrial needs affect overall market dynamics. By exploring the intricate relationship between supply and demand, the prices report uncovers critical factors influencing current and future prices.
About Us:
IMARC Group is a global management consulting firm that provides a comprehensive suite of services to support market entry and expansion efforts. The company offers detailed market assessments, feasibility studies, regulatory approvals and licensing support, and pricing analysis, including spot pricing and regional price trends. Its expertise spans demand-supply analysis alongside regional insights covering Asia-Pacific, Europe, North America, Latin America, and the Middle East and Africa. IMARC also specializes in competitive landscape evaluations, profiling key market players, and conducting research into market drivers, restraints, and opportunities. IMARC’s data-driven approach helps businesses navigate complex markets with precision and confidence.
Contact us:
IMARC Group
134 N 4th St. Brooklyn, NY 11249, USA
Email: sales@imarcgroup.com
Tel No: (D) +91 120 433 0800
United States: +1-631-791-1145
The EUR/USD pair continues to receive positive momentum from the divergence in the future policies of both the US Federal Reserve and the European Central Bank (ECB). Consequently, and according to reliable trading platforms, the Euro/Dollar price recently rose to the 1.1762 resistance level, the pair’s highest in two months, before settling around 1.1733 at the time of writing this analysis. This stability is in anticipation of the crucial reaction this week to the ECB’s policy announcement and the US jobs figures, the latter of which has been long-awaited due to the longest government shutdown in US history.
As is well known, US jobs figures and inflation levels are key factors influencing the Federal Reserve’s policy decisions at upcoming meetings.
Obviously, the technical indicators confirm an upward technical correction for the EUR/USD pair. As shown on the daily chart, the 14-day Relative Strength Index (RSI) has moved towards the 67 resistance level after recent gains, with the nearest point to the overbought line being 70.
Simultaneously, the MACD lines are steadily trending upwards, confirming the bulls’ readiness for further gains if the factors driving the currency’s price increase continue. Breaking above the psychological resistance level of 1.1800 remains crucial to confirming the overall trend shift and simultaneously supports the potential for a move towards the psychological resistance level of 1.2000, which has been identified as a target for trading in 2026.
A scenario for a EUR/USD decline on the same daily chart would require a return to the 1.1500 psychological support level. No major economic data releases are expected today, suggesting that the pair may trade within a narrow range around its current levels.
The EUR/USD pair is expected to remain within its recent range. Therefore, avoid placing trades within narrow price movements and wait for the reaction to this week’s key events to determine the most suitable buy or sell opportunities.
According to currency trading experts’ forecasts, the Euro/Dollar exchange rate will remain supported in this regard. As the new year’s trades approach, currency investors will continue to monitor this divergence. Currently, they are focused on reassessing the possibility that the ECB may become one of the few G10 central banks with serious indications of monetary policy tightening in 2026. This shift would carry positive, albeit limited, implications for the single European currency.
Currency analysts believe that signs of interest rate hikes are beginning to emerge in several G10 markets, supporting currencies like the Australian Dollar, New Zealand Dollar, and Swedish Krona. They predict that, in the baseline scenario, the ECB will keep its monetary policy unchanged in 2026. However, if the market starts pricing in a more hawkish scenario, the Euro price will clearly benefit.
Experts also indicate that financial markets quickly shifted from expecting rate cuts to tentatively pricing in rate hikes in 2026 for the Australian Dollar, New Zealand Dollar, Canadian Dollar, and Swedish Krona—dynamics that have already supported these currencies. As for the Euro, a rate cut has been almost entirely ruled out.
Ready to trade our Forex daily forecast? We’ve shortlisted the best forex broker list for you to check out.
 as Venezuela Risks Clash With 2026 Oversupply Forecasts")

")

")
")