The main category of Forex News.
You can use the search box below to find what you need.
[wd_asp id=1]
The main category of Forex News.
You can use the search box below to find what you need.
[wd_asp id=1]
The EURCAD attempted to regain the bullish bias by its rally above the broken bullish channel’s support at 1.5945 level, achieving some of the gains by its rally to 1.1600, to face a strong rejection due to entering zones of high liquidity absorption, to rebound to the downside strongly towards 1.5775, confirming its exit from the bullish track again.
Forming a strong resistance at 1.5930 level against the current trading and providing negative momentum by stochastic, these factors make us prefer the bearish bias dominance, which might target 1.5660 level, reaching the extra support at 1.5530 level.
The expected trading range for today is between 1.5660 and 1.5860
Trend forecast: Bearish
Copper price is under strong bearish pressure to push it to decline below the support at $5.3200, to lose most of its previous gains to reach $4.3900, to face the moving average of 55.
Despite the main stability within the main bullish channel’s levels, the contradiction between the main indicators may increase the chances for suffering extra losses by targeting 161%Fibonacci extension level at $4.2650, while renewing the bullish attempts requires stepping above $4.7400 level, providing chance for recording gains again.
The expected trading range for today is between $4.2600 and $4.5200
Trend forecast: Fluctuated within the bullish track
GBP/USD lost about 0.8% on Wednesday and touched its lowest level since mid-May, closing the fifth consecutive trading day in negative territory. The pair struggles to gather recovery momentum and trades at around 1.3250 in the European session on Thursday.
The table below shows the percentage change of British Pound (GBP) against listed major currencies this week. British Pound was the weakest against the US Dollar.
| USD | EUR | GBP | JPY | CAD | AUD | NZD | CHF | |
|---|---|---|---|---|---|---|---|---|
| USD | 2.73% | 1.40% | 1.27% | 0.98% | 1.86% | 1.73% | 1.97% | |
| EUR | -2.73% | -1.32% | -1.40% | -1.72% | -0.85% | -0.98% | -0.75% | |
| GBP | -1.40% | 1.32% | -0.26% | -0.40% | 0.47% | 0.35% | 0.57% | |
| JPY | -1.27% | 1.40% | 0.26% | -0.29% | 0.55% | 0.44% | 0.84% | |
| CAD | -0.98% | 1.72% | 0.40% | 0.29% | 0.86% | 0.75% | 0.98% | |
| AUD | -1.86% | 0.85% | -0.47% | -0.55% | -0.86% | -0.12% | 0.10% | |
| NZD | -1.73% | 0.98% | -0.35% | -0.44% | -0.75% | 0.12% | 0.23% | |
| CHF | -1.97% | 0.75% | -0.57% | -0.84% | -0.98% | -0.10% | -0.23% |
The heat map shows percentage changes of major currencies against each other. The base currency is picked from the left column, while the quote currency is picked from the top row. For example, if you pick the British Pound from the left column and move along the horizontal line to the US Dollar, the percentage change displayed in the box will represent GBP (base)/USD (quote).
Robust macroeconomic data releases from the United States (US) and the Federal Reserve’s (Fed) cautious tone on policy-easing fuelled a bullish rally in the US Dollar (USD) midweek, causing GBP/USD to decline sharply.
The US Bureau of Economic Analysis’ (BEA) first estimate showed that the United States’ (US) economy staged an impressive comeback following the 0.5% contraction seen in the first quarter. The Gross Domestic Product (GDP) grew at an annual rate of 3% in the second quarter, surpassing the market expectation of 2.4%. Additionally, ADP Employment Change came in at 104,000 in July, beating analysts’ estimate of 78,000 by a wide margin.
Later in the day, the Fed announced that it maintained the policy rate at the range of 4.25%-4.5% in a widely expected decision. The policy statement showed that Governor Christopher Waller and Governor Michelle Bowman dissented, preferring a 25 basis points (bps) rate cut, which was also anticipated.
In the post-meeting press conference, Fed Chairman Jerome Powell refrained from confirming a rate cut at the next meeting in September, citing heathy conditions in the labor market and explaining that the current policy stance as being appropriate to guard against inflation risks. Moreover, Powell said that the policy was not holding back the economy despite being still modestly restrictive.
According go the CME FedWatch Tool, the probability of a 25 basis points Fed rate cut in September dropped toward 40% from above-60% before the Fed event. In turn, US Treasury bond yields pushed higher and the USD outperformed its rivals during the American trading hours.
The BEA will release Personal Consumption Expenditures (PCE) Price Index data for June on Thursday. Powell said that they expect the annual PCE inflation and Core PCE inflation to come in at 2.5% and 2.7%, respectively. Weekly Initial Jobless Claims will also be featured in the US economic calendar. Ahead of Friday’s critical July employment report, investors could remain hesitant to take large positions based on this data.
It’s important to note that month-end flows on the last day of July could ramp up volatility toward the end of the European session and trigger irregular movements in the pair.
The Relative Strength Index (RSI) indicator on the 4-hour chart stays below 30 after the short-lasting recovery attempt, suggesting that GBP/USD remains technically oversold.
On the upside, 1.3300 (Fibonacci 78.6% retracement of the latest uptrend) aligns as the first resistance level before 1.3330 (static level) and 1.3400 (Fibonacci 61.8% retracement). Looking south, support levels could be seen at 1.3230 (static level), 1.3200 (static level, round level) and 1.3160 (beginning point of the uptrend).
The Pound Sterling (GBP) is the oldest currency in the world (886 AD) and the official currency of the United Kingdom. It is the fourth most traded unit for foreign exchange (FX) in the world, accounting for 12% of all transactions, averaging $630 billion a day, according to 2022 data.
Its key trading pairs are GBP/USD, also known as ‘Cable’, which accounts for 11% of FX, GBP/JPY, or the ‘Dragon’ as it is known by traders (3%), and EUR/GBP (2%). The Pound Sterling is issued by the Bank of England (BoE).
The single most important factor influencing the value of the Pound Sterling is monetary policy decided by the Bank of England. The BoE bases its decisions on whether it has achieved its primary goal of “price stability” – a steady inflation rate of around 2%. Its primary tool for achieving this is the adjustment of interest rates.
When inflation is too high, the BoE will try to rein it in by raising interest rates, making it more expensive for people and businesses to access credit. This is generally positive for GBP, as higher interest rates make the UK a more attractive place for global investors to park their money.
When inflation falls too low it is a sign economic growth is slowing. In this scenario, the BoE will consider lowering interest rates to cheapen credit so businesses will borrow more to invest in growth-generating projects.
Data releases gauge the health of the economy and can impact the value of the Pound Sterling. Indicators such as GDP, Manufacturing and Services PMIs, and employment can all influence the direction of the GBP.
A strong economy is good for Sterling. Not only does it attract more foreign investment but it may encourage the BoE to put up interest rates, which will directly strengthen GBP. Otherwise, if economic data is weak, the Pound Sterling is likely to fall.
Another significant data release for the Pound Sterling is the Trade Balance. This indicator measures the difference between what a country earns from its exports and what it spends on imports over a given period.
If a country produces highly sought-after exports, its currency will benefit purely from the extra demand created from foreign buyers seeking to purchase these goods. Therefore, a positive net Trade Balance strengthens a currency and vice versa for a negative balance.
Copper price is under strong bearish pressure to push it to decline below the support at $5.3200, to lose most of its previous gains to reach $4.3900, to face the moving average of 55.
Despite the main stability within the main bullish channel’s levels, the contradiction between the main indicators may increase the chances for suffering extra losses by targeting 161%Fibonacci extension level at $4.2650, while renewing the bullish attempts requires stepping above $4.7400 level, providing chance for recording gains again.
The expected trading range for today is between $4.2600 and $4.5200
Trend forecast: Fluctuated within the bullish track
This week’s USD/JPY price action perfectly validated the top-down approach we discussed during the webinar. Check the video below for reference:
We began our analysis on the 4-hour chart, identifying a key Bullish Fair Value Gap (FVG) around the 147.50–147.60 zone. With the 4-hour timeframe providing the directional bias, we then dropped down to the 15-minute chart to refine our entry.
The plan was straightforward:
What followed was a textbook Smart Money Concepts execution:
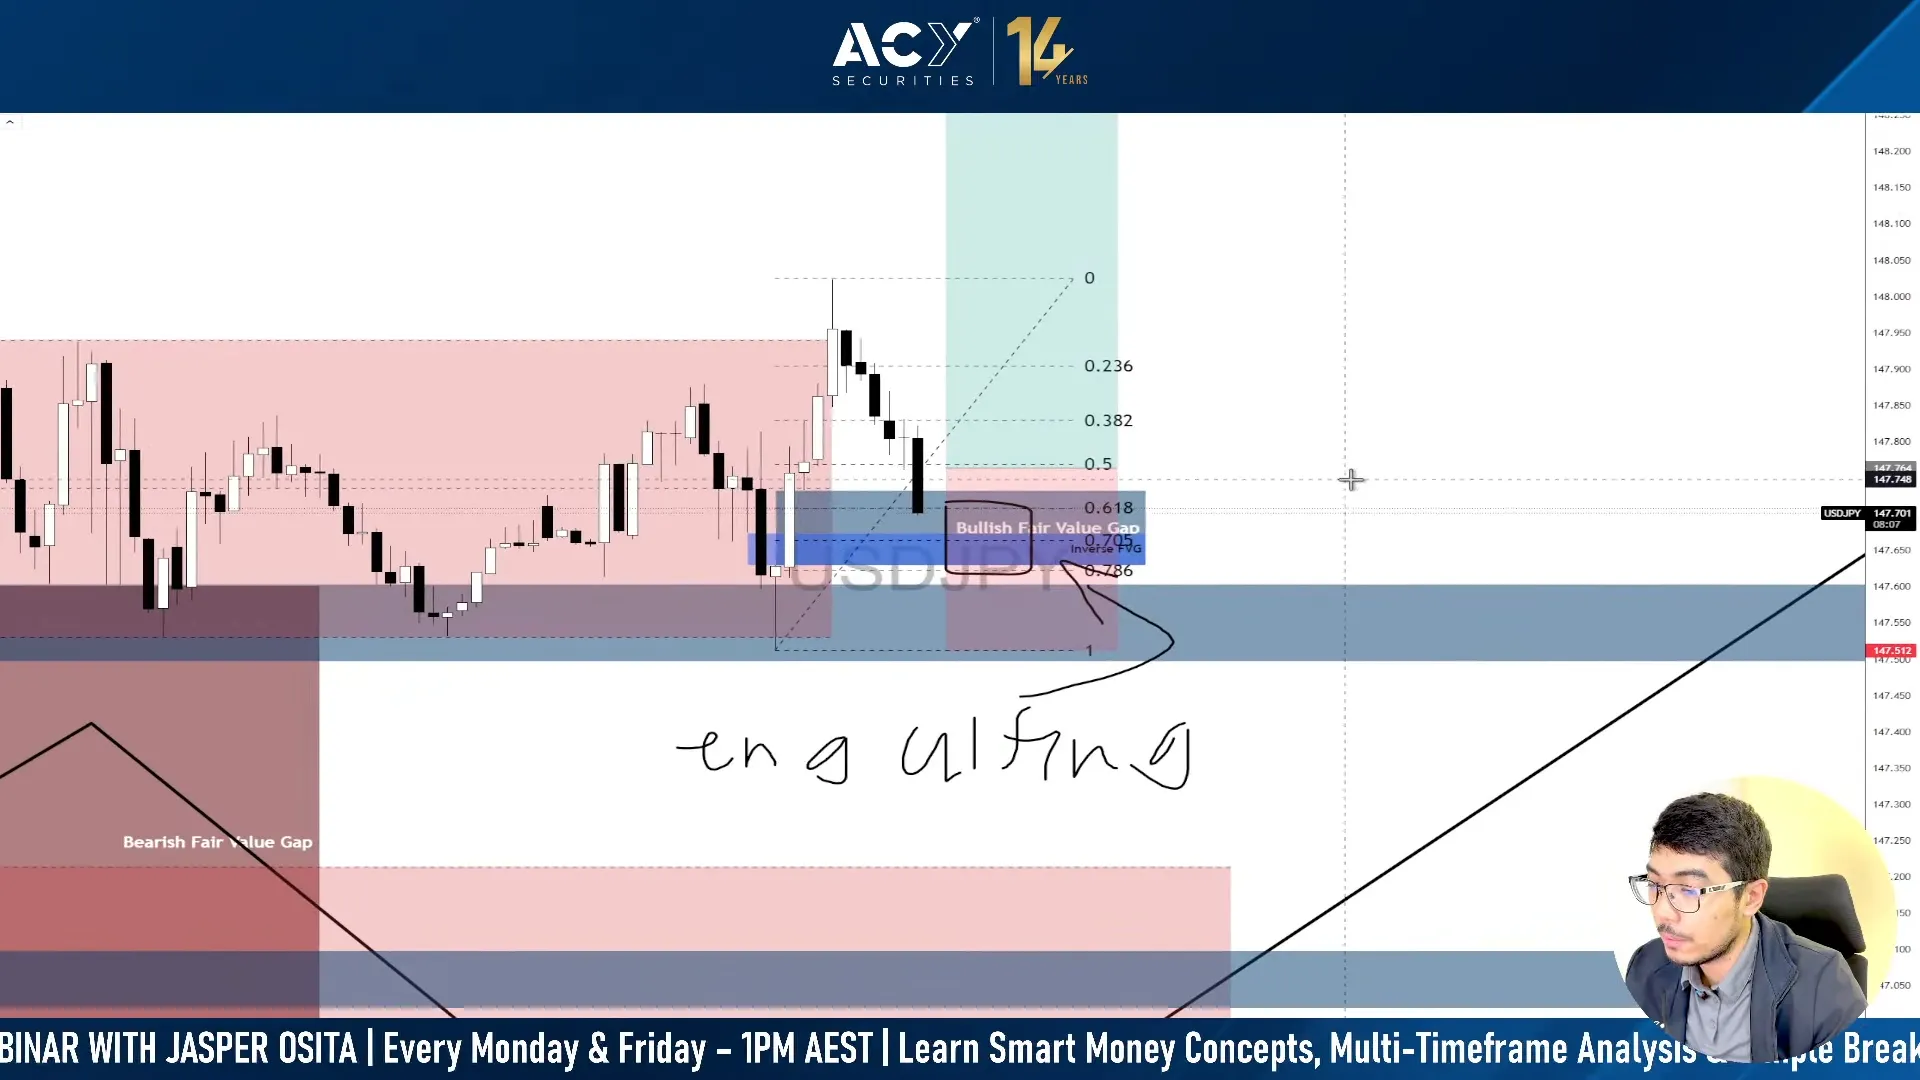
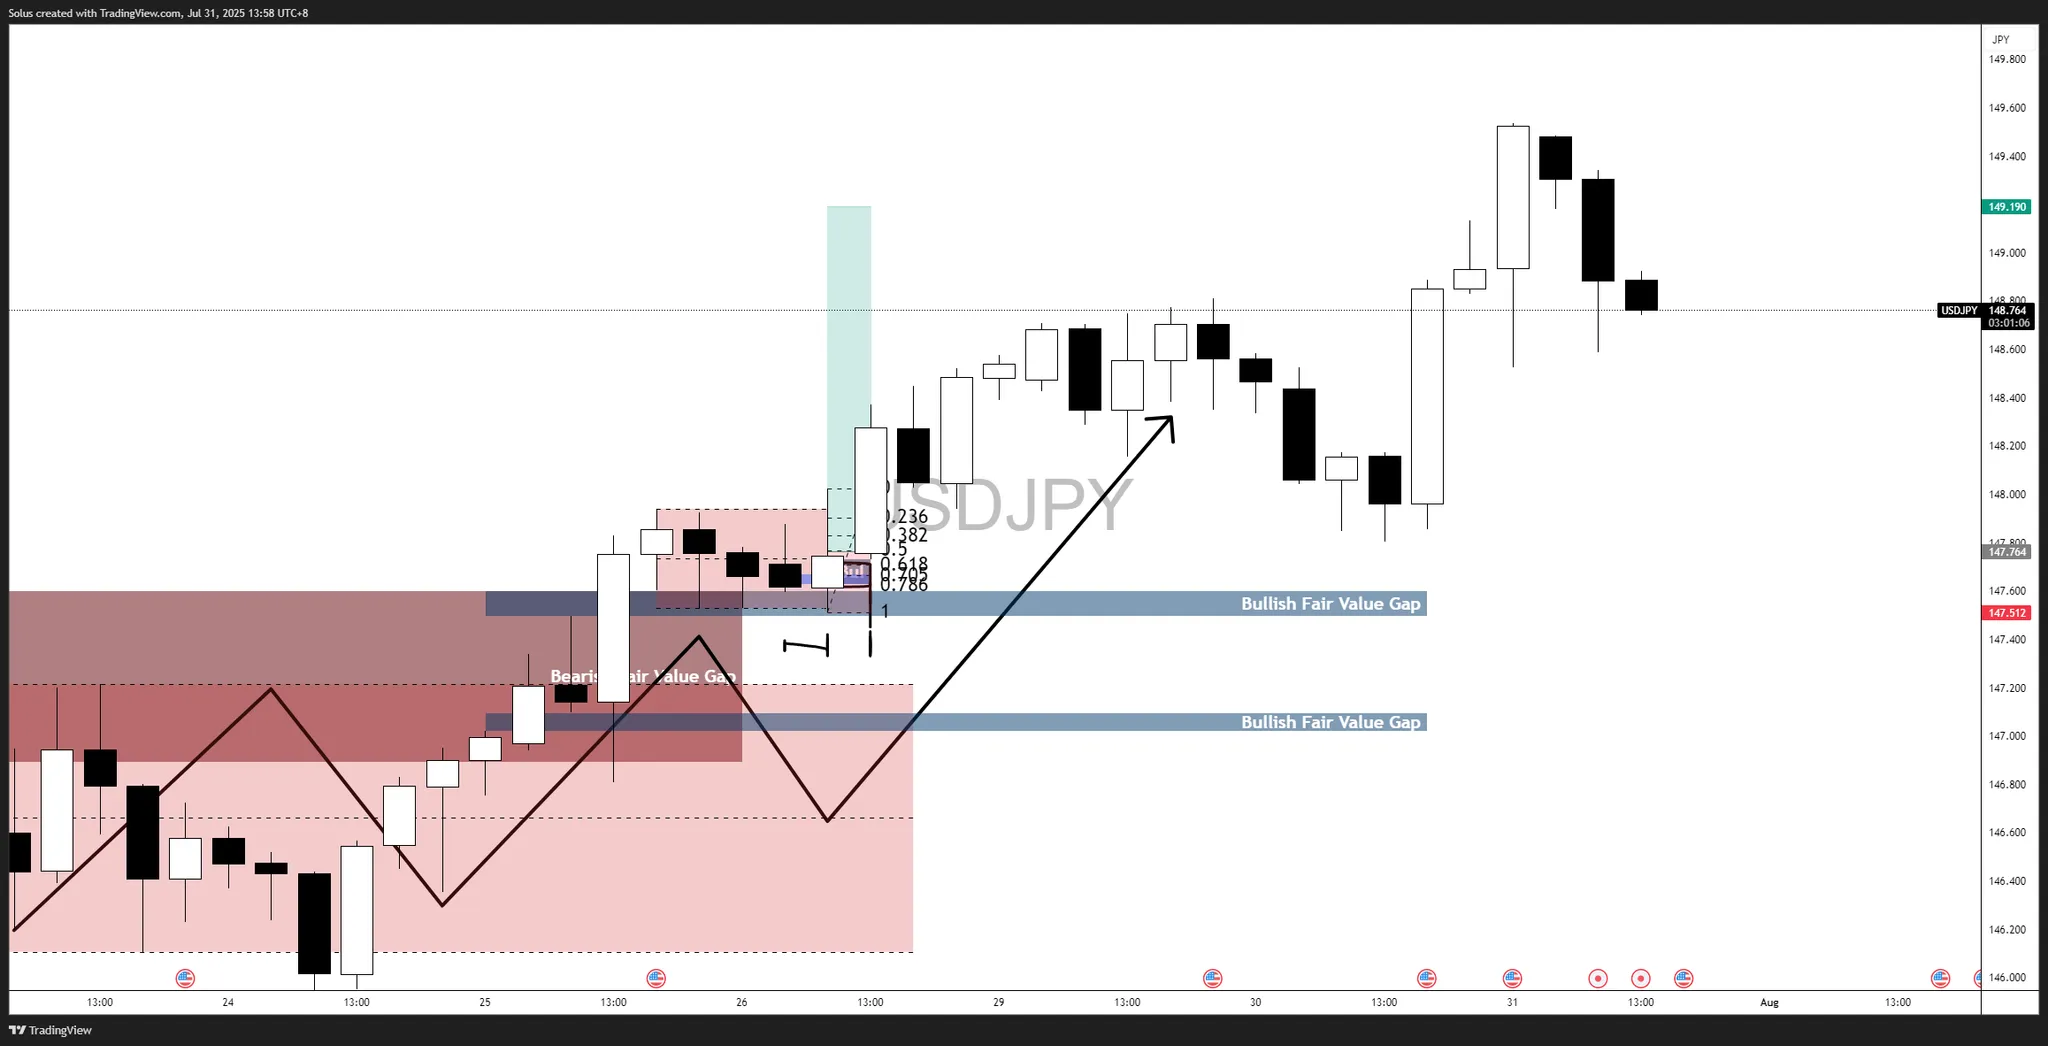
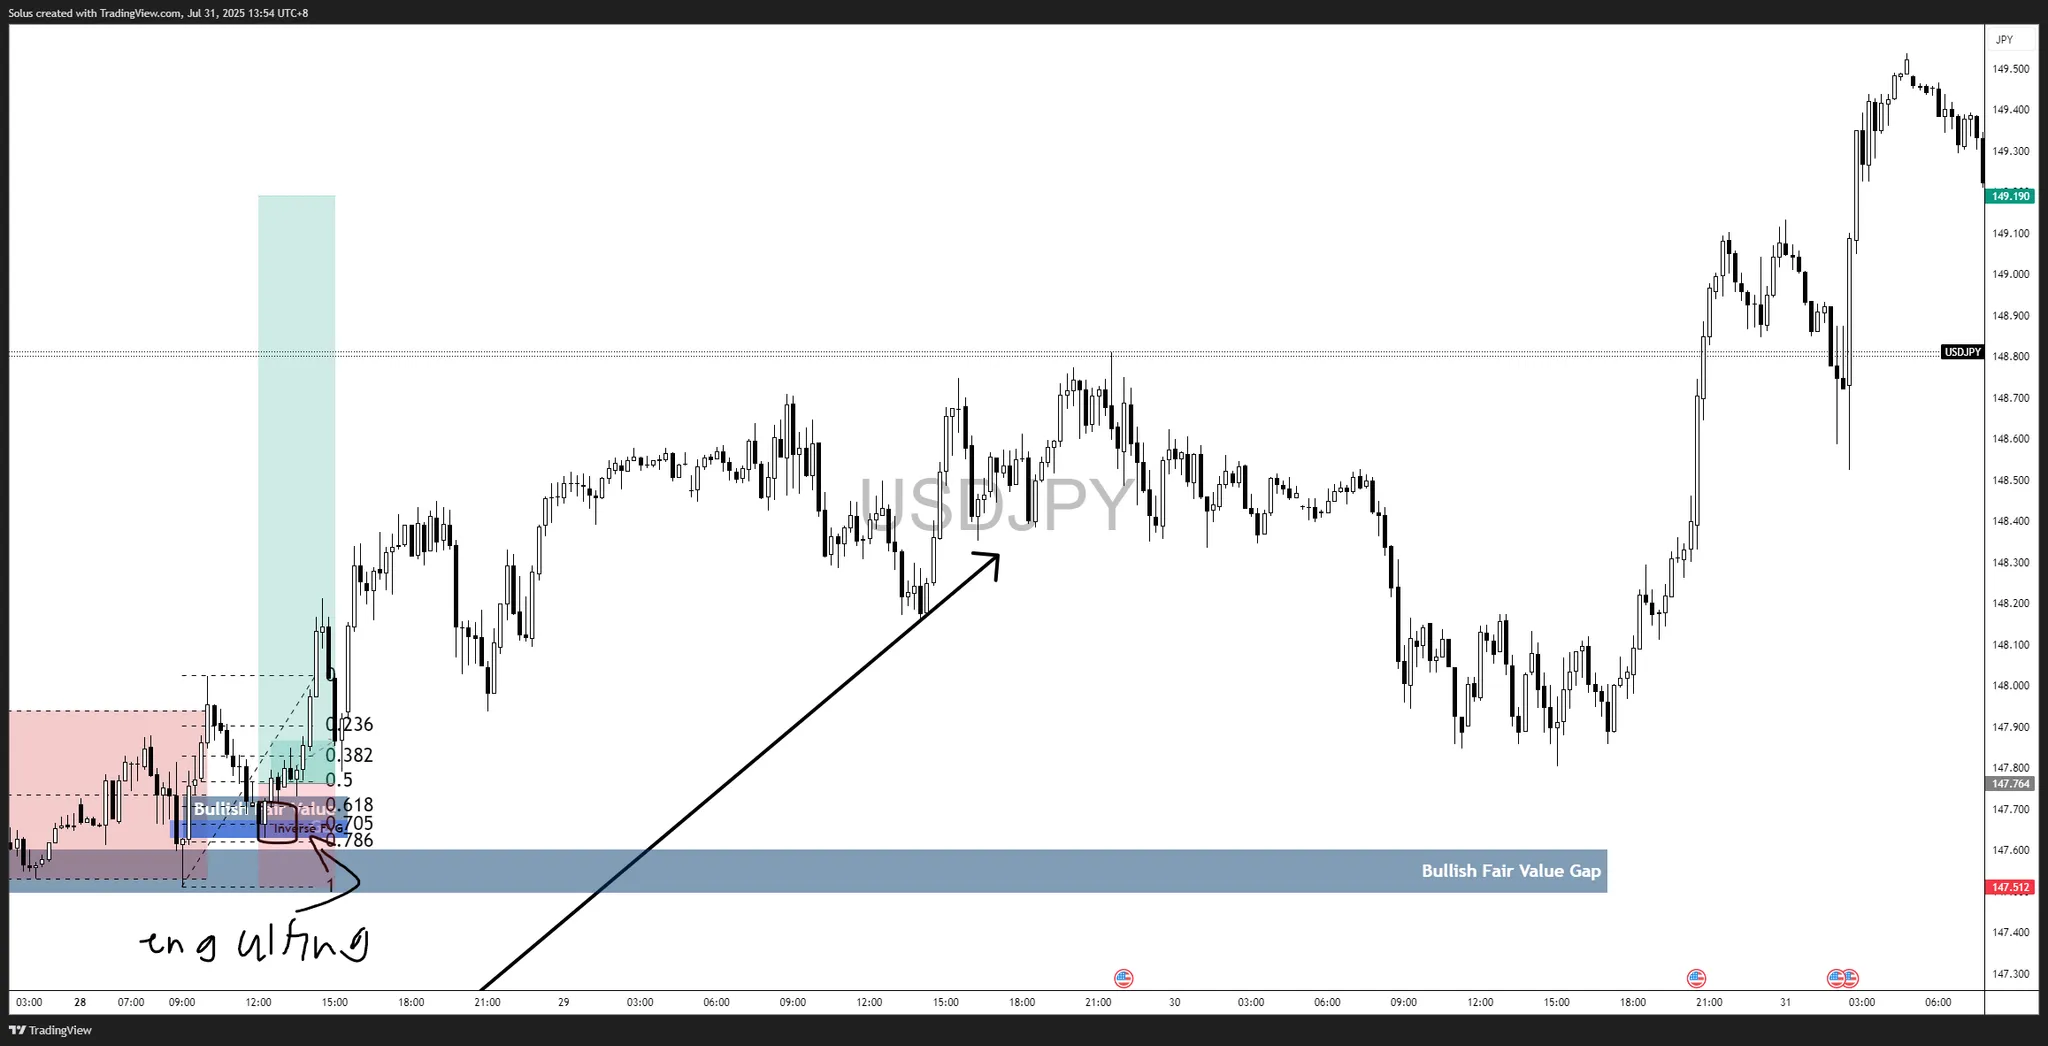
This is the power of starting with a strong anchor timeframe and only dropping lower to fine-tune the entry.
The macro backdrop added conviction to our bullish bias:
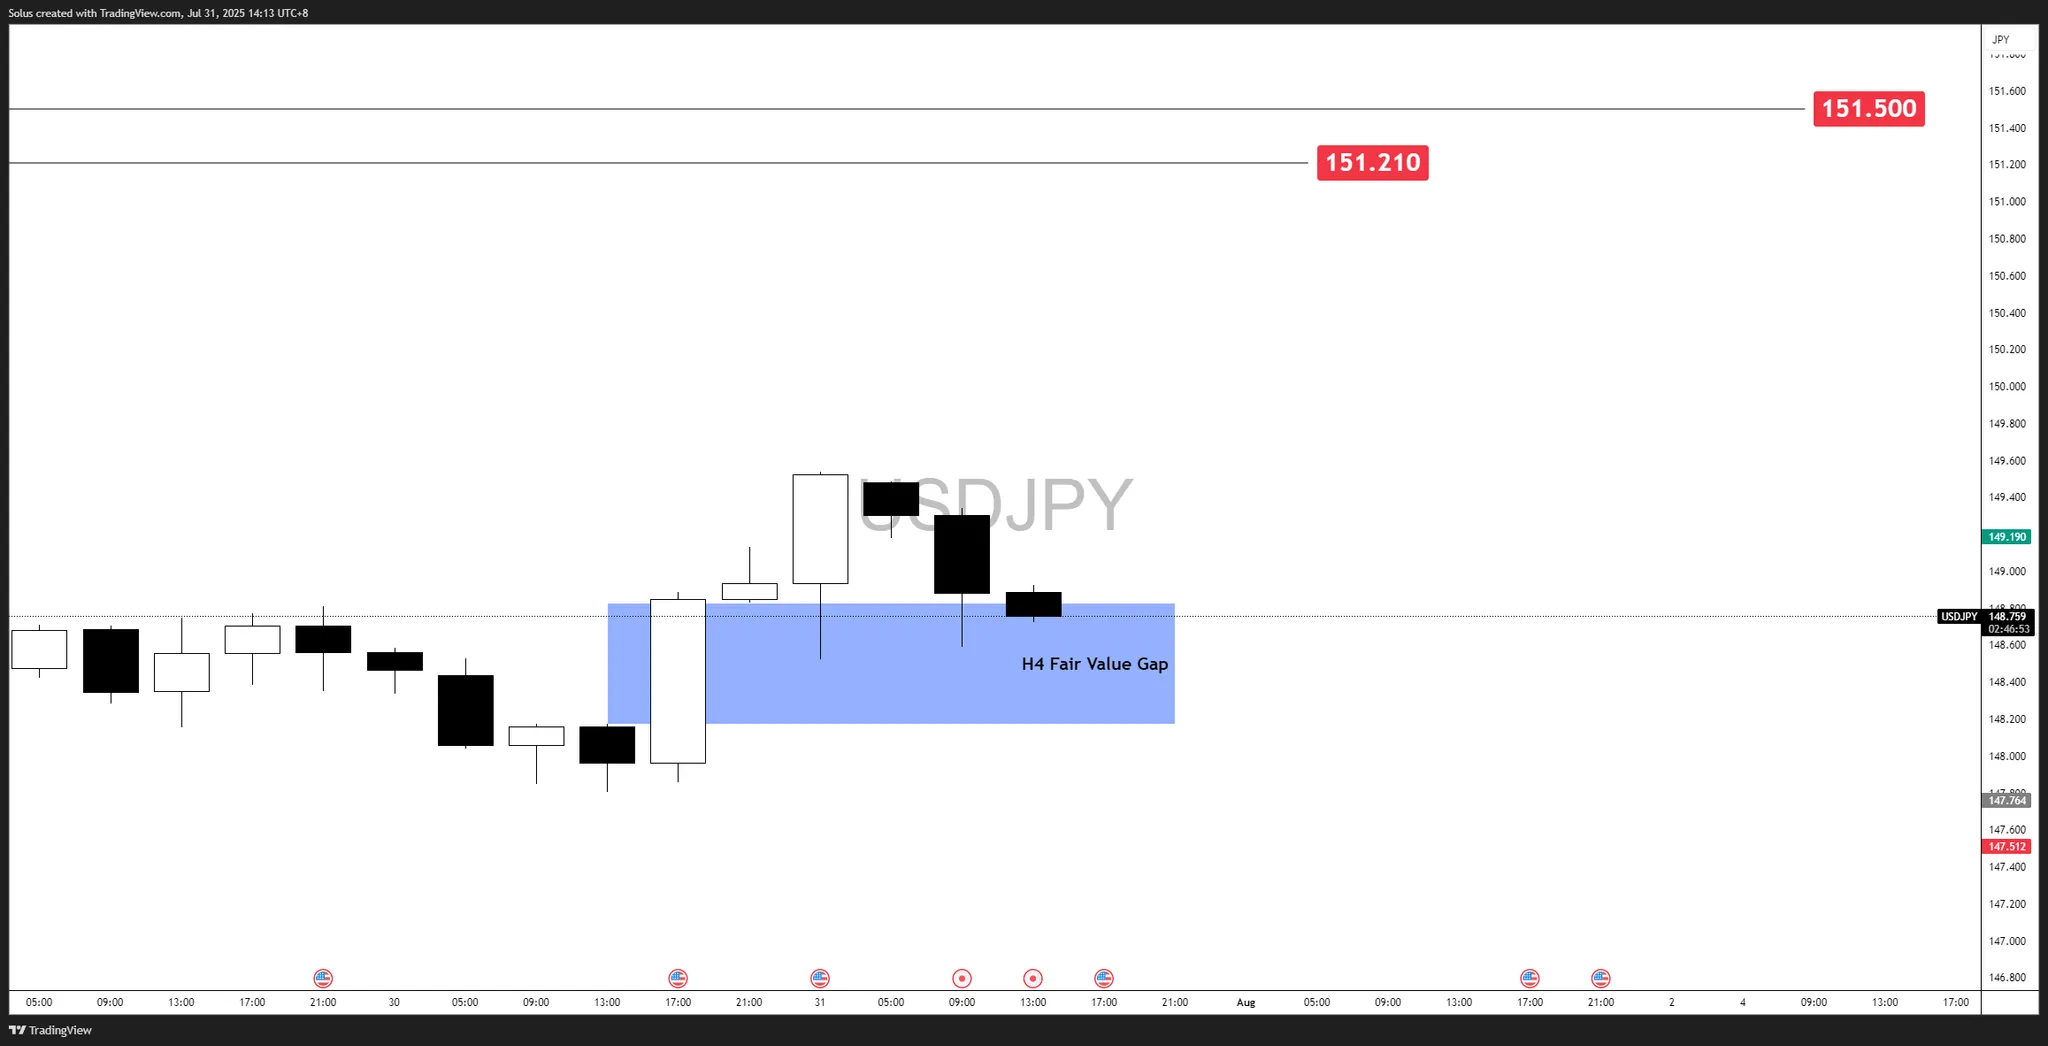
USD/JPY is currently testing the newly created 4-hour Fair Value Gap (FVG) zone at 148.173–148.828, which remains the key support area in the short term. Price has already respected this zone once, and it is now serving as a base for the next potential leg higher.
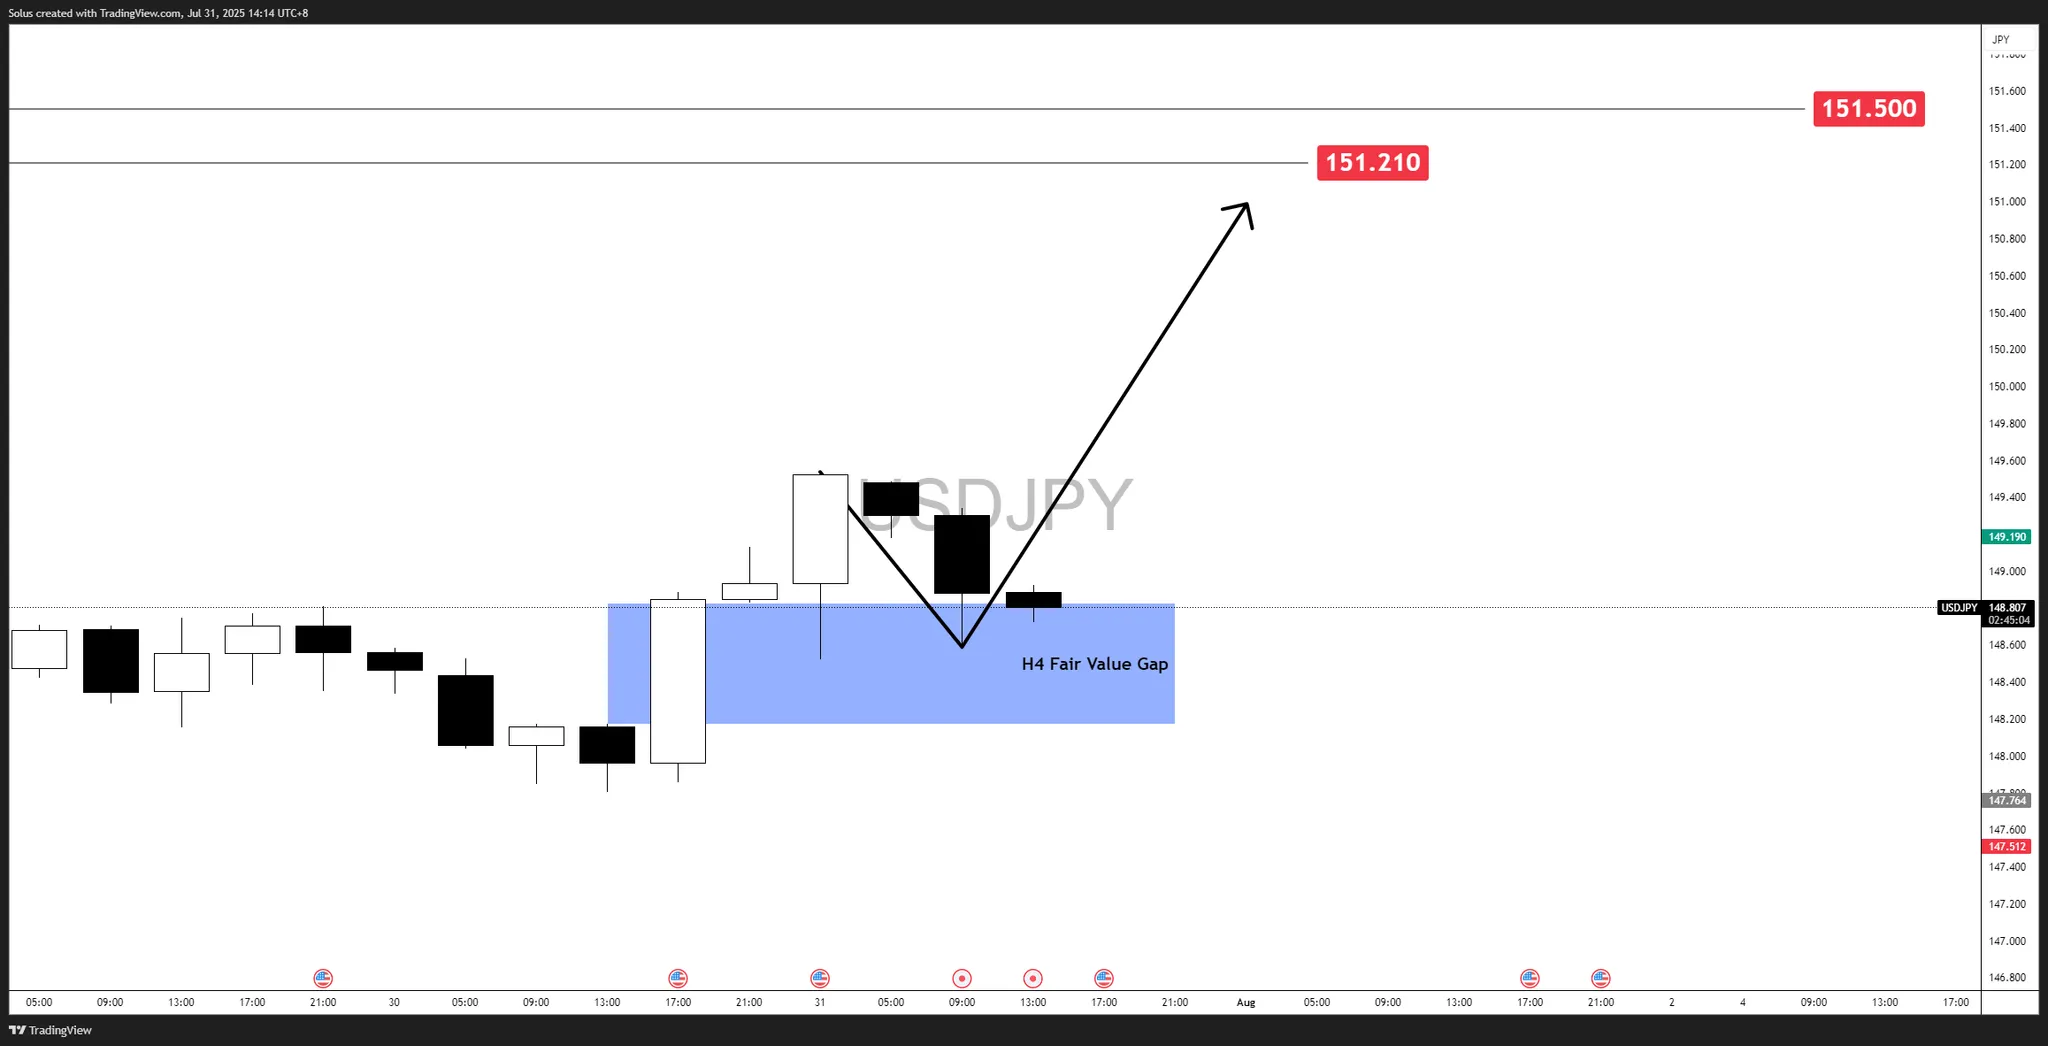
If price holds its ground at the 4-hour Fair Value Gap (FVG) zone at 148.173–148.828, and price uses this area as a launchpad for the next upward leg. This scenario aligns with the existing bullish structure and broader dollar strength.
Targets:
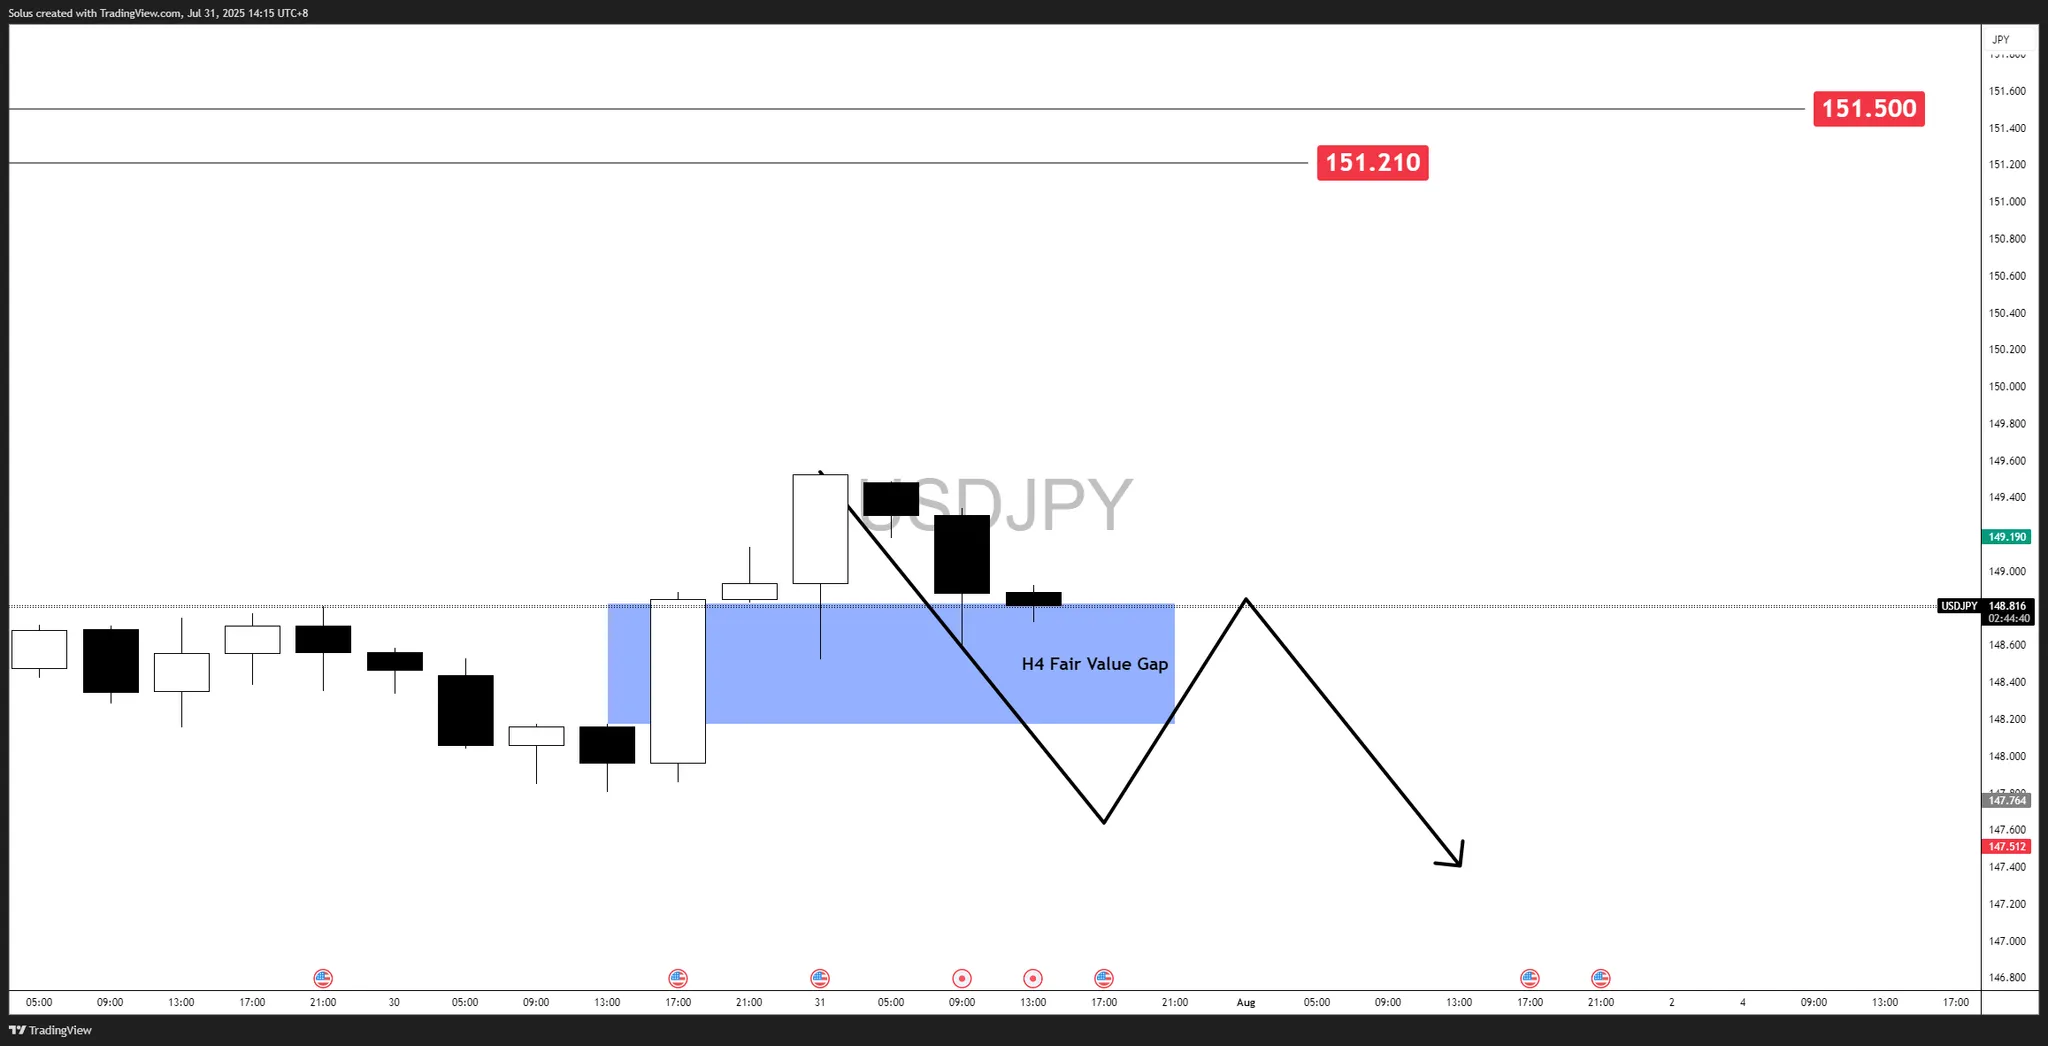
If buyers fail to hold the 4-hour FVG zone, it would signal a potential shift in short-term sentiment. Price breaking below 148.00 could trigger a deeper retracement, erasing the recent bullish momentum.
Targets:
The deciding factor for which scenario plays out on USD/JPY will ultimately come down to the U.S. dollar’s strength or weakness. With the NFP report due tomorrow, another round of volatility is possible, and traders should be prepared for sharp swings as the market reprices expectations.
To stay on the right side of the move, use the same process we followed in the recent setup:
By aligning higher timeframe structure with lower timeframe confirmation, you avoid being caught in the noise and can execute with conviction when the market shows its hand.
The decisive breakdown from a consolidation top puts the near-term bull trend in gold at risk of a deeper correction. Unless there is a relatively quick recovery it looks like gold is heading next towards the higher swing low of $3,247 from late-June. If that fails as support, the higher swing low at $3,121 becomes a potential target.
Since the initial pullback from the April record high of $3,500 completed a 38.2% Fibonacci retracement before another advance began, there is a good chance a deeper retracement may be completed in the current correction, given today’s bearish price action. A 50% retracement will be completed at $3,041 and a 61.8% Fibonacci retracement is at $2,933.
Given the clear failure of the 50-Day MA as support for today, the 200-Day MA, now at $3,000, becomes a potential downside target. Since it is rising it will eventually converge and surpass the 50% retracement area. There is also a falling ABCD pattern that has been added to the chart to help assess potential lower targets. It shows an initial downside target of $3,072, a little below the last retracement low (B) and near the 50% level. That is where the decline in price for the falling CD leg matches the decline in the first AB downswing. Once that happens, a potential pivot level is identified.
For a look at all of today’s economic events, check out our economic calendar.
Natural gas prices provided a new positive close above $3.050 level, forming the neckline of the head and shoulders pattern that appears in the above image, taking advantage of stochastic exit from the oversold level and providing positive momentum again.
The price success to settle above $3.050 will decrease the risk of moving to a new bearish station, providing chances to begin recording some of the gains by its rally to $3.320 and $3.450, while breaking the neckline and holding below it will force it to suffer big losses by reaching $2.710 initially.
The expected trading range for today is between $3.10 and 3.320
Trend forecast: Bullish by the stability of $3.050
In today’s volatile energy landscape, crude oil prices reflect a complex interplay of geopolitical tensions, supply-demand balances, and emerging market trends. The oil market continues to demonstrate remarkable resilience despite significant headwinds, with prices fluctuating based on immediate events and longer-term structural factors. Recent oil price movements insights have shown that market participants remain vigilant about underlying fundamentals.
As of July 3, 2025, WTI crude trades at $67.25 per barrel, down 0.30%, while Brent crude stands at $69.11, up 2.98%. Murban crude has seen an upward movement of 2.56%, reaching $70.23. These divergent price movements across benchmarks highlight the segmented nature of global oil markets.
The notable spread between premium grades like Bonny Light ($78.62) and the OPEC basket ($68.06) demonstrates how quality characteristics and regional factors create persistent price variations that sophisticated traders can leverage. A comprehensive oil price crash analysis provides deeper insight into these dynamics.
Market Insight: “The current price disparity between benchmarks reveals regional supply-demand imbalances rather than fundamental weakness in oil markets,” notes energy analyst James Peterson. “These differentials provide valuable signals about transportation bottlenecks and quality preferences.”
OPEC+ production strategies continue to function as a primary price stabilization mechanism. Recent announcements indicating planned production increases have created downward pressure on crude oil prices today. According to Standard Chartered analysis, “oil markets can easily absorb extra OPEC+ barrels,” suggesting underlying demand strength despite price reactions to supply increases.
The organization’s evolving approach to market management reflects adaptation to new market realities, including U.S. shale resilience and emerging demand uncertainties in key markets. OPEC market influence currently controls approximately 40% of global oil production, giving its decisions substantial market influence.
Middle East conflicts maintain their historical role as price volatility drivers. The ongoing Israel-Iran tensions have injected risk premiums into current prices, though markets have shown increasing sophistication in pricing these risks. An oil tanker explosion off the Libyan coast recently highlighted the vulnerability of critical supply routes.
According to risk analysis firm Stratfor, “The market has developed a more measured response mechanism to geopolitical disruptions, distinguishing between temporary supply interruptions and systemic threats to global oil flows.”
The U.S. oil sector demonstrates conflicting signals. According to the Dallas Federal Reserve’s latest report, oilfield inflation is surging while shale activity contracts in Q2 2025. This unexpected combination suggests cost pressures may be constraining production growth despite favorable prices.
U.S. crude oil production reached a record high in April 2025, yet a recent surprise build in crude inventories ended a five-week draw streak, contributing to downward price pressure. This inventory reversal suggests potential softening in domestic demand or logistics constraints affecting exports.
European markets face unique challenges as Russia’s natural gas supply to the region has declined significantly, potentially increasing oil demand for alternative energy generation. This dynamic creates localized price support for particular crude grades favored by European refiners.
Middle Eastern producers are strategically positioning to capitalize on Asian demand strength, with Saudi Aramco reportedly planning to raise oil prices to Asia. Meanwhile, Libya’s oil sector revival continues, with its first exploration tender in 18 years attracting bids from major international oil companies including ExxonMobil, TotalEnergies, and Eni.
China’s oil import behavior remains a crucial market driver. Despite international sanctions, Chinese refiners continue substantial purchases of Iranian crude, demonstrating Beijing’s strategic approach to energy security and price sensitivity.
India has doubled U.S. oil imports in recent months, reflecting both economic considerations and geopolitical realignment. The country’s energy diversification extends beyond oil, with wind and solar output growth hitting a three-year high according to recent government data.
Current price charts indicate consolidation patterns forming in WTI crude while Brent shows early signs of breakout potential above the $70 resistance level. The technical divergence between benchmarks suggests different regional forces at work rather than a unified global trend.
Trading volumes show steady institutional participation despite recent price volatility, indicating continued market confidence in oil’s medium-term fundamentals. The current relative strength indicators for major benchmarks remain in neutral territory, suggesting neither overbought nor oversold conditions.
The spread between WTI and Brent crude stands at approximately $1.86, reflecting transportation costs, quality differences, and regional supply-demand balances. This differential has narrowed from earlier this year when it reached nearly $3, indicating improving export capabilities from U.S. production centers.
Other notable differentials include the significant premium commanded by Nigerian Bonny Light ($78.62) over the OPEC basket ($68.06), highlighting how sulfur content and density characteristics create persistent price variations across the crude quality spectrum.
Current price levels represent significant moderation from the extreme volatility of recent years. Historical volatility indicators have declined to 25%, compared to peaks of over 100% during previous geopolitical crises. This relative stability provides a more predictable environment for both producers and consumers despite ongoing regional tensions.
Strategic petroleum reserves continue to influence market psychology. India is reportedly exploring new sites to boost its strategic oil reserves, following the pattern of major consuming nations using reserves as both emergency supply buffers and market intervention tools.
The U.S. Strategic Petroleum Reserve (SPR) currently holds approximately 371 million barrels, down from historical averages of over 600 million barrels, creating potential future buying pressure as governments seek to replenish stocks at favorable price points.
Previous strategic reserve releases have demonstrated limited long-term price effects. Analysis of the 2022 coordinated release shows prices typically returned to fundamentally-driven levels within 60-90 days after the initial announcement impact.
Disclaimer: The analysis of strategic reserve effects on oil prices involves assumptions about market psychology and participant behavior that cannot be definitively proven. Different market conditions may produce varying outcomes from similar policy actions.
Energy security concerns are driving more sophisticated approaches to reserve management. Countries are developing nuanced deployment criteria and coordination mechanisms that may provide more effective market stabilization tools compared to previous ad hoc interventions.
Refining margins have tightened according to recent U.S. data, with crack spreads for gasoline declining from $25 per barrel in summer 2024 to approximately $15 currently. This margin compression affects which crude grades refiners prefer, creating differential pricing pressures across the quality spectrum.
The relationship between crude prices and refined product markets remains crucial for understanding overall oil market dynamics, as refiners adjust crude purchasing based on expected product margins and seasonal demand patterns.
Gasoline prices have fallen to $3.14 per gallon nationally ahead of the July 4th holiday, reflecting both seasonal patterns and reduced Middle East risk premiums. Current gasoline futures prices stand at $2.117, down 0.30%, suggesting stable consumer pricing in the near term.
Distillate inventories remain below five-year averages in key consumption regions, providing support for middle distillate cracks and favoring complex refiners capable of maximizing diesel and jet fuel yields.
Northeast Asia’s jet fuel flows to Europe have surged according to recent shipping data, demonstrating how regional refining imbalances create product trade flows that ultimately influence crude demand patterns. These international product movements help balance regional refining capacity utilization and influence which crude grades command premiums in different markets.
The growth of renewable energy continues to influence long-term oil demand projections. India’s wind and solar output growth has hit a three-year high according to recent government data, reflecting accelerating energy transition in emerging economies.
However, the immediate impact on oil prices remains limited as transportation and petrochemical demand continue to support overall consumption growth. The International Energy Agency projects oil demand growth of 1.2 million barrels per day in 2025, despite renewable capacity expansion.
Electric vehicle market developments show mixed signals. Reports indicate major EV manufacturer BYD is cutting production despite strong sales, highlighting supply chain and profitability challenges in the rapidly evolving sector.
The gradual nature of transportation electrification means oil displacement effects remain modest in the short term. Current global EV penetration of approximately 14% of new vehicle sales limits immediate demand destruction effects on oil markets.
Natural gas markets show modest strength with prices at $3.505, up 0.49%, creating limited fuel-switching pressure on oil demand. Shell’s reported boost in natural gas production at Norway’s Ormen Lange field demonstrates continued investment in gas as a transition fuel.
The interplay between natural gas and oil markets remains most relevant in power generation and industrial applications, with price relationships influencing substitution decisions particularly in markets with flexible fuel capabilities.
Market analysts offer divergent views on future price directions. While some highlight OPEC+’s ability to manage supply, others focus on demand concerns in key markets.
Standard Chartered’s recent analysis suggests oil markets can easily absorb additional OPEC+ production, indicating confidence in underlying demand strength. Meanwhile, Goldman Sachs maintains a more cautious outlook, citing potential economic headwinds in major consuming regions.
Seasonal demand patterns suggest potential strengthening in the coming months as summer driving season continues in the Northern Hemisphere. Historical patterns indicate that current price levels may represent seasonal lows before potential strengthening into the third quarter.
Disclaimer: Future oil price projections involve numerous variables and uncertainties. The seasonal patterns discussed represent historical tendencies rather than guaranteed outcomes. Investors should consider multiple scenarios in their planning.
Longer-term price forecasts must balance multiple factors including energy transition timelines, global economic growth projections, and the pace of new oil field development. The ongoing trade war impact on oil markets remains a key variable for any longer-term analysis.
Capital allocation decisions by major producers indicate confidence in sustained demand for at least the next decade, with development focused on lower-cost, lower-carbon intensity production to remain competitive in an evolving energy landscape.
The current structure of oil futures curves provides important information about market expectations. WTI futures show modest backwardation (where near-term contracts trade at a premium to longer-dated ones), indicating market expectations of adequate near-term supply but potential tightening in later periods.
This curve structure influences storage economics and producer hedging strategies, creating feedback loops that affect physical oil pricing. The reduced degree of backwardation compared to earlier periods suggests more balanced market expectations.
Trading volumes in oil futures markets remain robust, with WTI contracts averaging over 1.2 million contracts daily, indicating active price discovery and diverse market participation. The distribution of open interest across different contract months reveals balanced positioning rather than concentration in near-term contracts.
This liquidity profile supports efficient price discovery and reduces vulnerability to technical squeezes or distortions that can occur in less liquid commodity markets.
Recent reports indicate hedge funds reducing positions in energy stocks amid the oil price moderation. This positioning shift can influence price momentum and volatility in both futures markets and related equities.
The current managed money positioning shows net long positions near five-year averages, suggesting neither excessive bullishness nor bearishness among speculative participants. This balanced positioning may reduce the risk of sharp sentiment-driven price movements.
Current price levels create mixed outcomes for oil-producing economies. Reports indicate that oil-rich Alberta forecasts an unexpected budget surplus despite price moderation, demonstrating effective fiscal management and cost discipline.
Meanwhile, Russia’s oil exports are reportedly stagnating as prices moderate and sanctions constrain market access. These divergent outcomes reflect the varying break-even prices and economic structures across producing nations.
Moderate oil prices provide inflation relief for consuming economies, with current gasoline prices representing a significant decline from previous peaks. This moderation helps support consumer spending in other sectors and reduces pressure on central banks to maintain tight monetary policies.
In the U.S., the current average gasoline price of $3.14 per gallon has contributed to easing inflation pressures, with transportation costs moderating after previous significant contributions to consumer price increases.
Current energy prices influence industrial competitiveness across regions, with moderate oil prices supporting manufacturing activity in energy-intensive sectors. Chemical and plastics producers in particular benefit from stable feedstock pricing, supporting production economics and investment decisions.
The relative stability of prices allows for more predictable production costs and investment planning, particularly important for capital-intensive industries with long planning horizons. The oil price stagnation factors have contributed to this planning stability for many industrial consumers.
WTI (West Texas Intermediate) and Brent crude prices differ due to quality characteristics, transportation costs, and regional supply-demand balances. WTI is lighter and sweeter than Brent, requiring less processing to produce high-value products. Additionally, WTI is primarily traded in the U.S. while Brent serves as an international benchmark, creating different market dynamics. Currently, Brent trades at a premium of approximately $1.86 over WTI, reflecting these fundamental differences.
OPEC+ decisions influence global oil prices by adjusting supply to balance markets. When the organization reduces production quotas, available supply decreases, typically supporting higher prices. Conversely, when OPEC+ increases production, as currently planned, additional supply often creates downward price pressure. Market reactions also depend on whether announcements align with expectations and the organization’s compliance with stated targets. OPEC+ currently represents approximately 40% of global oil production, giving it significant market influence.
Daily oil price fluctuations result from multiple factors including inventory reports, geopolitical developments, currency movements, technical trading patterns, and unexpected supply disruptions. Recent examples include the surprise U.S. crude inventory build that pressured prices downward and Middle East tensions that created temporary price spikes. These short-term movements often reflect immediate market sentiment rather than fundamental changes in supply-demand balances.
Crude oil prices today typically account for about 50-60% of retail gasoline prices, with the remainder coming from refining costs, distribution, marketing, and taxes. There’s usually a lag between crude price changes and retail gasoline adjustments, with the relationship sometimes distorted by refining capacity constraints or seasonal fuel specification changes. Currently, U.S. gasoline prices average $3.14 per gallon, reflecting both moderate crude prices and typical seasonal patterns.
The outlook for oil prices through the rest of 2025 depends on several key factors: OPEC+ production discipline, global economic growth trends, the pace of U.S. shale production increases, and geopolitical developments particularly in the Middle East. According to Market Watch data, most analysts project prices to remain within the $65-75 per barrel range for Brent crude, assuming no major supply disruptions or demand shocks. However, significant uncertainty remains, with both upside and downside risks to this baseline scenario.
Disclaimer: This price outlook represents a consensus view based on current market conditions. Actual prices may vary significantly based on unforeseen events or changes in fundamental factors. This information should not be considered investment advice.
Stay ahead of the market with Discovery Alert’s proprietary Discovery IQ model, which provides instant notifications of significant ASX mineral discoveries and transforms complex data into actionable insights. Explore why major mineral discoveries lead to substantial returns by visiting our dedicated discoveries page and begin your 30-day free trial today.
The Pound-to-Euro exchange rate (GBP/EUR) has maintained highs at around 1.156 on Wednesday, after the single currency lost further ground in global markets, which has helped underpin the Pound.
The Euro attempted to stabilise during the European trading with GBP/EUR trading around 1.1535.
According to SocGen: “If a short-term pullback develops, the lower limit of an ascending channel near 0.8660/0.8645 could be an important support zone.
This would imply GBP/EUR resistance in the 1.1550 – 1.1570 zone.
ING considers that there has been substantial position adjustment; “it could be seen as the UK having a better deal than the EU when it comes to trade. In reality, however, it was probably all to do with positioning, where opposing fiscal and monetary prospects between the eurozone and the UK had made long EUR/GBP one of the conviction trades this summer.”
Although there was immediate relief that the EU secured a trade deal with the US and avoided a trade war, there have also been notable concerns that the EU will be negatively impacted by the arrangement.
National Australia Bank head of FX research Ray Attrill commented; “It hasn’t taken long for markets to conclude that this relatively good news is still, in absolute terms, bad news as far as the near-term implications for euro zone growth are concerned.”
![]()
He added; “The deal has been roundly condemned by France while others – including German Chancellor Merz – are playing up the negative consequences for exporters, and with that, economic growth.”
According to Clemens Fuest, president of the IFO economic research institute; ‘The trade deal is a humiliation for the EU, but it reflects the imbalance of power.”
He added; “The Europeans need to wake up, focus more on economic strength and reduce their military and technological dependence on the US.”
Rabobank noted a newswire report; “According to Bloomberg, Wolfgang Niedermark of the BDI industry federation has wailed that “the EU is accepting painful tariffs. Even a 15% tariff will have immense negative consequences for Germany’s export-oriented industry.”
The bank added; “Prior to Trump’s inauguration, economists were talking about “worst case scenarios” that included horrific outcomes like a 5% universal tariff, and 15% on Chinese goods. After witnessing 145% tariffs on China and Liberation Day “reciprocal tariffs,” it’s easy to shrug off the current developments. But the actual tariff levels still matter.”
There is, therefore, a risk of wider complacency over the impacts on the US and global economy.
Domestically, mortgage approvals increased to 64,200 for June from a revised 63,300 the previous month and above consensus forecasts of 63,000.
![]()
Approvals for re-mortgaging increased to the highest level since October 2022.
There was also a surge in net lending to £6.76bn for June from £2.90bn the previous month with a stronger increase in consumer credit growth.
The British Retail Consortium (BRC) reported that shop prices increased 0.7% in the year to July from 0.4% previously.
Food prices increased 4.0% from 3.4% previously.
Mike Watkins, Head of Retailer and Business Insight, NIQ, commented; “Consumers’ household budgets are coming under pressure with the food retailers now seeing price increases above CPI.”
The data should not encourage a faster rate of interest rate cuts by the Bank of England.
International Money Transfer? Ask our resident FX expert a money transfer question or try John’s new, free, no-obligation personal service! ,where he helps every step of the way,
ensuring you get the best exchange rates on your currency requirements.


 Price Forecast: Consolidation Breakdown, Correction May Deepen")


