The main category of Forex News.
You can use the search box below to find what you need.
[wd_asp id=1]
The main category of Forex News.
You can use the search box below to find what you need.
[wd_asp id=1]
The GBP/USD pair attracts some buyers for the second straight day, though it lacks follow-through and remains capped near mid-1.3500s through the early European session on Friday. Spot prices, for now, seem to have stalled the recovery from a nearly three-week low, touched on Wednesday, as traders keenly await the release of the US Nonfarm Payrolls (NFP).
The closely watched US monthly employment details will be looked upon for more cues about the US Federal Reserve’s (Fed) future policy path, which, in turn, will drive the US Dollar (USD) and provide a fresh impetus to the GBP/USD pair. Heading into the key data risk, some repositioning trade helps the Greenback recover part of the previous day’s heavy losses to over a one-week low and acts as a headwind for the currency pair.
Apart from this, persistent geopolitical uncertainties amid renewed US-Iran hostilities and clashes over the Strait of Hormuz turn out to be another factor underpinning the safe-haven USD. However, reduced bets for a September Fed rate hike, along with soft US bond yields, hold back USD bulls from placing aggressive bets and might act as a tailwind for the GBP/USD pair, warranting caution before positioning for any meaningful downside.
From a technical perspective, the GBP/USD pair maintains a mild bullish bias above the 200-period Simple Moving Average (SMA) on the 4-hour chart and the 38.2% Fibonacci retracement of the July-August rally. Moreover, momentum indicators are constructive, with the Relative Strength Index hovering just above the neutral 50 level and the Moving Average Convergence Divergence (MACD) line sitting above the signal line in positive territory.
This hints that the upside pressure is gradually building as the 38.2% Fibo. at 1.3525 turns into nearby support. This is followed by the 200-period SMA around 1.3490 and the 50.0% retracement near 1.3476, with deeper cushions at the 61.8% and 78.6% levels at 1.3428 and 1.3359, respectively. On the topside, immediate resistance emerges at the 23.6% Fibo. at 1.3584, ahead of a more significant hurdle at the prior swing high region around 1.3681.
(The technical analysis of this story was written with the help of an AI tool. Know more.)
Nonfarm Payrolls (NFP) are part of the US Bureau of Labor Statistics monthly jobs report. The Nonfarm Payrolls component specifically measures the change in the number of people employed in the US during the previous month, excluding the farming industry.
The Nonfarm Payrolls figure can influence the decisions of the Federal Reserve by providing a measure of how successfully the Fed is meeting its mandate of fostering full employment and 2% inflation.
A relatively high NFP figure means more people are in employment, earning more money and therefore probably spending more. A relatively low Nonfarm Payrolls’ result, on the either hand, could mean people are struggling to find work.
The Fed will typically raise interest rates to combat high inflation triggered by low unemployment, and lower them to stimulate a stagnant labor market.
Nonfarm Payrolls generally have a positive correlation with the US Dollar. This means when payrolls’ figures come out higher-than-expected the USD tends to rally and vice versa when they are lower.
NFPs influence the US Dollar by virtue of their impact on inflation, monetary policy expectations and interest rates. A higher NFP usually means the Federal Reserve will be more tight in its monetary policy, supporting the USD.
Nonfarm Payrolls are generally negatively-correlated with the price of Gold. This means a higher-than-expected payrolls’ figure will have a depressing effect on the Gold price and vice versa.
Higher NFP generally has a positive effect on the value of the USD, and like most major commodities Gold is priced in US Dollars. If the USD gains in value, therefore, it requires less Dollars to buy an ounce of Gold.
Also, higher interest rates (typically helped higher NFPs) also lessen the attractiveness of Gold as an investment compared to staying in cash, where the money will at least earn interest.
Nonfarm Payrolls is only one component within a bigger jobs report and it can be overshadowed by the other components.
At times, when NFP come out higher-than-forecast, but the Average Weekly Earnings is lower than expected, the market has ignored the potentially inflationary effect of the headline result and interpreted the fall in earnings as deflationary.
The Participation Rate and the Average Weekly Hours components can also influence the market reaction, but only in seldom events like the “Great Resignation” or the Global Financial Crisis.
Domestic coffee prices today
Coffee prices today in the domestic market simultaneously increased by 1,000 VND/kg compared to the previous session. According to giacaphe. com, coffee prices on September 5th averaged 94,800 VND/kg.
In Gia Lai and Dak Lak, coffee prices were recorded at 94,700 VND/kg, an increase of 1,000 VND/kg.
In Lam Dong, coffee prices are still 94,200 VND/kg.
The old Dak Nong area recorded a level of 95,000 VND/kg, reversing to increase by 1,000 VND/kg. This is the highest level in today’s price list.
The USD/VND exchange rate according to Vietcombank was recorded at 25,845 VND/USD, down 30 VND/USD.
World coffee prices
In the world market, coffee prices increase and decrease interspersed.
According to Barchart, the September 2026 Robusta futures contract remained unchanged, anchored at the $3,298/ton mark. The November 2026 futures increased by $56/ton, listed at $3,430/ton. The term from January 2027 to May 2027 saw an increase of $55-57/ton, to $3,383 – $3,415/ton.
Similarly, the September 2026 Arabica futures contract closed the session at 324.35 cents/lb. The December 2026 term increased slightly by 0.25 US cents/lb, equivalent to 0.08%, raising the cost price to 295.60 cents/lb. Further forwards increased from 2.35 to 3.40 cents/lb, anchored in the 287.4 – 283.4 cents/lb range.
Assessments and forecasts
Arabica prices on the ICE exchange have fallen to a 5-week low, while Robusta fell to a 2.5-month low. This development reflects market concerns about the possibility of increased coffee supply to the market in the near future.
For Arabica, Brazil is a noteworthy factor as new crop yield prospects are improved. StoneX raises its 2026-2027 crop yield forecast to a record 77.2 million bags, 2.6% higher than the forecast made in March. The return of rainfall at the time coffee trees enter the flowering stage also creates more grounds for expectations of a favorable crop.
For the domestic market, in the short term, domestic coffee prices are likely to recover after a deep decline, however, the increase is not too sudden, continuing to accumulate around the area of 94,000 – 95,000 VND/kg.
The market is expected to maintain a probing state and can only clearly define the new trend when the first assessments of Vietnam’s actual harvest output next season begin to appear.
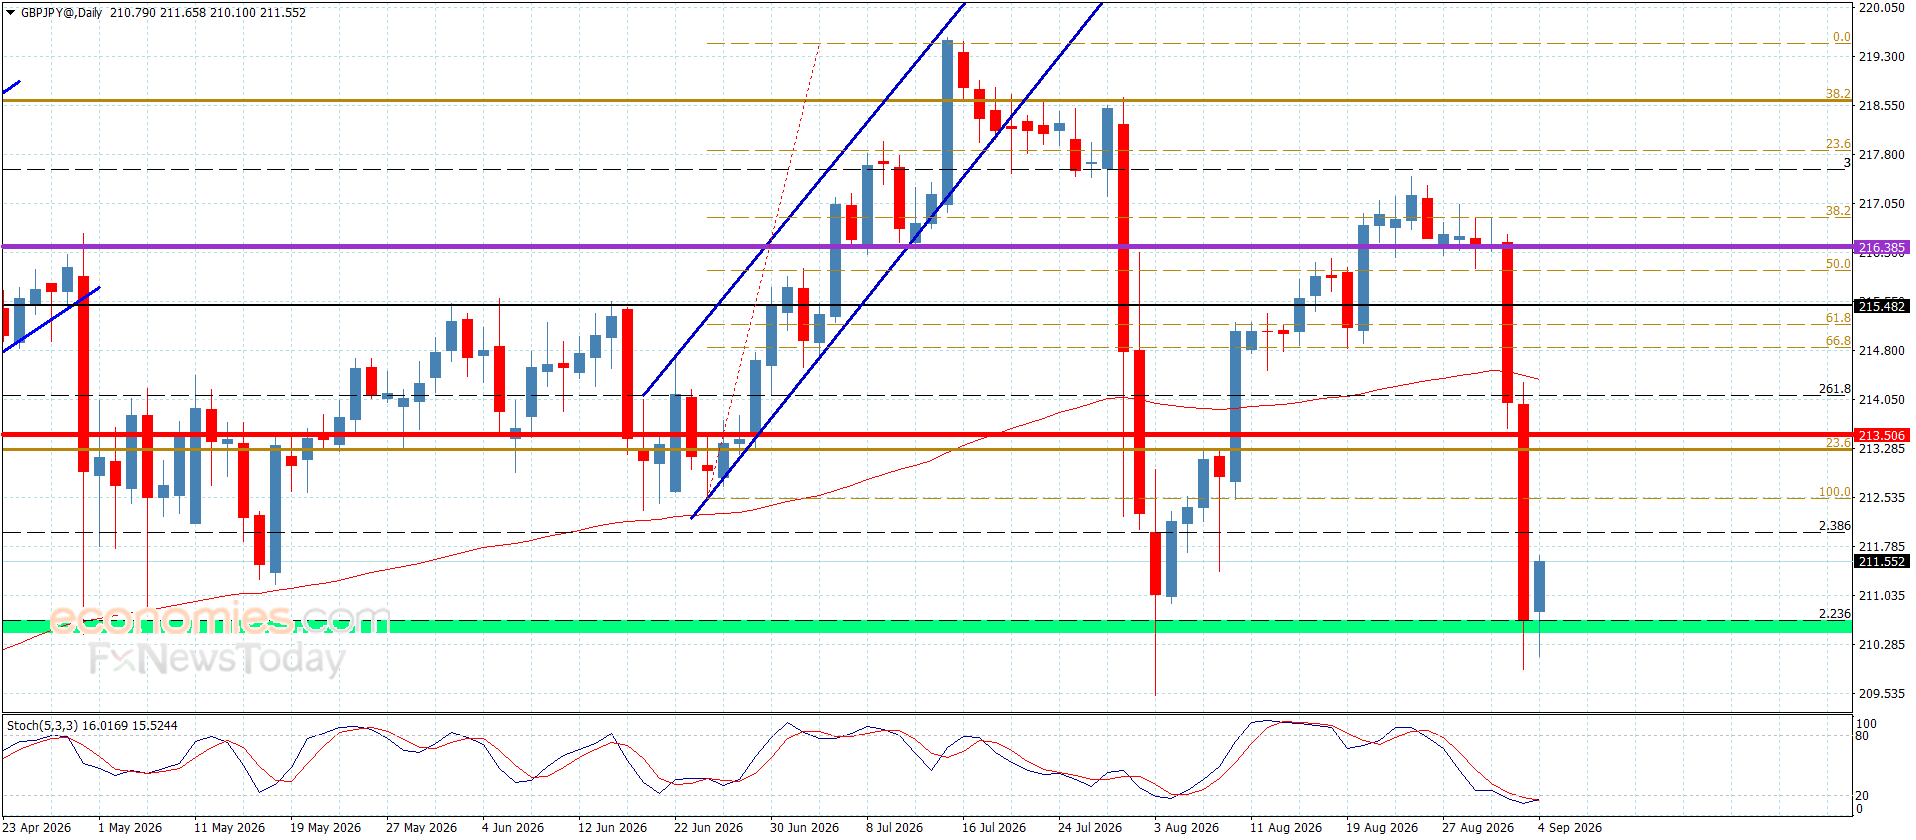
The GBPJPY pair ended the last bearish scenario by recording the previously suggested targets, reaching 209.95 level to rebound quickly to settle above 210.40 level, to activate the attempts of recovering the losses in the near and medium period.
The stability above the current support will help it to form several bullish waves, to expect targeting 212.40 and 213.25 level, while the price return to settle below the support level and providing a daily close below it will confirm its readiness to form strong bearish waves, to reach 209.10 initially, reaching the next support near 208.25.
The expected trading range for today is between 210.70 and 212.40
Trend forecast: Bullish
The article covers the following subjects:
Consider long positions from corrections above 4,282.50 with a target of 4,900.00–5,610.00.
Breakout and consolidation below 4,282.50 will allow the asset to continue declining to the levels of 4,003.25–3,720.00.
An ascending third wave of larger degree (3) is presumably developing on the weekly chart. Within it, a descending correction has been completed as the fourth wave of smaller degree 4 of (3). Apparently, the fifth wave 5 of (3) started developing on the daily chart, with wave i of 5 forming as its part. The H4 time frame shows that wave (iii) of i of 5 has formed, a local correction has been completed as wave (iv) of i, and wave (v) of i is currently developing. If the presumption is correct, XAU/USD will continue to rise to 4,900.00–5,610.00. The level of 4,282.50 is critical in this scenario as a breakout below it will enable the asset to continue declining to the levels of 4,003.25–3,720.00.
This forecast is based on the Elliott Wave Theory. When developing trading strategies, it is essential to consider fundamental factors, as the market situation can change at any time.
The content of this article reflects the author’s opinion and does not necessarily reflect the official position of LiteFinance broker. The material published on this page is provided for informational purposes only and should not be considered as the provision of investment advice for the purposes of Directive 2014/65/EU.
According to copyright law, this article is considered intellectual property, which includes a prohibition on copying and distributing it without consent.
The article covers the following subjects:
Consider long positions from corrections above 1.3470 with a target of 1.3870–1.4140.
Breakout and consolidation below 1.3470 will allow the pair to continue declining to the levels of 1.3275–1.3140.
On the weekly time frame, an ascending wave of larger degree (A) of B is developing. Within it, wave 1 of (A) has formed, a downward correction has been completed as wave 2 of (A), and wave 3 of (А) is unfolding. Apparently, the third wave iii of 3 is developing on the daily time frame, within which a local correction has formed as wave (ii) of iii. Wave (iii) of iii is developing on the H4 chart, with wave iii of (iii) unfolding as its part. If the presumption is correct, GBP/USD will continue to rise to 1.3870–1.4140. The level of 1.3470 is critical in this scenario as a breakout below it will enable the pair to continue declining to the levels of 1.3275–1.3140.
This forecast is based on the Elliott Wave Theory. When developing trading strategies, it is essential to consider fundamental factors, as the market situation can change at any time.
The content of this article reflects the author’s opinion and does not necessarily reflect the official position of LiteFinance broker. The material published on this page is provided for informational purposes only and should not be considered as the provision of investment advice for the purposes of Directive 2014/65/EU.
According to copyright law, this article is considered intellectual property, which includes a prohibition on copying and distributing it without consent.
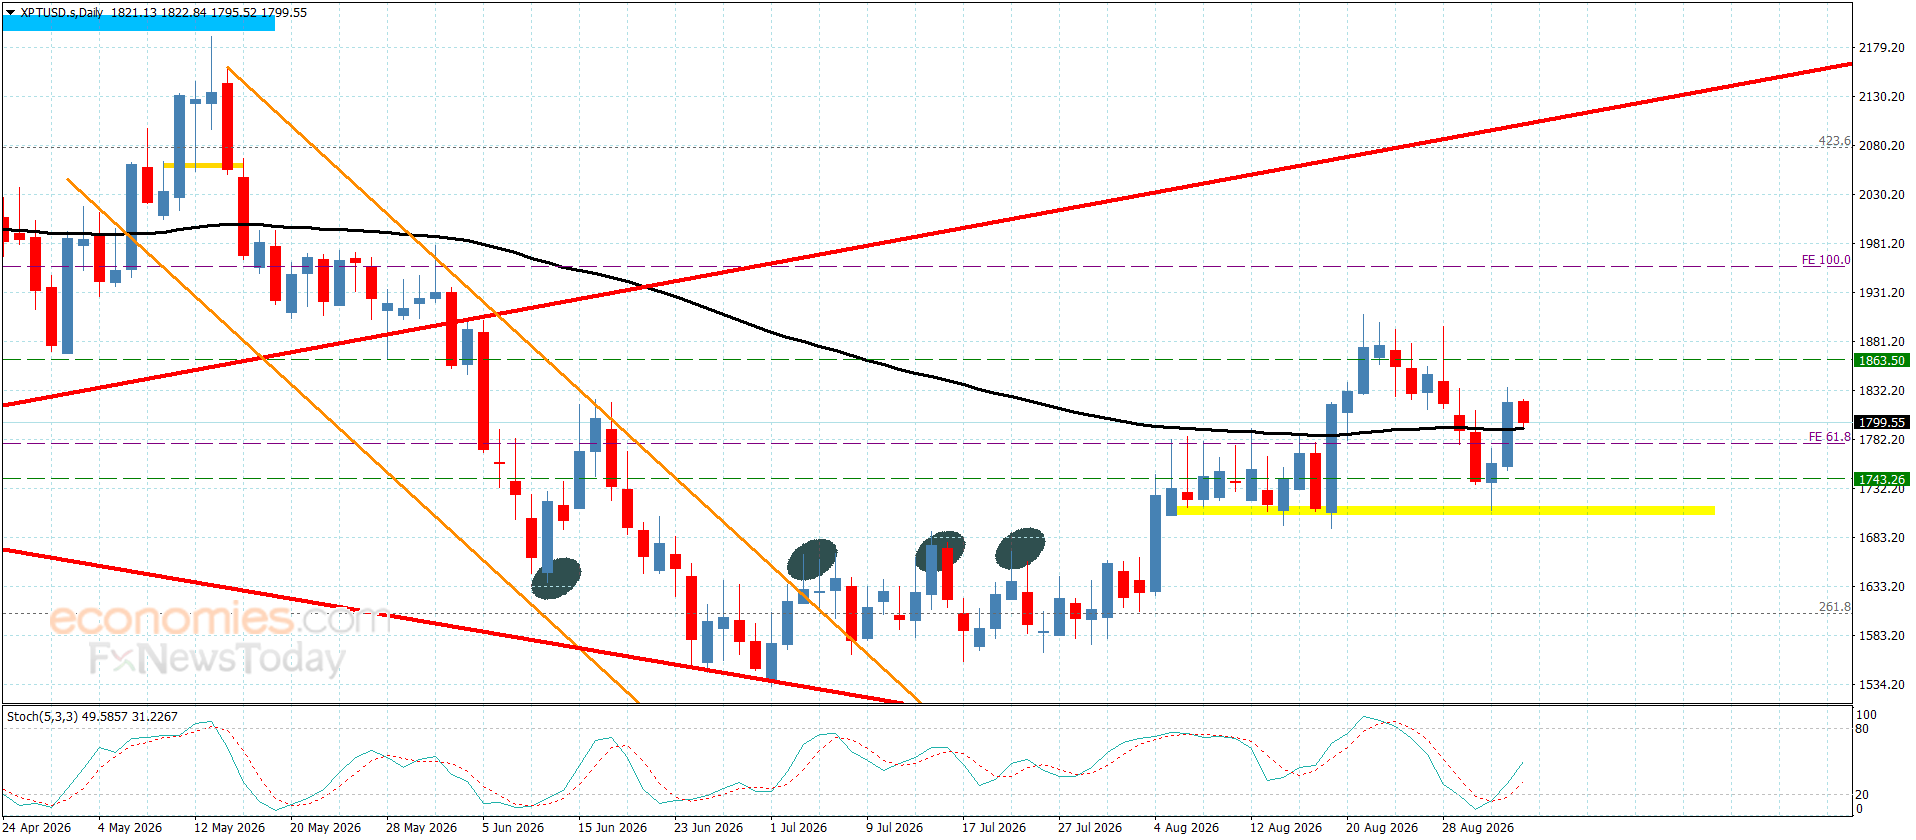
Platinum price kept its stability above $1695.00 support in its last trading, confirming the stability of the bullish scenario, recording clear gains by approaching the initial target at $1860.00.
The attempt of the price to settle above the 55 moving average level reinforces the chances of gathering the positive momentum, to expect surpassing $1860.00 level and reaching the extra stations near $1910.00 and $1955.00.
The expected trading range for today is between $1785.00 and $1900.00
Trend forecast: Bullish
The dollar-yen is suddenly a lot more interesting to me. This is a major swing low that we find ourselves testing again. It was interesting that the initial reaction was to go to the upside. Makes sense: interest rate spike. I think there’s a real chance of a bounce here, but having said that, there’s a lot of fear out there about the Bank of Japan. I think longer term, the Bank of Japan has very limited options, but it is an interesting turnaround.
So, I’ll be watching this today to see how it plays out. We can see that it is getting pretty aggressive. I think somebody’s trying to keep this from popping higher based on the action that I see right now. That being said, if we take out the top of this candlestick, that’d be pretty bullish.
Silver price (XAG/USD) retreats to near $66.30 in the European trading session on Friday after posting a fresh five-day high near $68.00. The white metal comes under pressure ahead of the United States (US) Nonfarm Payrolls (NFP) data for August, which will be published at 12:30 GMT.
According to TD Securities, the US labour market is set for a partial recovery in August, with the bank forecasting that “August NFP [will] rebound to 95k after July posted a decline of 23k.” The firm also expects limited movement in joblessness, noting that “the UE rate likely went sideways at 4.1% with balanced risks.”
Investors will closely track the US NFP data to get fresh cues regarding the Federal Reserve’s (Fed) monetary policy outlook. In TD’s view, a modestly hawkish employment report will reaffirm the Fed’s attention on inflation, but it will be by itself unlikely to push the Committee towards hikes, suggesting that even a stronger print would not materially alter the current policy stance.
Meanwhile, traders have diminished Fed interest rate expectations after comments from Governor Christopher Waller on Thursday, in which he said that recent data shows signs of disinflation.
Analysts at Commerzbank also said that lingering uncertainty over the US rate outlook was “underscored yesterday by comments from Fed Governor Christopher Waller,” who, in their words, signalled that “a rate hike is by no means necessary.” They add that Waller “also confirmed what we have been arguing: next week’s inflation data are likely to be the key input for the Fed’s upcoming policy decision,” a shift in emphasis that, in their view, “further [reduces] the significance of today’s employment report.”
In the daily chart, XAG/USD trades at $66.73, maintaining a bullish near-term bias as it holds above the 20-day exponential moving average (EMA) at roughly $65.71. The metal is advancing within an uptrend structure, with price comfortably supported by this short-term EMA, while the Relative Strength Index (RSI) around 55 suggests moderate bullish momentum without yet signaling overbought conditions.
On the downside, immediate support is seen at the 20-day EMA near $65.71, where a break would expose the white metal to a deeper correction. Looking up, the August high at $71.12 is the key hurdle.
(The technical analysis of this story was written with the help of an AI tool. Know more.)
Silver is a precious metal highly traded among investors. It has been historically used as a store of value and a medium of exchange. Although less popular than Gold, traders may turn to Silver to diversify their investment portfolio, for its intrinsic value or as a potential hedge during high-inflation periods. Investors can buy physical Silver, in coins or in bars, or trade it through vehicles such as Exchange Traded Funds, which track its price on international markets.
Silver prices can move due to a wide range of factors. Geopolitical instability or fears of a deep recession can make Silver price escalate due to its safe-haven status, although to a lesser extent than Gold’s. As a yieldless asset, Silver tends to rise with lower interest rates. Its moves also depend on how the US Dollar (USD) behaves as the asset is priced in dollars (XAG/USD). A strong Dollar tends to keep the price of Silver at bay, whereas a weaker Dollar is likely to propel prices up. Other factors such as investment demand, mining supply – Silver is much more abundant than Gold – and recycling rates can also affect prices.
Silver is widely used in industry, particularly in sectors such as electronics or solar energy, as it has one of the highest electric conductivity of all metals – more than Copper and Gold. A surge in demand can increase prices, while a decline tends to lower them. Dynamics in the US, Chinese and Indian economies can also contribute to price swings: for the US and particularly China, their big industrial sectors use Silver in various processes; in India, consumers’ demand for the precious metal for jewellery also plays a key role in setting prices.
Silver prices tend to follow Gold’s moves. When Gold prices rise, Silver typically follows suit, as their status as safe-haven assets is similar. The Gold/Silver ratio, which shows the number of ounces of Silver needed to equal the value of one ounce of Gold, may help to determine the relative valuation between both metals. Some investors may consider a high ratio as an indicator that Silver is undervalued, or Gold is overvalued. On the contrary, a low ratio might suggest that Gold is undervalued relative to Silver.
The greenback has begun the month with its momentum challenged by the more recent labor data. The August ADP report was 38,000 compared to the 48,000 report that economists expected, and also showed a loss of jobs in manufacturing as well as professional and business services. The report supports signs of cooling hiring, and was lower for Treasury yields. Even with the reports, futures still hint at a 60%–65% likelihood of a rate hike in September by the Fed. Fed Chair Kevin Warsh also kept a hawkish stance at Jackson Hole with his speech, keeping expectations of a rate hike high. Friday’s employment data will be the last big report with the potential to change expectations, and a weak report will drop the likelihood of a rate hike.
The euro still supports a firm policy with eurozone inflation reaching 3.3% in August from July’s 2.9%. This increase was largely due to the Iran conflict and the resulting energy costs. The markets have priced in the expected 25 basis point increase with the deposit rate most likely to reach 2.50% for this hike. With core inflation reaching 2.4%, a more cautious slow pace of tightening is expected, rather than a prolonged hiking period.
Sterling is facing the harder of the two domestics. Gilt yields for the ten year have reached their highest level since 2007 at 5.294% with energy costs, inflation, and fiscal concerns and spending all reaching a high prior to the October budget. The BoE is still expected to hold Bank Rate at 3.75% in September, but a 25 basis point hike is expected in the coming year at later dates.
The movement of the FX theme for September 3 is expected to be data-dependent. Soft U.S. hiring diminishes the conviction of the Fed Funds rate hike, and the ECB retains the most compelling case for forward tightening. In the meantime, fiscal stress is holding back GBP, despite higher than desired inflation.
For September 3, the FX theme appears to be increasingly data dependent. Soft U.S. hiring diminishes the conviction of the Fed Funds rate hike, and the ECB maintains the most persuasive case for front-running tightening.
The U.S. Dollar Indexis currently trading at 99.23 on the 2-hour chart after dropping below the recovering channel from the August lows. What is interesting is how quickly the index was rejected at the 99.80 – 99.86 range. DXY lost 99.62, 99.48, and 99.35 very quickly, which shows how much the structure of the bullish recovery has weakened.
Domestic coffee prices today
Coffee prices today in the domestic market continued to decrease compared to the previous session. According to giacaphe. com, coffee prices on September 4th averaged 93,800 VND/kg.
In Dak Lak, coffee prices were recorded at 93,700 VND/kg, down 500 VND/kg.
In Lam Dong, coffee prices are still 93. 200 VND/kg, down 500 VND/kg.
In Gia Lai, coffee prices are at 93,700 VND/kg, down 500 VND/kg compared to the previous session.
The old Dak Nong area recorded a level of 94,000 VND/kg, down 500 VND/kg. This is the highest level in today’s price list.
The domestic coffee market has had a consecutive week of price decreases, generally losing 1,800 VND/kg compared to the beginning of the week.
The USD/VND exchange rate according to Vietcombank was recorded at 25,875 VND/USD, an increase of 15 VND/USD.
World coffee prices
In the world market, coffee prices are dominated by red color.
According to Barchart, the September 2026 Robusta futures contract slipped by 27 USD/ton, anchored at 3,298 USD/ton. The November 2026 futures fell by another 32 USD/ton, listed at 3,374 USD/ton. The January 2027-5. 2027 futures saw a decrease from 35-37 USD/ton, down to 3,326-3,360 USD/ton.
Similarly, the September 2026 Arabica futures contract closed down 4.05 US cents/lb, equivalent to 1.23%, to 324.35 cents/lb. The December 2026 term closed down 2.75 US cents/lb, equivalent to 0.92%, to 295.35 cents/lb. Further forwards fell from 2.7 to 3.15 cents/lb, anchored in the 280.00 – 285.05 cents/lb range.
Assessments and forecasts
According to statistics from the Japanese Customs authority, in the first 6 months of 2026, Japan’s coffee imports reached 173.0 thousand tons, worth nearly 1.20 billion USD, down 9.3% in volume, but up 2.4% in value compared to the same period in 2025.
In the first 6 months of 2026, the average import price of coffee into Japan reached 6,922 USD/ton, an increase of 12.9% compared to the same period in 2025. In which, the average import price of Japanese coffee from major markets all increased compared to the same period in 2025, only imports from Vietnam decreased. The import price of Japanese coffee from Vietnam decreased by 16.4% compared to the same period in 2025, down to 4,462 USD/ton.
Vietnam is the second largest coffee supplier to Japan in the first 6 months of 2026, reaching 55.5 thousand tons, worth 247.8 million USD, an increase of 5.0% in volume, but a decrease of 12.2% in value compared to the same period in 2025. Vietnam’s coffee market share in Japan’s total imports increased from 27.74% in the first 6 months of 2025 to 32.10% in the first 6 months of 2026.