The main category of Forex News.
You can use the search box below to find what you need.
[wd_asp id=1]
The main category of Forex News.
You can use the search box below to find what you need.
[wd_asp id=1]
Silver (XAG/USD) builds on Friday’s breakout momentum above the $43.00 mark and touches a fresh high since September 2011 at the start of a new week. The white metal trades around the $43.25 area during the Asian session, up 0.35% for the day, flirting with the top end of an ascending channel extending from the April swing low.
The aforementioned channel points to a well-established uptrend and backs the case for a further near-term appreciating move for the XAG/USD. That said, the Relative Strength Index (RSI) on the daily chart is flashing slightly overbought conditions and makes it prudent to wait for some near-term consolidation or a modest pullback before placing fresh bullish bets.
Any corrective slide below the $43.00 round figure, however, is more likely to attract fresh buyers near the $42.55 region. This, in turn, should help limit the downside for the XAG/USD near the $42.20-$42.15 region. This is closely followed by the $42.00 mark, below which the commodity could slide to the $41.65 area before eventually dropping to test sub-$41.00 levels.
On the flip side, acceptance above the ascending channel resistance will be seen as a fresh trigger for bullish traders and allow the XAG/USD to test the September 2011 swing high, around the $43.40 region. The positive momentum could extend further towards reclaiming the $44.00 round figure en route to the August 2011 peak, around the $44.25 region.
Silver is a precious metal highly traded among investors. It has been historically used as a store of value and a medium of exchange. Although less popular than Gold, traders may turn to Silver to diversify their investment portfolio, for its intrinsic value or as a potential hedge during high-inflation periods. Investors can buy physical Silver, in coins or in bars, or trade it through vehicles such as Exchange Traded Funds, which track its price on international markets.
Silver prices can move due to a wide range of factors. Geopolitical instability or fears of a deep recession can make Silver price escalate due to its safe-haven status, although to a lesser extent than Gold’s. As a yieldless asset, Silver tends to rise with lower interest rates. Its moves also depend on how the US Dollar (USD) behaves as the asset is priced in dollars (XAG/USD). A strong Dollar tends to keep the price of Silver at bay, whereas a weaker Dollar is likely to propel prices up. Other factors such as investment demand, mining supply – Silver is much more abundant than Gold – and recycling rates can also affect prices.
Silver is widely used in industry, particularly in sectors such as electronics or solar energy, as it has one of the highest electric conductivity of all metals – more than Copper and Gold. A surge in demand can increase prices, while a decline tends to lower them. Dynamics in the US, Chinese and Indian economies can also contribute to price swings: for the US and particularly China, their big industrial sectors use Silver in various processes; in India, consumers’ demand for the precious metal for jewellery also plays a key role in setting prices.
Silver prices tend to follow Gold’s moves. When Gold prices rise, Silver typically follows suit, as their status as safe-haven assets is similar. The Gold/Silver ratio, which shows the number of ounces of Silver needed to equal the value of one ounce of Gold, may help to determine the relative valuation between both metals. Some investors may consider a high ratio as an indicator that Silver is undervalued, or Gold is overvalued. On the contrary, a low ratio might suggest that Gold is undervalued relative to Silver.
The EUR/USD pair peaked at 1.1918, a fresh four-year high on Wednesday, giving up most of its gains and settling at around 1.1750 by the end of the week. Central banks lead the way, with the Federal Reserve (Fed) monetary policy decision rocking the board and giving fresh impetus to the US Dollar (USD).
Whereas such USD strength would be sustainable in time, it depends on the upcoming macroeconomic data. The Federal Open Market Committee (FOMC) delivered a cautious cut, announcing the reduction of its benchmark rate by 25 basis points (bps) after the September two-day meeting. Even further, the Summary of Economic Projections (SEP) showed that Fed officials anticipate two more rate cuts in 2025, confirming the market’s speculation of additional cuts in October and December. However, the same SEP showed policymakers retain the view of just one cut in 2026.
Of course, there was one dissenter, the newly appointed by United States (US) President Donald Trump, Stephen Miran. Miran voted for a 50 bps interest rate cut, and aimed for a 150 bps trim before year-end.
The decision fell short of President Trump’s desire, but pointed in the right direction. Market players were pricing in more than one cut in 2026, and the less dovish delivery ended up benefiting the Greenback after the initial USD sell-off.
Wall Street, however, rallied with the news, with the Dow Jones Industrial Average (DJIA) reaching unexplored territory. Gold price, on the contrary, eased from record highs, all of which reflects mounting optimism.
Chair Jerome Powell made some relevant comments in the press conference that followed the announcement. He said that the overall effect on economic activity of President Trump’s tariffs “remains to be seen,” adding that the lower immigration is below the softening jobs market rather than tariffs. “There’s very little growth, if any, in the supply of workers,” he stated.
Of course, he reiterated that the Fed is not on a preset path. “Our obligation is to ensure that a one-time increase in the price level does not become an ongoing inflation problem,” he said, while repeating that monetary policy decisions will be made meeting-by-meeting.
Meanwhile, US President Trump and his Chinese counterpart, Xi Jinping, had a call on Friday to discuss the permanence of the TikTok app in the US. Investors hope both leaders also discussed their trade relationship, further softening tensions between Washington and Beijing.
Ahead of the call, Trump noted that he could also grant his giant rival an extension to the trade truce, maintaining financial markets in a good mood ahead of the weekly close. Additional headlines on the matter will likely come in the next few days.
Mixed message from European Central Bank officials
The European Central Bank (ECB) had little to offer these last few days, after announcing its decision to keep interest rates unchanged on September 11. ECB Vice President Luis de Guindos noted the central bank needs to follow a “very prudent” approach to monetary policy amid still high uncertainty, but added there was “very positive” news on inflation. Finally, he noted that the present policy stance is appropriate.
ECB Governing Council member Mario Centeno, on the other hand, had a more dovish approach and said that the “next move is still likely to be a rate cut.” He also noted that the central bank cannot tolerate inflation below 2% for too long, a level it’s likely to reach in 2028, according to forecasts. Nevertheless, he still sees inflation risks to the downside.
The positive news from the inflation front that De Guindos mentioned came from the Eurozone Harmonized Index of Consumer Prices (HICP). The final estimate of the August HICP was confirmed at 2% YoY, below the 2.1% previously calculated, while the monthly figure was downwardly revised to 0.1% from a flash estimate of 0.2%.
Other than that, the Eurozone calendar included the German ZEW Survey on Economic Sentiment, which improved in September to 37.3 from the previous 34.7. Economic Sentiment in the bloc was also upbeat, hitting 26.1 from the previous 25.1. Still, the German assessment of the current situation fell to -76.4, worsening from the -68.6 posted in August.
As for the US, the country published August Retail Sales, up 0.6%. The figure beat the 0.2% anticipated by market players while matching the July revised figure, previously calculated at 0.5%.
In the days to come, the macroeconomic calendar will be more active. S&P Global, alongside local banks, will release the preliminary estimate of the September Purchasing Managers’ Indexes (PMIs) for all major economies. The European figures, published by the Hamburg Commercial Bank (HCOB), are expected to show a modest uptick in business activity. US figures, in the meantime, are expected to confirm continued expansion.
The US will publish the final estimate of the Q2 Gross Domestic Product (GDP) on Wednesday, expected to confirm an annualized growth of 3.3% in the three months to June.
Finally, the US will release the August Personal Consumption Expenditures (PCE) Price Index on Friday. The Fed’s favorite inflation gauge will come after the release of a not-so-encouraging Consumer Price Index (CPI) for the same month, showing inflationary pressures remain.
Other than that, there will be plenty of central banks’ speakers, which could provide fresh hints on what’s next for monetary policy decisions.
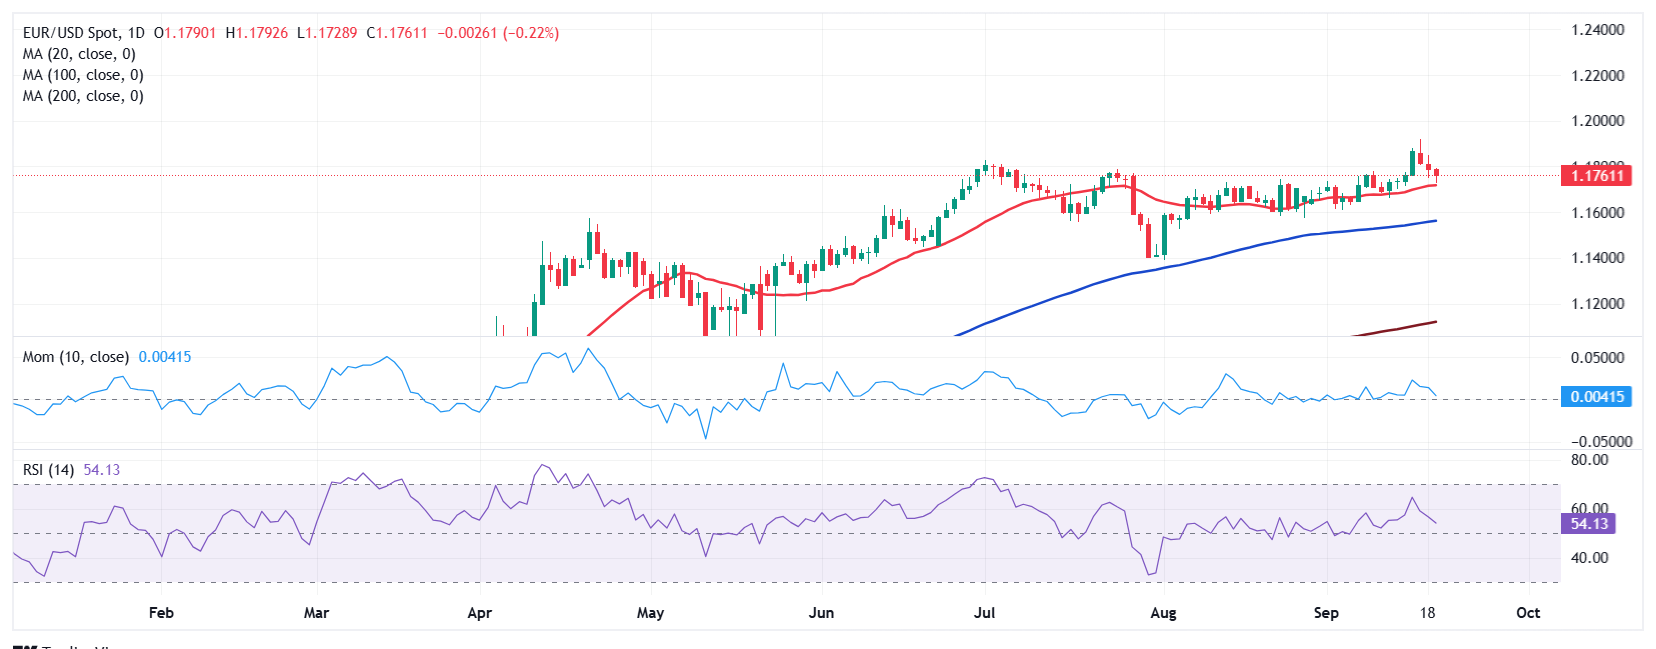
From a technical point of view, the weekly chart for the EUR/USD pair shows that the current candle offers a long upward wick and a very limited body that falls within familiar levels. The bullish case remains supported by moving averages, which keep heading north below the current level. The 20 Simple Moving Average (SMA) maintains its upward slope far above the longer ones, providing relevant mid-term support at around 1.1580. The Momentum indicator, however, aims lower within positive levels, approaching its midline and hinting at easing buying interest. Finally, the Relative Strength Index (RSI) indicator heads nowhere at around 65, also suggesting buyers paused.
EUR/USD is at the brink of turning even lower according to the daily chart. Moving averages have steadily lost their upward strength, and a flat 20 SMA stands at 1.1710, while an also directionless 100 SMA lies in the 1.1560 region. In the meantime, technical indicators head firmly lower and are about to cross their midlines into negative territory.
Near-term resistance comes at 1.1830, followed by the recent peak in the 1.1920 area. Additional gains expose the 1.2000 figure, with a rally towards the latter quite unlikely in the near term. On the other side of the equation, the 1.1700 mark offers immediate support ahead of the more relevant 1.1590 region. A clear break below the latter would open the door for a more sustained decline.
The Core Personal Consumption Expenditures (PCE), released by the US Bureau of Economic Analysis on a monthly basis, measures the changes in the prices of goods and services purchased by consumers in the United States (US). The PCE Price Index is also the Federal Reserve’s (Fed) preferred gauge of inflation. The YoY reading compares the prices of goods in the reference month to the same month a year earlier. The core reading excludes the so-called more volatile food and energy components to give a more accurate measurement of price pressures.” Generally, a high reading is bullish for the US Dollar (USD), while a low reading is bearish.
The Gold price (XAU/USD) posts a modest gain near $3,685 during the early Asian session on Monday. The yellow metal edges higher as the US Federal Reserve (Fed) cut the interest rates at its September meeting, as widely expected. Traders will take more cues from the Fedspeak later on Monday.
The Fed reduced its benchmark rate by 25 basis points (bps) last week, the first rate cut of 2025. This decision was supported by signs of a softening labor market and concerns about employment risks, despite inflation remaining somewhat elevated. Lower interest rates could reduce the opportunity cost of holding Gold, supporting the non-yielding precious metal.
Fed Chair Jerome Powell emphasized the rate cut as a “risk-management cut” and stated that future decisions would be made “meeting by meeting,” suggesting a less dovish than expected easing cycle than some investors anticipated. This, in turn, might lift the US Dollar (USD) and weigh on the USD-denominated commodity price.
Traders will also monitor the developments surrounding geopolitical risks. CNN reported that Russia carried out a major drone and missile attack across the country overnight into Saturday, according to Ukrainian President Volodymyr Zelensky. Despite diplomatic attempts to resolve the conflict, the war has increased in recent months. Geopolitical tensions in the Middle East and Eastern Europe could boost a traditional safe-haven asset like Gold.
Gold has played a key role in human’s history as it has been widely used as a store of value and medium of exchange. Currently, apart from its shine and usage for jewelry, the precious metal is widely seen as a safe-haven asset, meaning that it is considered a good investment during turbulent times. Gold is also widely seen as a hedge against inflation and against depreciating currencies as it doesn’t rely on any specific issuer or government.
Central banks are the biggest Gold holders. In their aim to support their currencies in turbulent times, central banks tend to diversify their reserves and buy Gold to improve the perceived strength of the economy and the currency. High Gold reserves can be a source of trust for a country’s solvency. Central banks added 1,136 tonnes of Gold worth around $70 billion to their reserves in 2022, according to data from the World Gold Council. This is the highest yearly purchase since records began. Central banks from emerging economies such as China, India and Turkey are quickly increasing their Gold reserves.
Gold has an inverse correlation with the US Dollar and US Treasuries, which are both major reserve and safe-haven assets. When the Dollar depreciates, Gold tends to rise, enabling investors and central banks to diversify their assets in turbulent times. Gold is also inversely correlated with risk assets. A rally in the stock market tends to weaken Gold price, while sell-offs in riskier markets tend to favor the precious metal.
The price can move due to a wide range of factors. Geopolitical instability or fears of a deep recession can quickly make Gold price escalate due to its safe-haven status. As a yield-less asset, Gold tends to rise with lower interest rates, while higher cost of money usually weighs down on the yellow metal. Still, most moves depend on how the US Dollar (USD) behaves as the asset is priced in dollars (XAU/USD). A strong Dollar tends to keep the price of Gold controlled, whereas a weaker Dollar is likely to push Gold prices up.
UBS Group strategists have lifted their dollar-yen forecasts,
compared with 130 previously.
The revision reflects rising political uncertainty in Japan, which UBS says has helped keep the Bank of Japan more dovish than markets once expected.
While investors are still pricing in one more BoJ rate hike before January 2026, the yen has not fully benefited from tightening expectations. Strategists pointed to Japan’s strong equity market and lower volatility as additional drags on the currency. UBS said there is little sign of a coordinated move toward a stronger yen, such as a new Plaza Accord, and the pair is more likely to trade toward the lower end of a 140–150 range rather than break below it for long.
On the U.S. side, the bank expects the dollar to remain weak as labor market softness pressures short-term Treasury yields lower.
While long-term fundamentals remain constructive, a late-week rebound in the U.S. Dollar Index to 97.646 and rising Treasury yields (10-year at 4.131%, 30-year at 4.743%) limited upside momentum. These moves raise the opportunity cost of holding gold, though they have not altered the underlying bullish structure.
Citi raised its 3-month gold price forecast to $3800, citing fiscal risks and fragile labor conditions. Deutsche Bank projects an average of $4000, pointing to continued central bank buying and investor demand. In India, physical premiums surged to a 10-month high despite record nominal prices, reflecting robust consumer interest.
Markets are now focused on this Friday’s release of the Fed’s preferred inflation gauge—Core PCE—and the final September University of Michigan Consumer Sentiment Index. July’s core PCE rose to 2.9% year over year, the highest since February. The Fed expects inflation to stay above target through 2026, while sentiment data suggests rising consumer unease about inflation and jobs. If PCE remains elevated and sentiment deteriorates, expectations for further rate cuts may strengthen, supporting gold’s upside.
– Written by
Ben Hughes
STORY LINK Euro to Dollar Forecast: EUR/USD Risks Retest of 1.1750 Before Recovery to 1.1850
The US dollar extended its rebound into Friday, forcing the Euro to Dollar (EUR/USD) exchange rate back under 1.1750 at the New York open.
While short covering and firmer US data have underpinned the greenback, the euro remains trapped below 1.1800, with traders debating whether support at 1.1750 can hold or if deeper losses toward 1.1700 are on the cards.
The Euro to Dollar exchange rate (EUR/USD) found support on dips to 1.1750 on Thursday, but has not been able to regain the 1.1800 level and again dipped to below 1.1750 at the US open.
The dollar has been able to gain net support in global markets with evidence of short covering following the Federal Reserve interest rate cut.
Scotiabank commented; “The outsized reaction to Thursday’s better than expected claims data have also revealed a market that appears vulnerable to a squeeze.”
According to UoB; “Although downward momentum has not increased significantly, EUR could retest the 1.1750 level before a more sustained recovery is likely.
Get better rates and lower fees on your next international money transfer.
Compare TorFX with top UK banks in seconds and see how much you could save.
Scotiabank focussed on potential support; “We look to support around the previously broken descending trend line drawn from the July highs, and would expect it to limit losses below 1.17.”
On the upside UoB added; “if EUR breaks above 1.1825, it would indicate that the current downward pressure has eased.”
ING is still positive on the outlook; “We are sticking to our call for EUR/USD to climb back to the 1.1850 handle in the coming days.”
Markets will continue to digest this week’s Federal Reserve decision and the policy outlook.
As far as the near-term outlook is concerned, markets are pricing in over a 90% chance that there will be a further 25 basis-point cut at the October policy meeting.
RBC Capital Markets expects further dollar losses; “The FOMC has embarked on a new rate cutting cycle, the first and most important of several pillars we are expecting to drive US$ to weaken.”
Credit Agricole, notes the scope for a dollar to recover from over-sold levels; “The Fed did not validate the excessively dovish market expectations at its September meeting, and this helped the USD regain some ground across the board.”

The bank discussed the potential for a more sustained recovery; “The question remains, however, whether the FOMC pushback would be sufficient to help the currency recover on a more sustained basis. We think that this could be the case in part because the market USD-bearish narrative has evolved considerably of late.”
European developments have not had a major impact at this stage.
ING noted developments in France; “Their latest political news isn’t very encouraging, as the new prime minister is facing harsh union opposition to his fiscal plans, and negotiations with the Socialists – who are believed to hold the key to passing the budget – have not yielded good results so far.”
It added; “The risk of further widening in the OAT-Bund spreads remains tangible, but what matters most for the euro is the rate of change in those adjustments, and so far we are not expecting a material FX spillover.”
International Money Transfer? Ask our resident FX expert a money transfer question or try John’s new, free, no-obligation personal service! ,where he helps every step of the way,
ensuring you get the best exchange rates on your currency requirements.
TAGS: Euro Dollar Forecasts
The USD/JPY weekly forecast tilts to the downside as the internal pressure grows in the Bank of Japan to hike interest rates.
The USD/JPY pair had a bullish week as the dollar recovered after an expected Fed rate cut. However, the Bank of Japan policy meeting also briefly boosted the yen on Friday.
–Are you interested in learning more about MT5 brokers? Check our detailed guide-
The dollar and Treasury yields recovered during the week after the Fed cut rates by 25-bps. After months of anticipation, traders had mostly priced in the move. Therefore, when it happened exactly as expected, the dollar pulled back. At the same time, Powell said the central bank would continue assessing the risks of inflation.
Meanwhile, the Bank of Japan held interest rates as expected. However, traders were surprised when two policymakers voted for a rate hike. As a result, the yen rallied.

Next week, traders will pay attention to the Bank of Japan policy meeting minutes to see what went into Friday’s decision. Already, it was clear that two policymakers were ready to hike interest rates. Therefore, there is more pressure from inside the central bank to resume its monetary tightening. The minutes will give better details on the dissenting voices.
Meanwhile, the US will release its GDP report and core durable goods orders. These reports will show the state of the economy, shaping the outlook for future Fed rate cuts.
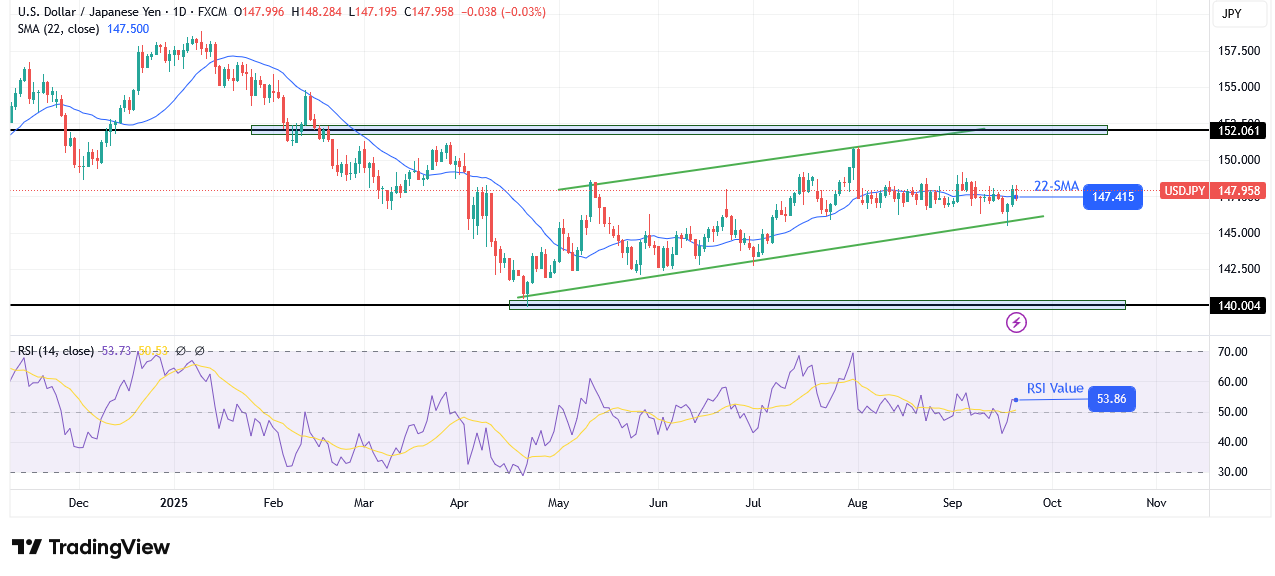
On the technical side, the USD/JPY price trades in a shallow bullish channel and recently retested the channel support. Bulls emerged at the channel support and pushed the price above the 22-SMA. Meanwhile, the RSI moved above 50, indicating stronger bullish momentum.
–Are you interested in learning more about forex signals telegram groups? Check our detailed guide-
If bulls maintain their momentum, the price will climb to retest the channel resistance. Such a move would allow bulls to test the 152.06 resistance level. A break above would strengthen the bullish bias. On the other hand, there is a chance bears will retest the channel support.
Before it started trading in the channel, USD/JPY was in a solid downtrend. However, it paused when it got to the 140.00 key support level. Here, the price started a corrective move in a bullish channel. Therefore, another impulsive move could be to the downside.
Looking to trade forex now? Invest at eToro!
68% of retail investor accounts lose money when trading CFDs with this provider. You should consider whether you can afford to take the high risk of losing your money.
I wrote on 14th September that the best trades for the week would be:
These trades produced an overall gain of 6.80%, equal to 1.70% per asset.
A summary of last week’s most important data:
The major takeaway from the week was continuing strength in the US economy, which was a bit of a turnaround from the previous week. An impending recession in New Zealand is also on the cards, although globally speaking this isn’t a big deal, but it certainly is making an impact on the New Zealand Dollar.
There was again directional volatility than has been usual over recent weeks. Maybe the Forex market is starting to wake up.
There were record highs in Gold and in the major US stock market indices the S&P 500 and the NASDAQ 100, and a 14-year high in Silver. Markets now see a 78% chance of two further rate cuts, but the significance of last week’s Fed meeting was the hawkish tilt and the new expectation of only one further rate cut in 2026, so the US interest rate is still seen as likely to be 3.50% more than one year from now, and this may prop up the US Dollar despite its long-term bearish trend
This is likely to be a good time to trade or invest, with US stock markets and Gold and Silver really taking off.

The coming week will probably be quieter, as there are notable fewer high-impact data releases scheduled. It is likely that volatility will remain relatively low in the Forex market, with more action taking place in bullish stock markets. The VIX is at a low level, which suggests that the stock market’s bullish trend is likely to continue.
This week’s important data points, in order of likely importance, are:
It is a public holiday in Japan on Monday.
For the month of September 2025, I forecasted that the EUR/USD currency pair would rise in value if we got a daily close above $1.1806.
This set up on Tuesday, but the price has been falling since then.
")
I made no weekly forecast last week.
There were no unusually large price movements in currency crosses last week, so I have no weekly forecast this week.
The Canadian Dollar was the strongest major currency last week, while the New Zealand Dollar was the weakest. Volatility was unchanged from last week, with 26% of the most important Forex currency pairs and crosses changing in value by more than 1%. Next week’s volatility is likely to decrease as we have only one major central bank policy meetings but little else scheduled of high importance.
You can trade these forecasts in a real or demo Forex brokerage account.
")
Last week, the US Dollar Index printed a bullish pin bar after printing four consecutive bearish ones. Also, the price is now above where it was 13 weeks ago, so by my preferred metric, I can declare the long-term bearish trend is over. This places the US Dollar in an interesting position.
We can account for the new firmness in the US Dollar by what happened at the Fed’s policy meeting last Wednesday – if you drill down to a shorter-term price chart, you can see the strong bullish reversal from the low happened just as that meeting started to announce its results. The Fed has now led the market to expect fewer rate cuts in 2026 – only one is now widely forecasted – so we have seen a hawkish tilt, which was given a further tailwind by Jerome Powell’s talk about inflation remaining somewhat high.
It may not be wise to focus on short USD trades right now, although there are strong bullish trends in some assets which are priced in USD which are gaining very strongly. I think it is not so much about the Dollar, but more about funds flowing into the USA.
")
The EUR/USD currency pair finally made a long-awaited bullish breakout last week, rising strongly to reach a new 4-year high. This would have been a signal for a lot of trend traders, including me, to go long. However, the price has declined since that signal was given, but that doesn’t necessarily mean much for this currency pair, which typically sees deep retracement within its long-term trends, which it tends to follow relatively reliably.
Worrying for bulls though, the weekly chart below shows that the weekly candlestick was a bearish pin bar, rejecting an area just above a major consolidation zone, which is a bearish sign.
The Euro was one of the strongest major currencies over the past week, despite its decline during the second half of the week.
I remain long of this currency pair, and I see a potential new long trade entry if get a daily (New York) close above $1.1867. However, if you are going to buy on the dips, this is one of the best currency pairs to do that with. A bounce off $1.1735 would be the logical entry signal for a dip buy here.
")
The NZD/USD currency pair was one of the biggest movers last week, printing a large bearish engulfing candlestick which closed very near to its low. These are bearish signs, but it is worth noting that the price is approaching an area which has been pivotal in recent months, and which could be supportive. Also, the price has not truly exited its recent consolidation zone. Another cautionary note can come from the fact that the New Zealand Dollar does not have a great track record of respecting trends and tends to reverse very easily.
Having said all that, there is a good fundamental reason behind the Kiwi’s decline last week – New Zealand quarterly GDP came in at a much worse than expected level, showing a decline of 0.9% when the consensus forecast was a decline of about 0.3%. This raises fear of a recession which would likely prompt a series of hasty rate cuts.
It will be interesting to see what will happen next week. A further decline in the Kiwi would not be surprising. Possibly it would be a good component for a short basket.
")
The S&P 500 Index had a great week, rising strongly and closing not far from the top of its range well into blue sky at a new record high, almost reaching 6,700. The way the price was able to overcome the big round number at 6,500 was another bullish sign.
US stock markets are rising strongly despite the recent strength in the US Dollar.
The index has risen by about 10% since the start of 2025 and by 36% since the April low caused by the Trump tariff panic. It is an open question how much further the current bull run will go, but betting against new record highs in the US stock market is a brave and probably foolish move, unless it’s a cautious play in individual underperforming stocks.
I am bullish on the S&P 500 Index.
")
The NASDAQ 100 Index had a great week, rising strongly and closing very near the top of its range well into blue sky at a new record high, above 24,500. This was an outperformance over the broader S&P 500 Index.
US stock markets are rising strongly due to the increasing feeling that the US economy is stronger than was expected last week.
The index has risen by more than 15% since the start of 2025 and by nearly 50% since the April low caused by the Trump tariff panic. These are above-average numbers, even in a bull market, especially the increase from April. It is an open question how much further the current bull run will go, but betting against new record highs in the US stock market is a brave and probably foolish move, unless it’s a cautious play in individual underperforming stocks.
I am very bullish on the NASDAQ 100 Index.
")
Silver had another stunning week, showing yet another outsize rise in value, again closing near the top of its weekly range, and powering up to a new 14-year high. It also outperformed Gold and all other precious metals. These are bullish signs, as is the breakout from the linear regression analysis shown within the price chart below.
With Silver’s outperformance against Gold, it is probably worth being bold on the long side here.
Having said, if you are only just entering a new long trade here, as the move is quite extended, a smaller position size might be wise.
I am very bullish on Silver.
")
Gold rose last week to rise to print a new all-time high, but closed a bit below that high and the round number at $3,700. It is worth noting that Gold underperformed Silver, and left a bit of an upper wick on the weekly candlestick, as can be seen in the price chart below.
The long-term bullish trend and break to new record highs are bullish factors, as is the strong US stock market, as the US stock market has tended to be positively correlated with Gold, to the surprise of many who see it as a hedge against inflation.
For anyone who is only entering a long trade now, it might be wise to use a smaller position size to account for any sudden high-volatility snapback towards lower prices. Just like the stock market, you have to wonder how much further this bull run will last – but it is backed by a very strong long-term bullish trend, and you trade against that at your peril unless you start to see clear signs of a reversal in the price action – which is not showing here yet.
I am bullish on Gold, but it might be wise to take a smaller long position here than with Silver, which looks more bullish. I would wait for a daily (New York) close above $3,700 before entering any new long trade here.
")
I see the best trades this week as:
Ready to trade our Forex weekly forecast? Check out our list of the top 100 Forex brokers.
– Written by
Tim Boyer
STORY LINK Pound Sterling to Dollar Forecast: Fiscal Shock Sends GBP Sliding Toward 1.34
The Pound to Dollar exchange rate (GBP/USD) weakened on Thursday as fresh concerns over the UK’s fiscal outlook rattled gilts and reinforced fears of a “doom loop” between rising yields and higher debt-servicing costs.
Government borrowing surged to £18.0bn in August, the highest for five years, fuelling deficit worries ahead of the November budget.
Against this backdrop, the Pound to Dollar (GBP/USD) exchange rate fell to 10-day lows near 1.3480 before stabilising around 1.3500.
Sterling came under pressure after the latest public finance figures revealed a sharp jump in the deficit, extending the five-month shortfall to £83.8bn compared with £67.6bn a year earlier, and well above Office for Budget Responsibility (OBR) projections.
Neil Wilson, UK investor strategist at Saxo Markets, was scathing:
“Sterling is rightly getting the treatment because the borrowing is a) too high, b) unsustainable, c) out of control and d) never going to change.”
Get better rates and lower fees on your next international money transfer.
Compare TorFX with top UK banks in seconds and see how much you could save.
The bond market reaction was swift. Ten-year gilt yields climbed to 4.70%, while 30-year yields jumped to 5.55%, edging back towards the 27-year highs hit earlier this month.
Analysts warned the move threatens to worsen the debt burden and intensify fiscal risks.
Matt Swannell, chief economic advisor to the EY ITEM Club, warned;
“the task of getting the public finances back on track could be made much more difficult by a downgrade to the OBR’s very optimistic growth forecasts, leaving a £20bn hole in tax revenue.”
PwC economist Nabil Taleb added;
“Months of high borrowing and the political challenge of cutting spending have all but wiped out the chancellor’s headroom. The test will be whether she [Chancellor Reeves] can make them palatable to voters and markets.”
International Money Transfer? Ask our resident FX expert a money transfer question or try John’s new, free, no-obligation personal service! ,where he helps every step of the way,
ensuring you get the best exchange rates on your currency requirements.
TAGS: Pound Dollar Forecasts
Important DisclaimersThe content provided on the website includes general news and publications, our personal analysis and opinions, and contents provided by third parties, which are intended for educational and research purposes only. It does not constitute, and should not be read as, any recommendation or advice to take any action whatsoever, including to make any investment or buy any product. When making any financial decision, you should perform your own due diligence checks, apply your own discretion and consult your competent advisors. The content of the website is not personally directed to you, and we does not take into account your financial situation or needs.The information contained in this website is not necessarily provided in real-time nor is it necessarily accurate. Prices provided herein may be provided by market makers and not by exchanges.Any trading or other financial decision you make shall be at your full responsibility, and you must not rely on any information provided through the website. FX Empire does not provide any warranty regarding any of the information contained in the website, and shall bear no responsibility for any trading losses you might incur as a result of using any information contained in the website.The website may include advertisements and other promotional contents, and FX Empire may receive compensation from third parties in connection with the content. FX Empire does not endorse any third party or recommends using any third party’s services, and does not assume responsibility for your use of any such third party’s website or services.FX Empire and its employees, officers, subsidiaries and associates, are not liable nor shall they be held liable for any loss or damage resulting from your use of the website or reliance on the information provided on this website.Risk DisclaimersThis website includes information about cryptocurrencies, contracts for difference (CFDs) and other financial instruments, and about brokers, exchanges and other entities trading in such instruments. Both cryptocurrencies and CFDs are complex instruments and come with a high risk of losing money. You should carefully consider whether you understand how these instruments work and whether you can afford to take the high risk of losing your money.FX Empire encourages you to perform your own research before making any investment decision, and to avoid investing in any financial instrument which you do not fully understand how it works and what are the risks involved.


 Price Forecast: Core PCE Data May Trigger Fresh Gold Breakout")
")
