The main category of Forex News.
You can use the search box below to find what you need.
[wd_asp id=1]
The main category of Forex News.
You can use the search box below to find what you need.
[wd_asp id=1]
Silver prices consolidated near the $33.80 mark for the third consecutive trading day, with buyers struggling to clear the $34.00 a troy ounce mark. At the time of writing, as the Asian session commences, the XAG/USD trades at $33.85, which is virtually unchanged.
Silver’s price rally halted once the grey metal peaked yearly at $34.08. Since then, buyers have lacked the strength to drive the precious metal to challenge last year’s peak of $34.86, which, if taken out, would pave the way for testing the $35.00 mark.
Worth noting that the Relative Strength Index (RSI) turned flat near overbought territory. This hints that buyers could be taking a breather before launching an assault to challenge higher prices.
Conversely, XAG/USD failed to conquer $34.00, paving the way for a pullback. The first support would be the February 14 high of $33.39. A breach of the latter will expose the $33.00 figure, followed by the 50-day Simple Moving Average (SMA) at $30.57.
Silver is a precious metal highly traded among investors. It has been historically used as a store of value and a medium of exchange. Although less popular than Gold, traders may turn to Silver to diversify their investment portfolio, for its intrinsic value or as a potential hedge during high-inflation periods. Investors can buy physical Silver, in coins or in bars, or trade it through vehicles such as Exchange Traded Funds, which track its price on international markets.
Silver prices can move due to a wide range of factors. Geopolitical instability or fears of a deep recession can make Silver price escalate due to its safe-haven status, although to a lesser extent than Gold’s. As a yieldless asset, Silver tends to rise with lower interest rates. Its moves also depend on how the US Dollar (USD) behaves as the asset is priced in dollars (XAG/USD). A strong Dollar tends to keep the price of Silver at bay, whereas a weaker Dollar is likely to propel prices up. Other factors such as investment demand, mining supply – Silver is much more abundant than Gold – and recycling rates can also affect prices.
Silver is widely used in industry, particularly in sectors such as electronics or solar energy, as it has one of the highest electric conductivity of all metals – more than Copper and Gold. A surge in demand can increase prices, while a decline tends to lower them. Dynamics in the US, Chinese and Indian economies can also contribute to price swings: for the US and particularly China, their big industrial sectors use Silver in various processes; in India, consumers’ demand for the precious metal for jewellery also plays a key role in setting prices.
Silver prices tend to follow Gold’s moves. When Gold prices rise, Silver typically follows suit, as their status as safe-haven assets is similar. The Gold/Silver ratio, which shows the number of ounces of Silver needed to equal the value of one ounce of Gold, may help to determine the relative valuation between both metals. Some investors may consider a high ratio as an indicator that Silver is undervalued, or Gold is overvalued. On the contrary, a low ratio might suggest that Gold is undervalued relative to Silver.
The USD/JPY rose for the second straight day, climbing past the 149.00 figure late in Monday after US economic data was mixed, following good Retail Sales data and a dismal New York Fed Empire State Manufacturing Index report. At the time of writing, the pair gains over 0.34%.
The USD/JPY is downward biased despite rebounding near 146.50. This exacerbated a 250-pip rally capped by the Tenkan-sen dynamic resistance at 148.36. Although the latter has been cleared, buyers cannot conquer the next key ceiling level, which is seen at 150.00.
A daily close above the latter could drive the USD/JPY toward the Senkou Span A at 149.51, followed by the Kijun-sen at 150.67.
On the other hand, if USD/JPY struggles at 150.00, the first support is 149.00. On further weakness, sellers could push the exchange rate toward the Tenkan-sen at 148.36, ahead of 148.00, followed by the March 13 low of 147.41.
The table below shows the percentage change of Japanese Yen (JPY) against listed major currencies today. Japanese Yen was the strongest against the US Dollar.
| USD | EUR | GBP | JPY | CAD | AUD | NZD | CHF | |
|---|---|---|---|---|---|---|---|---|
| USD | -0.41% | -0.43% | 0.30% | -0.68% | -0.88% | -1.36% | -0.49% | |
| EUR | 0.41% | -0.13% | 0.31% | -0.26% | -0.59% | -0.96% | -0.10% | |
| GBP | 0.43% | 0.13% | 0.78% | -0.34% | -0.49% | -0.84% | -0.03% | |
| JPY | -0.30% | -0.31% | -0.78% | -0.97% | -1.38% | -1.58% | -0.90% | |
| CAD | 0.68% | 0.26% | 0.34% | 0.97% | -0.41% | -0.68% | -0.35% | |
| AUD | 0.88% | 0.59% | 0.49% | 1.38% | 0.41% | -0.33% | 0.52% | |
| NZD | 1.36% | 0.96% | 0.84% | 1.58% | 0.68% | 0.33% | 0.87% | |
| CHF | 0.49% | 0.10% | 0.03% | 0.90% | 0.35% | -0.52% | -0.87% |
The heat map shows percentage changes of major currencies against each other. The base currency is picked from the left column, while the quote currency is picked from the top row. For example, if you pick the Japanese Yen from the left column and move along the horizontal line to the US Dollar, the percentage change displayed in the box will represent JPY (base)/USD (quote).
A better market mood weighs on the US Dollar (USD), yet that same positive mood maintains Gold’s gains limited.
Spot Gold consolidates just below $3,000 a troy ounce on Monday, recovering the ground shed on Friday. A better market mood weighs on the US Dollar (USD), yet that same positive mood maintains Gold’s gains limited. Exacerbating range trading, the United States (US) Federal Reserve (Fed) is set to announce its decision on monetary policy next Wednesday.
The Fed is widely anticipated to keep the benchmark interest rate on hold at 4.25%-4.50% amid the uncertainty surrounding US President Donald Trump’s trade war and its impact on the economic performance of the world’s largest economy. However, the central bank will also release the Summary of Economic Projections (SEP) or dot-plot, a document providing a fresh view of the overall state of the American economy alongside officials’ aims at interest rate moves. Finally, Chairman Jerome Powell will deliver a press conference to explain policymakers’ reasoning beyond the announcement.
In the meantime, softer-than-anticipated US data further weighs on the USD. The country released the New York Empire State Manufacturing Index, which fell to -20 in March, much worse than the -1.9 expected and the previous 5.7. The US also reported that Retail Sales were up 0.2% in February, below the 0.7% advance expected although better than the -1.2% posted in January.
The XAU/USD pair consolidates near record highs, and the daily chart shows that buyers paused but did not give up. The pair stands well above a bullish 20 Simple Moving Average (SMA), which advances far above the 100 and 200 SMAs. Technical indicators, in the meantime, eased from extreme overbought levels and stabilized well above their midlines, suggesting sellers are nowhere to be found.
The near-term picture is bullish. Technical indicators in the 4-hour chart resumed their advances with uneven strength yet well into positive territory. Furthermore, XAU/USD trades above bullish moving averages, with the 20 SMA currently providing dynamic support at around $2,925.80.
Support levels:2,978.40 2,962.10 2,946.80
Resistance levels: 3,010.00 3,025.00 3,040.00
Notice that the price zone around the 20-Day MA and internal uptrend line trend indicators were successfully tested today as resistance following a breakdown below those lines last week. This is typical behavior of price in a developing downtrend. Prior support is tested as resistance before a continuation of the bearish decline. There has been one downswing since the new trend high of $4.90 was reached last week. A swing low was established at last Thursday’s low of $3.96 and today’s high generated a possible lower swing high. If there is a decline below last Thursday’s low of $3.95, a second leg down will be indicated.
Since the 20-Day MA failed to hold as support, the 50-Day MA, currently at $3.84, becomes a potential target. Moreover, the uptrend that began from the recent $2.99 swing low shows a bearish reversal if the higher swing low of $3.74 from March 3 is exceeded to the downside. Similarly, since the internal uptrend line was broken and it marks support for a trend with a relatively steep angle, the next lower trendline becomes a potential target. Keep in mind that both the dynamic 50-Day line and next lower trendline are rising. Despite the potential for further downside in prices, the market for natural gas will provide clues based on how it behaves around particular price levels of support and resistance.
If the 20-Day MA and trendline continue to show an area of resistance, the current bearish pullback can be expected to continue, or a consolidation phase exhibiting downward pressure may form. Although there were signs of brief strength over the past few days as natural gas traded above the 20-Day line and trendline, on each of the prior three days the closing price for the day was below the lines.
For a look at all of today’s economic events, check out our economic calendar.
March 17, 2025 – Written by David Woodsmith
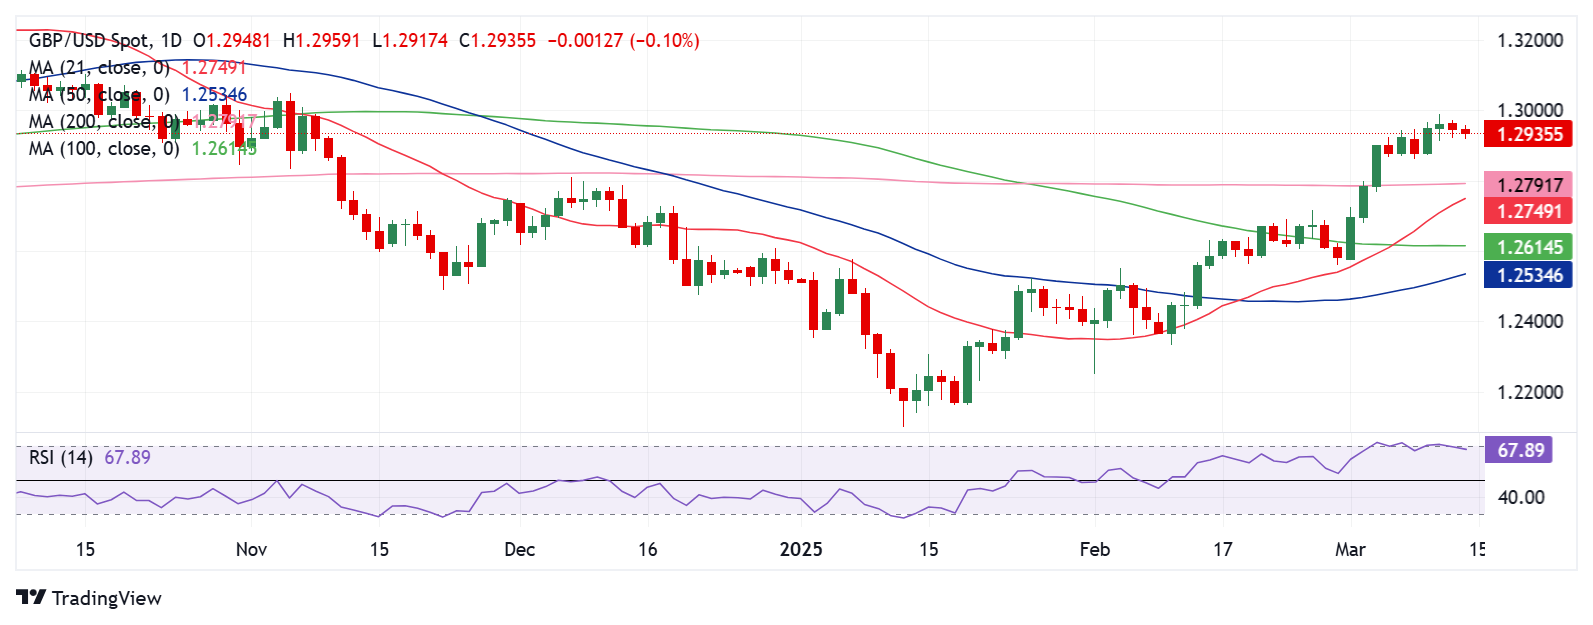
STORY LINK GBP/USD Forecast: Pound Sterling Test of 1.2990 Best “is Developing”
Pound Sterling (GBP) was rangebound versus the US Dollar (USD) on Monday despite the release of some underwhelming US retail sales data.
At the time of writing, the Pound US Dollar exchange rate was trading at approximately $1.2971, virtually unchanged from the start of Monday’s session.
On Monday, the US Dollar (USD) faced difficulties in attracting investor interest and slumped against most of its major counterparts following the release of the latest US retail sales index.
The report showed a lower-than-expected increase in February, rising from -1.2% to 0.2%, falling short of the expected 0.6% gain.
Amid ongoing concerns about the overall health of the US economy, Monday’s disappointing data further weakened the ‘Greenback’ at the beginning of the week.
Additionally, a positive market mood reduced the appeal of the safe-haven currency, exacerbating the US Dollar’s decline.
On Monday, the Pound (GBP) experienced fluctuations against most of its major trading partners as a lack of UK economic data at the start of the week left Sterling without a clear direction.
![]()
Investors were also likely cautious about making significant moves on the Pound ahead the release of important economic data later in the week.
On Thursday, the UK is scheduled to release its latest employment figures, and the Bank of England (BoE) will announce its latest interest rate decision.
As these key data points approach, GBP exchange rates will likely continue to fluctuate.
Looking ahead, the main driver for the Pound US Dollar exchange rate on Tuesday will likely be market sentiment, given the absence of economic data from both the UK and the US.
If the positive market mood from Monday carries over into Tuesday’s European session, then the GBP/USD exchange rate could strengthen.
However, if markets become more cautious, the GBP/USD exchange rate could face downward pressure.
According to FX strategists at Scotiabank, GBPUSD’s short-term technicals remain bullish.
“Sterling has been carving out a running consolidation just below the 1.30 level over the past week.
“The pound’s push higher so far today suggests a retest of last week’s 1.2990 high is developing ahead of a push on to the “real” top of the range at the moment at 1.3035.
Support is 1.2925/30.”
International Money Transfer? Ask our resident FX expert a money transfer question or try John’s new, free, no-obligation personal service! ,where he helps every step of the way,
ensuring you get the best exchange rates on your currency requirements.
TAGS: Pound Dollar Forecasts
Intraday Movement:
Bitcoin’s price has slightly retreated in recent intraday trading, relying on support from its 50-period simple moving average.
This move appears aimed at gaining some positive momentum to sustain the ascending corrective wave dominating its short-term trading, supported by a series of positive RSI signals after previously reaching extreme oversold levels.
Outlook:
We anticipate that Bitcoin’s price will resume its upward movement in upcoming sessions, provided that the near support at $81,970.00 holds firm.
With this support intact, our price target extends to $87,000.
To get our more detailed analysis and 100% accurate signals provided by Best Trading Signal, subscribe to Economies.com VIP Club through the link below!
Although GBP/USD registered modest losses on Thursday and Friday, the pair managed to end the previous week in positive territory. Early Monday, the pair moves sideways at around 1.2950.
During the European trading hours, US stock index futures lose about 0.5% on the day, pointing to a cautious market stance. Nevertheless, GBP/USD’s downside remains supported for now, with investors refraining from taking large positions in anticipation of this week’s key macroeconomic events. Read more…
The Pound Sterling (GBP) almost tested the critical 1.3000 level against the US Dollar (USD) in the past week, driving the GBP/USD pair to its highest level in four months.
GBP/USD stretched its previous week’s positive momentum and reached four-month highs just shy of the 1.3000 threshold on Wednesday before entering an upside consolidative phase in the remainder of the week. Read more…
April WTI crude oil (CLJ25) today is up +0.21 (+0.31%), and April RBOB gasoline (RBJ25) is up +0.236 (+1.10%).
Crude oil prices today climbed to a 1-1/2 week high and are mildly higher. Today’s dollar weakness is bullish for crude prices. Crude is also climbing on heightened geopolitical risks in the Middle East that could lead to a disruption of crude supplies from the region after the US launched strikes against Houthi Rebels in Yemen for attacking shipping in the Red Sea. Gains in crude are limited by hopes for a ceasefire in Ukraine, with President Trump set to speak with Russian President Putin this week as Mr. Trump pushes for an end to the three-year conflict.
Commodity Bulletin: From crude oil to coffee, this FREE newsletter is for industry pros and rookies alike
Crude prices are finding support today from rising tensions in the Middle East, which could lead to disruption of supplies from the region. The US launched weekend strikes on Yemen’s Houthi rebels, and Defense Secretary Hegseth said strikes will be “unrelenting” until the group stops attacking vessels in the Red Sea.
Today’s global economic news was mixed for crude prices. On the positive side, China Feb industrial production rose +5.9% year-to-date, stronger than expectations of +5.3% year-to-date. Also, China Feb retail sales rose +4.0% year-to-date, stronger than expectations of +3.8% year-to-date. Conversely, US Feb retail sales rose +0.2% m/m, weaker than expectations of +0.6% m/m. Also, the US Mar Empire manufacturing survey of general business conditions fell -25.7 to a 14-month low of -20.0, weaker than expectations of -1.9. In addition, the US Mar NAHB housing market index unexpectedly fell -3 to a 7-month low of 39, weaker than expectations of no change at 42.
A bearish factor for crude was Sunday’s action by Goldman Sachs to cut its year-end WTI crude price forecast to $67 a barrel from $72 and lower its 2025 global oil demand forecast by 18% to 900,000 bpd, citing a slowing global economy from tariffs and the OPEC+ plan to increase production.
On the bearish side of oil prices, the markets remain concerned that US tariffs and retaliatory tariffs will curb global growth and undercut energy demand.
Ramped-up Russian oil exports are negative for crude prices after data compiled by Bloomberg from analytics firm Vortexa showed Russian Feb oil products exports reached a 1-year high of 2.5 million bpd.
Crude prices were undercut when OPEC+ said on March 3 that it would restart some halted crude output in April, adding 138,000 bpd to global supplies. That is the first of a series of monthly hikes to reverse the 2-year-long production cut, which will gradually restore a total of 2.2 million bpd. OPEC+ had previously planned to restore production between January and late 2025, but now that production cut won’t be fully restored until September 2026. OPEC Feb crude production rose +320,000 bpd to a 14-month high of 27.35 million bpd.
In a supportive factor for crude oil prices, the US on January 10 imposed new sanctions on Russia’s oil industry that could curb global oil supplies. The measures targeted Gazprom Neft and Surgutneftgas, which exported about 970,000 bpd of Russian crude in the first 10 months of 2024, accounting for about 30% of its tanker flow, according to Bloomberg data. The US also targeted insurers and traders linked to hundreds of tanker cargoes. Weekly vessel-tracking data from Bloomberg showed Russian crude exports fell by -45,000 bpd to 3.48 million bpd in the week to March 9.
Crude oil demand in China has weakened and is a bearish factor for oil prices. According to Chinese customs data, China’s 2024 crude imports fell -1.9% y/y to 553 MMT. China is the world’s biggest crude importer.
A decline in crude oil held worldwide on tankers is bullish for oil prices. Vortexa reported today that crude oil stored on tankers that have been stationary for at least seven days fell by -20% w/w to 60.89 million bbl in the week ended March 14.
Last Wednesday’s EIA report showed that (1) US crude oil inventories as of March 7 were -5.1% below the seasonal 5-year average, (2) gasoline inventories were +1.3% above the seasonal 5-year average, and (3) distillate inventories were -4.8% below the 5-year seasonal average. US crude oil production in the week ending March 7 rose +0.5% w/w to 13.575 million bpd, modestly below the record high of 13.631 million bpd from the week of December 6.
Baker Hughes reported last Friday that active US oil rigs in the week ending March 14 rose +1 rig to 487 rigs, mildly above the 3-year low of 472 rigs posted on January 24. The number of US oil rigs has fallen over the past two years from the 4-1/2 year high of 627 rigs posted in December 2022.
On the date of publication, Rich Asplund did not have (either directly or indirectly) positions in any of the securities mentioned in this article. All information and data in this article is solely for informational purposes. For more information please view the Barchart Disclosure Policyhere.
More news from Barchart
Looking at the weekly candlestick, I can see that it is a bit of a hammer and I’m seeing that across the board with the US dollar against most of its major currency competitors. next week could be interesting for the greenback. In this particular currency pair, I would need to see a daily close above 150 yen to get particularly interested in buying, but it is worth noting that the interest rate differential does favor the United States.

Furthermore, if there’s a little bit more of a risk on feel, then you could make the argument for this pair of rallying as well. Keep in mind that the Japanese yen tends to move in the same direction against most currencies. So, if this one rises, you might be able to find more juice with the British pound against the Japanese yen, or even the New Zealand dollar against the Japanese yen as an example. On the other hand, if we do fall from here, we could very well plunge towards the 145 yen level, which is
All things being equal, the next major support level underneath. I do think that you have a situation where traders are a little hesitant to get overly exposed one way or the other. So, I would like to see a little bit of follow through in one direction or the other in order to get a sizable position right now. think volatility is the one thing you can probably count on in a very choppy tight range.
Want to trade our USD/JPY forex analysis and predictions? Here’s a list of forex brokers in Japan to check out.
Intraday Trading:
Gold is currently trading within a narrow range of sideways movements at intraday levels.
It is aiming to build positive momentum that could help it surpass the psychological barrier at $3,000, a level it touched during last Friday’s session.
The price also managed to shake off the bullish exhaustion, as indicated by the RSI signals.
Next Price Target:
The next target is set at $3,055, according to the short-term symmetrical triangle pattern.
This target comes amid strong control by the primary uptrend and price trading in line with the trendline.
Positive Scenario:
The bullish scenario hinges on the price remaining above the support level at $2,950.
A break below this level could trigger downward pressure and potentially initiate a corrective wave that may take some time to unfold.
To get our more detailed analysis and 100% accurate signals provided by Best Trading Signal, subscribe to Economies.com VIP Club through the link below!


")
