The main category of Forex News.
You can use the search box below to find what you need.
[wd_asp id=1]
The main category of Forex News.
You can use the search box below to find what you need.
[wd_asp id=1]
Today, Thursday, crude oil consolidated forming an inside day with a high of $63.73 and low at $62.40. There are a couple indications of weakness provided from the day. Notice that the day’s range is in the lower half of Wednesday’s range, and at the time of this writing, crude oil is trading below the halfway point of the range and looks likely to close in a similar relatively bearish position. Moreover, the high for the day found resistance at a significant price level from May 2023 (dashed horizontal). That was the lowest traded price for crude oil until the recent sharp fall.
A decline below today’s low provides the next sign of weakening, while a deeper bearish retracement is signaled on a drop below Wednesday’s low of $61.94. Notice that there is also a small rising trend line across the bottom of recent price action. That line will already be broken if Wednesday’s low is triggered. If the decline is triggered there are two key areas to watch for support. The first is at a recent interim swing low of $60.40 and the 50% retracement at $60.27. Then, further down is a range from $59.08 to $58.86, defined by the 61.8% Fibonacci retracement and prior daily support, respectively.
There is one more day to the week with crude oil set to establish a second consecutive higher weekly high and higher weekly low. It reflects short term strength. But bearish price action following this week’s high puts crude oil in a position to end lower for the period and likely below last week’s high of $64.72. Therefore, the upside weekly breakout would not be confirmed on that time frame.
For a look at all of today’s economic events, check out our economic calendar.
Gold price recovered the $3,300 mark late on Wednesday, extending its recovery up to $3,367.67 in the early Asian session. The XAU/USD pair, however, retreated from such a high and spent most of the day consolidating in the current $3,330 area, as a better market mood keeps safe-haven assets out of investors’ radar.
Sentiment was mixed throughout the day, with caution present through the Asian and European sessions amid headlines coming from China, indicating that there were no ongoing discussions with the US on tariffs, according to a Ministry of Commerce Spokesperson.
Market players reduced expectations of a deal coming up, despite United States (US) President Donald Trump stating a meeting with China on trade issues was held in the American morning.
Wall Street shrugged off the negative tone of its overseas counterparts, with major indexes extending their advances and holding on to gains at the time of writing, which further draws attention from safe-haven Gold.
Meanwhile, the US released a slew of mixed macroeconomic data. Durable Goods Order improved to 9.2% in March, much better than the 2% forecast. Initial Jobless Claims were slightly worse than anticipated, up to 222K vs the 21K expected. March Existing Home Sales, however, fell by 5.9%, worse than the -3% anticipated. Finally, the April Kansas Fed Manufacturing Activity index, with posted -5, worse than the 1 from March.
From a technical point of view, the XAU/USD pair is up on the day, although it remains contained within Wednesday’s range. Technical indicators have changed course and aim north within positive levels, gaining fresh impetus and supporting additional gains. At the same time, the pair keeps developing far above all its moving averages, with a bullish 20 Simple Moving Average (SMA) currently at around $3,182, advancing well above also bullish 100 and 200 SMAs.
The 4-hour chart shows that the XAU/USD pair is comfortably consolidating, with technical readings suggesting a bearish twist. The bright metal keeps developing below a mildly bearish 20 SMA, providing dynamic resistance at around $3,370, although the longer moving averages maintain their bullish slopes well below the current level. Finally, technical indicators remain directionless within negative levels. A break through the aforementioned 20 SMA at around $3,370 should open the door for a more sustainable rally.
Support levels: 3,314.50 3,301.40 3,288.70
Resistance levels: 3,344.60 3,358.10 3,370.00
Today’s low completed a $2.04 or 41.7% decline in the price of natural gas in 32 days, when measured from the recent trend high of $4.90 (A). Since the February 2024 low, the biggest bearish correction was 40.7%, starting after the $3.16 swing high in June. Therefore, on a percentage basis there is price symmetry between the two downswings, which can sometimes lead to a completion of the correction.
But since new bearish signs were seen this week, with a drop below a prior swing low and the 200-Day MA, the potential to eventually decline to test support around the lower uptrend line (purple), increases. That trendline is part of a large rising parallel trend channel that reflects a degree of symmetry within the price structure of the long-term uptrend.
Nevertheless, further bearish indications follow a rejection of natural gas from the top of the channel. It indicates that sellers remain in charge, with renewed enthusiasm. Once one side of the pattern is tested and leads to a reversal, the other side of the pattern becomes a potential target. Whether the lower line is reached or not, the next lower price target becomes more likely to be hit. Moreover, in addition to the purple uptrend line that represents potential support, a top line for a previous large symmetrical triangle pattern is also nearby.
Despite the continued bearish indications, today’s low tested support at the anchored volume weighted average price (AVWAP) (light blue) level measured from the February 2024 low. That highlights today’s low as a potentially significant support level. It is worth keeping an eye on as the higher swing low from October was a successful test of support around the same AVWAP line. Keep in mind that since there was a slight undercut of the line, it was followed by a quick recovery. A similar scenario could unfold with the current correction.
For a look at all of today’s economic events, check out our economic calendar.
April 24, 2025 – Written by Frank Davies
STORY LINK GBP/USD Forecast: Pound Sterling Bullish, Next Resistance at 1.34
The Pound to Dollar exchange rate (GBP/USD) again found support close to 1.3250 and traded close to 1.3300 in Europe on Wednesday as the dollar retreated from Wednesday’s highs.
Volatility has eased to some extent, but underlying stresses remain substantial with choppy trading.
According to Scotiabank; “We look to near-term support between 1.3220 and 1.3250 and resistance between 1.3400 and 1.3420.”
MUFG is still not convinced that there is a lot of mileage in the dollar rebound; “While further steps to water down/reverse tariffs would be positive developments, we are not convinced that recent developments are sufficient yet to support a more sustained rebound for the US dollar at the current juncture.”
There have been further media headlines suggesting that the Trump Administration is planning a more conciliatory stance towards tariffs, although the underlying details have tended to be less favourable, reinforcing uncertainty.
According to Rabobank; “Pantomime policies produce pantomime markets.”
It added; “This has been fully evident in the oscillating price action in recent sessions with Trump’s ‘he’s behind you, oh no he isn’t!’ approach to governing not only prompting market reversals but even arguably resulting in the same driver provoking two diametrically-opposed reactions.”

Scotiabank commented; “The positive spin on trade reflects the reality that, at this point, the US may need an off-ramp more than China does. The Chinese leadership has not picked up the phone for the White House by some accounts and talks with China on trade have not been held even at low diplomatic levels.
It added; “It seems that there is little appetite in China to make concessions and any agreement is a long way off. Relief for the USD may be temporary as trade uncertainty will continue to shade US economic prospects.”
Underlying economic pressures will build quickly amid logistics challenges and pricing pressures.
According to Rabobank; “with a de facto US-China trade embargo in place, the US economy could see shortages on shelves within weeks and/or of price rises; and even if there is a tariff U-turn, logistics would then be overwhelmed.”
The Beige Book reported that the outlook in several districts worsened considerably as economic uncertainty around tariffs rose. Immediate pricing dynamics were little changed, but most Districts noted that firms expected elevated input cost growth resulting from tariffs.
There is still a high degree of uncertainty, especially given lags and attempts to buy goods ahead of price increases and there will be mixed official data in the short term.
At this stage, markets are pricing in just below a 60% chance of a June rate cut, but the Fed will be in a very difficult position if inflation pressures increase.

MUFG commented; “The US dollar could derive more support going forward if the US economy does not slow as much as feared making it harder for the Fed to cut rates as much as currently priced in.”
International Money Transfer? Ask our resident FX expert a money transfer question or try John’s new, free, no-obligation personal service! ,where he helps every step of the way,
ensuring you get the best exchange rates on your currency requirements.
TAGS: Pound Dollar Forecasts
April 24, 2025 – Written by David Woodsmith
STORY LINK Euro to Dollar Forecast: Crucial EURUSD Support Near 1.13
After finding support above 1.1300, the Euro to Dollar exchange rate (EUR/USD) posted strong gains to just below 1.14 on Thursday before settling just above 1.1350 as the dollar’s recovery from 3-year lows ran out of steam and better than expected data helped protect the Euro.
Scotiabank commented on the short-term outlook; “EURUSD remains in an uptrend, with a clear sequence of higher lows and higher highs. Recent support has been observed in the 1.1280 area and near-term resistance appears limited ahead of 1.15.”
According to ING; “The 1.130 area is key: in the past couple of weeks, attempted EUR/USD corrections faced heavy buying interest around that level. A decisive break below 1.130 can open the door for a bigger leg lower.”
Goldman Sachs chief economist Jan Hatzius noted the perils of forecasting; “I often dodge questions about the dollar. A large body of academic literature and my own experience as an economic forecaster have taught me that predicting exchange rates is even harder than predicting growth, inflation and interest rates.”
He does, however, have strong views; “But with all due humility, I believe that the recent dollar depreciation of 5% on a broad trade-weighted basis has considerably further to go.”
Hatzius pointed to two historical periods with similar dollar valuations to the present day – the mid-1980s and early 2000s – and these set the stage for a 25-30% depreciation.
Markets are continuing to monitor trade related headlines very closely, but there have been no major developments surrounding tariff talks on Thursday.
MUFG commented; “While further steps to water down/reverse tariffs would be positive developments, we are not convinced that recent developments are sufficient yet to support a more sustained rebound for the US dollar at the current juncture.”
Scotiabank added; “Grounds for optimism on trade should remain in check, I think which will serve to keep the USD on the defensive.”
There was further relatively dovish rhetoric from Fed Governor Waller who stated that he expects tariff-related price increases would be a on-off event and that we would be willing to look through price increases.
Waller also stated that the focus on data brings the risk of being too late on policy action.
The German IFO business confidence index edged higher to 86.9 for April from 86.7 previously and significantly above consensus forecasts of 85.1.
There was a net improvement in the current conditions index with only a small retreat in the expectations component.
According to the IFO; “Uncertainty among the companies has increased. The German economy is preparing for turbulence.”
ING commented; “All in all, today’s Ifo index comes as a positive surprise.”
The bank, however, put this into perspective; “Still, we caution against too premature optimism. There are currently more unknowns than knowns for the German economy, and we continue to expect another year of stagnation – which would mark the first time ever for Germany to go through three consecutive years without growth.”
ECB rhetoric remains relatively dovish with the potential for further rate cuts while there were also reports from within the central bank that is considering changing strategy to enable more nimble moves.
International Money Transfer? Ask our resident FX expert a money transfer question or try John’s new, free, no-obligation personal service! ,where he helps every step of the way,
ensuring you get the best exchange rates on your currency requirements.
TAGS: Euro Dollar Forecasts
Silver price (XAG/USD) retraces to near $33.30 during North American trading hours on Thursday from an almost three-week high of $33.70 posted earlier in the day. The white metal corrects as investors become hopeful of significant de-escalation in trade war between the United States (US) and China.
Investors’ confidence on normalizing trade relations between the world’s two largest powerhouses increased after US President Donald Trump assured of making a deal with Beijing. Discussions with Beijing are going well, and I think that we will reach a deal,” Trump said on Tuesday.
Additionally, US Treasury Secretary Scott Bessent has signaled that both nations can reduce additional tariffs imposed recently. “I don’t think either side believes that the current tariff levels are sustainable, so I would not be surprised if they went down in a mutual way,” Bessent said on Wednesday.
A report from the Wall Street Journal (WSJ) showed on Wednesday that the White House can lower additional import duties roughly between 50%-65%.
Meanwhile, China has given ultimatum to the US to “completely cancel all unilateral tariff measures” if it wants trade talks, according to a spokesperson from Chinese commerce ministry, Financial Times (FT) reported.
Positive comments from Washington for resolving trade disputes between the US and China have diminished fears of a global economic turmoil. Theoretically, the scenario weighs on the safe-haven demand of the Silver price. However, improving relations between them increase the demand of Silver as industrial metal.
Silver has application in various industries, such as Electric Vehicles (EV), electronic alliances, power and cables, mining etc.
Silver price tests the breakout region of the consolidation around $33.10 formed on the daily timeframe. The 20-day Exponential Moving Average (EMA) near $32.55 continues to provide support to the Silver price.
The 14-day Relative Strength Index (RSI) reaches near 60.00. A fresh bullish momentum would emerge if the RSI breaks above 60.00.
Looking up, the March 28 high of $34.60 will act as key resistance for the metal. On the downside, the April 11 low of $30.90 will be the key support zone.
Silver is a precious metal highly traded among investors. It has been historically used as a store of value and a medium of exchange. Although less popular than Gold, traders may turn to Silver to diversify their investment portfolio, for its intrinsic value or as a potential hedge during high-inflation periods. Investors can buy physical Silver, in coins or in bars, or trade it through vehicles such as Exchange Traded Funds, which track its price on international markets.
Silver prices can move due to a wide range of factors. Geopolitical instability or fears of a deep recession can make Silver price escalate due to its safe-haven status, although to a lesser extent than Gold’s. As a yieldless asset, Silver tends to rise with lower interest rates. Its moves also depend on how the US Dollar (USD) behaves as the asset is priced in dollars (XAG/USD). A strong Dollar tends to keep the price of Silver at bay, whereas a weaker Dollar is likely to propel prices up. Other factors such as investment demand, mining supply – Silver is much more abundant than Gold – and recycling rates can also affect prices.
Silver is widely used in industry, particularly in sectors such as electronics or solar energy, as it has one of the highest electric conductivity of all metals – more than Copper and Gold. A surge in demand can increase prices, while a decline tends to lower them. Dynamics in the US, Chinese and Indian economies can also contribute to price swings: for the US and particularly China, their big industrial sectors use Silver in various processes; in India, consumers’ demand for the precious metal for jewellery also plays a key role in setting prices.
Silver prices tend to follow Gold’s moves. When Gold prices rise, Silver typically follows suit, as their status as safe-haven assets is similar. The Gold/Silver ratio, which shows the number of ounces of Silver needed to equal the value of one ounce of Gold, may help to determine the relative valuation between both metals. Some investors may consider a high ratio as an indicator that Silver is undervalued, or Gold is overvalued. On the contrary, a low ratio might suggest that Gold is undervalued relative to Silver.
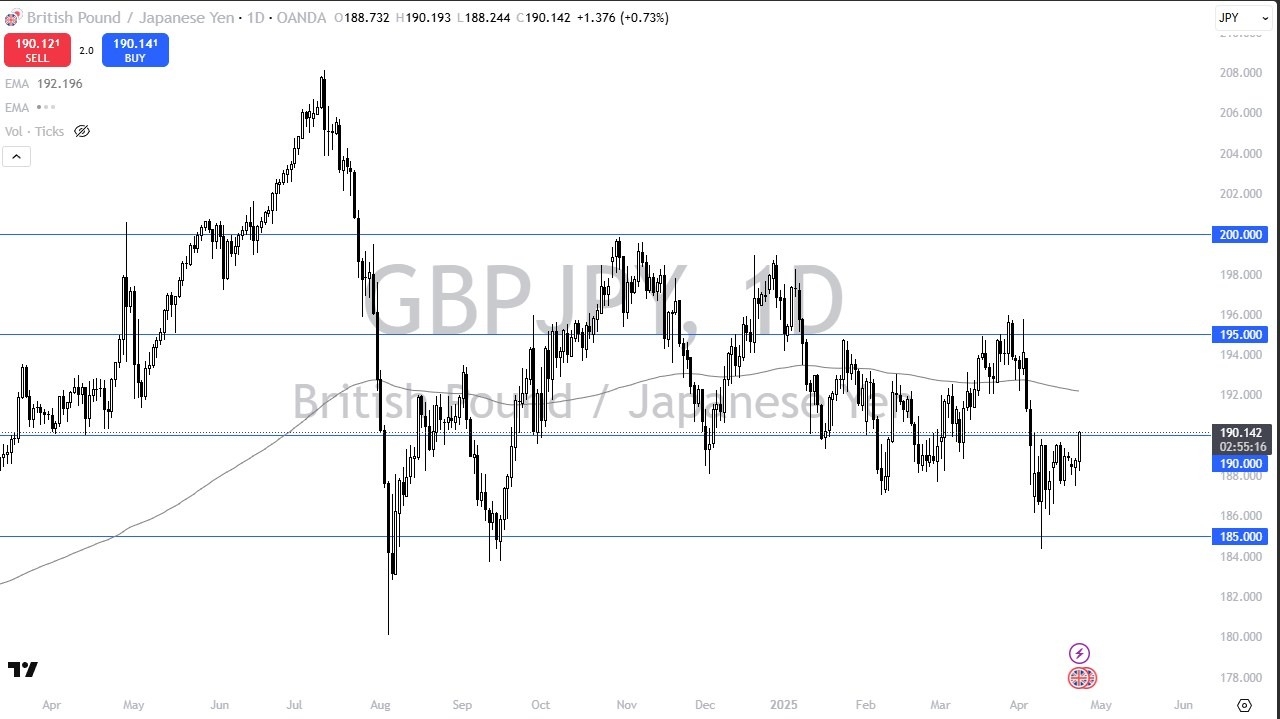
Obviously, breaking above the ¥190 level is a very bullish sign, and therefore it does open up the possibility that the British Pound continues to go much higher. The 50 Day EMA is sitting right around the ¥191 level, so that might be our first barrier. If we can clear that area, then the 200 Day EMA, just above the ¥192 level, is your next potential target.
After that, the British pound could go looking to the ¥195 level. This of course would be a major coup for the British pound bulls, and an area that should see a lot of resistance. If we can break above there, then it changes the entire outlook for this pair.

That being said, rallying to the ¥195 level would not be as crazy as it sounds, because it would just be a return to the previous consolidation area that we had been in. After all, this was the ceiling previously for several months, so return to testing that makes quite a bit of sense.
If we were to break down from here, the ¥188 level is very important, and breaking below there could open up a move all the way down to the ¥185 level. While that doesn’t seem as likely, it is something that you need to keep in the back of your mind for potential targeting.
Begin trading our daily forecasts and analysis. Here is a list of Forex brokers in Japan to work with.
Markets are increasingly pricing in a June rate cut, with the CME FedWatch Tool showing odds above 60% for at least one reduction this summer. The Federal Reserve’s Beige Book, released Wednesday, pointed to slowing labor market momentum and tepid consumer spending.
“Growth is modest and uneven,” the report noted, signaling that conditions could soon warrant a policy response.
Non-yielding assets like gold benefit from a lower interest rate environment. With traders anticipating as many as three cuts in 2025, gold’s resilience reflects a hedge against weakening macroeconomic data and declining yields.
The U.S. Dollar Index slipped from recent highs as Treasury Secretary Scott Bessent dismissed reports of unilateral tariff reductions, underscoring continued uncertainty around the U.S.-China trade dialogue. A weaker dollar typically boosts demand for dollar-denominated assets, lending support to bullion.
A preliminary reading of S&P Global’s April PMI showed mixed results: manufacturing ticked higher, while services slowed, adding to investor caution. Looking ahead, Jobless Claims and Durable Goods Orders will provide the next major data points.
While gold remains range-bound, its ability to hold above $3,300 amid improving sentiment suggests persistent underlying demand driven by macro and policy uncertainty.
According to Forex trading, the British pound declined against most other major currencies following the release of the latest UK services PMI data. The preliminary Purchasing Managers’ Index (PMI) for April revealed a marked decline in the UK’s vital services sector, falling below the 50-point threshold for the first time in 18 months, the dividing line between growth and contraction.
Amid ongoing global disruptions stemming from US President Donald Trump’s tariffs, this month’s services sector data reflected broader economic challenges, leading to decreased demand for the British pound in mid-week trading.
The British pound will remain the best performer amid market pressure on the dollar due to Trump’s trade wars, with Britain relatively insulated from the tension.
According to recent trading and across stock trading platforms, the UK’s FTSE 100 index closed higher by approximately 0.9% at 8,403 points, tracking gains in major stock markets amid trader optimism that trade tensions between the US and China would soon ease. At the same time, concerns about the independence of US monetary policy subsided. Meanwhile, traders monitored the April Manufacturing and Services PMI data, along with major corporate earnings results. The latest data showed UK business activity returning to contraction in April, at its fastest rate in over two years.
According to stock prices, Croda International shares rose by 8.2%, leading the index, after the chemical group reported strong first-quarter sales. On the other hand, Fresnillo shares were among the biggest losers, falling by 5.2%, as the precious metals mining company reported a decrease in silver and gold production in the first quarter despite reaffirming its full-year production outlook.
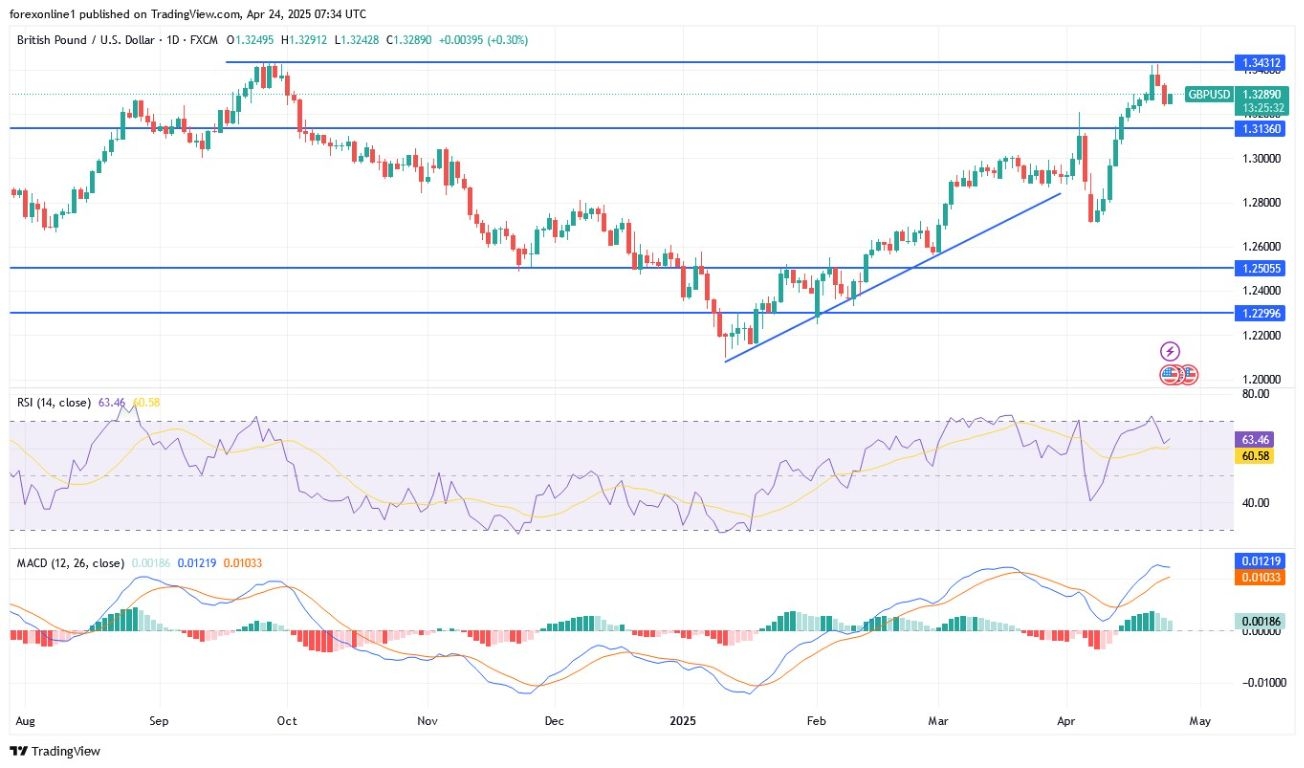
According to recent trading, the GBP/USD pair has recently retreated from its highs near 1.3490, suggesting a potential corrective move within the broader bullish trend. The pair is currently testing key Fibonacci retracement levels that could provide significant support areas for buyers. After reaching overbought conditions, the price has declined towards the 38.2% Fibonacci retracement level at 1.3153, which could offer initial support. Should selling pressure persist, the 50% retracement level at 1.3068 and the 61.8% level at 1.2983 could form the next key support areas. The 61.8% Fibonacci level is particularly important as it coincides with a previous resistance area that could now act as support.
From a broader trend perspective, the GBP/USD pair maintains its bullish structure on the daily timeframe, as evidenced by the series of higher lows and higher highs since March. The 100-day Simple Moving Average (SMA) remains above the 200-day SMA, confirming that the dominant trend is upward.
At the same time, both moving averages are trending upwards, reinforcing the bullish bias. The pair is also trading above an ascending trendline that has supported price action since early March. However, momentum indicators suggest some caution. The Stochastic oscillator is trending downwards from the overbought zone, indicating the potential for continued downward pressure in the near term. Similarly, the Relative Strength Index (RSI) has declined from elevated levels and has room to fall before reaching oversold conditions.
Looking ahead, if the current pullback finds support at any of the aforementioned Fibonacci levels, the GBP/USD pair could resume its bullish trend towards its recent highs and potentially target the 1.3600 area. Conversely, a break below the 61.8% Fibonacci level and the ascending trendline could signal a deeper correction towards the 100% Fibonacci retracement level at 1.2707.
Ready to trade our GBP/USD daily forecast? We’ve shortlisted the best regulated forex brokers UK in the industry for you.
The EURJPY pair provided several slow sideways range trading, due to its neediness to the negative momentum, but its main stability below the bearish channel’s resistance at 163.00 makes us keep the negative suggestion in the near and medium period trading.
Stochastic exit from the overbought level will increase the chances for gaining negative momentum, to reinforce the chances of targeting negative stations, which might begin at 161.30 and 160.30, while moving to the bullish track requires forming a strong bullish attack, to provide several positive closes above 163.25 level, then begin recording several gains by its rally to 164.20.
The expected trading range for today is between 160.35 and 162.65
Trend forecast: Bearish
Do you need help in trading decisions? Do you want to learn how to start trading?
Join Economies.com VIP Club and benefit from over 15 years of market analysis expertise and get:
Special Offer: Subscribe to the Economies.com VIP channel and get also a free subscription to a trusted trading signals channel provided by Best Trading Signal.